Rev. bras. oceanogr.. 48(2): 119-130. 2000
The meiofauna
asssociated
whith
Sargassum
cymosum
at
Lázaro Beach, Ubatuba, São Paulo
Rita R. Curvelo* & Thai"sN. Corbisier
Instituto Oceanográfico da Universidade de São Paulo (Caixa Postal 66149, 05315-970 São Paulo, SP, Brasil)
*e-mail: curvelo@usp.br
.
Abstract: In this study, the meiofauna associated with Sargassum cymosum wasqualitatively and quantitatively analyzed between December 1990 and July 1991. Sampling was carried out on a móderately exposed shore at Lázaro Beach, Ubatuba (32°S - 45°W). Each alga was washed in a formaldehyde solution and the fauna in suspension was washed through a series of 500, 250, 120 and 60 /-lmmesh sieves. The biomass of each taxonomic group was estimated as ash-fTee dry weight (AFDW) according to size categories. AIgae volume and dry weight were determined, including epiphytes. Densities of epifauna ranged fTom 502.9 to 2706.6 ind.20 mrl as algae volume. The biomass values (326.6 to 1214.4 /-lg.20mr1 AFDW) represented a low standing stock. Harpacticoid copepods and their nauplii were the dominant group and also showed the highest biomass values, being represented by larger individuais (250 to 120 f!ill). Higher values were observed between the end of the summer and the beginning of the fali (March and April), decreasing until winter (July). This variation may be explained by habitat complexity changes, or reproduction of some taxa, as higher meiofaunal densities were found on the 60 /-lmmesh sieve, including high percentages of nauplii.
.
Resumo: Este trabalho avalia qualitativa e quantitativamente a meiofauna associada aSargassumcymosumestimando-sea densidadee biomassada fauna,assim como uma
possívelvariaçãotemporal.As coletasforamrealizadasà nordesteda Praia do Lázaro,
Ubatuba (23°S
-
45°W), de dezJ90 a jul/9I. As fTondesforam mergulhadas em soluçãode água e formaldeído, e os organismos em suspensão retidos em uma série de malhas (500,250, 120 e 60 /-lm).Para cada grupo taxonômico foi estimada a biomassa em /-lgde peso seco livre de cinzas. Como medida de substrato foi determinado o volume e a biomassa em peso seco de alga, incluindo-se as algas epífitas. Os valores de densidade da meiofauna variaram entre 502,9 a 2706,6 ind.20 mr1 de alga. A biomassa estimada por sua vez apresentou valores baixos, entre 326,6 a 1214,4 /-lg.20mr1 peso seco livre de cinzas. Copepoda Harpacticoida e seus náuplios foram dominantes numericamente e em relação à biomassa. Os valores de densidade e biomassa da meiofauna foram altos no final do verão (março) e início do outono (abril), e diminuíram gradativamente até o início do inverno Gulho). Esta variação pode ser explicada por mudanças na complexidade do habitat ou, ainda, devido ao período reprodutivo de alguns táxons, já que a maior quantidade de meiofauna ocorreu na malha de 60 /-lm(n,áuplios).
.
Descriptors:Meiofauna, Phytal,Sargassum,Ubatuba, São Paulo..
Descritores:Meiofauna, Fital,Sargassum,Ubatuba, São Paulo.120
Introduction
The phytal meiofauna consists of predictably dominant forms, such as representatives of the Nematoda, Copepoda, Ostracoda, Acari, Turbellaria,
Oligochaeta, Rotifera, Tardigrada, Polychaeta,
Kinorhyncha and Gnathostomulida. Generally the former four taxa represent slightly more than 98% of the whole community (Hicks, 1985). Although the meiofauna shows lower values of biomass than the
macrofauna on macroalgae, it exceeds the
macrofauna numeriCally and contributes with about 25% of the total secondary production, thus constituting an important component (Gibbons & Griffiths, 1986).
Invertebrates occupy a variety of
microhabitats on macroalgae, such as the surface of leaves, the base of the fronds and the interstices of
ramifications, where silt, clay and detrit.us
accumulate. The meiofauna can attain higher
densities on algae with a complex surface
morphology, which facilitates the deposition of sediments and detritus, while lower densities are observed on algae living on exposed rocky shores, with a reduced morphological structure (Hicks, 1980).
The seasonal fluctuationof populations
associated with the algae is related to variations in water temperature, the growth cycles of the algae (Mukai, 1971; Kito, 1975; 1982) and an increase in biomass of epiphytes (Johnson & Scheibling, 1987; Martin-Smith, 1993; Jarvis & Seed, 1996) or can also result either from the periodicity of the reproductive activity or from the availability of food (Hicks, 1977; Johnson & Scheibling, 1987).
)~
~
BRADL\S~~
<
Rev. bras. oceanogr., 48(2), 2000
There are no specific studies on meiofauna associated with algae in Brazil, although some studies
on macrofauna fromSargassum,such as Montouchet
(1979), Tararam & Wakabara (1981) and Tanaka & Leite (1998), include part of the larger meiofauna.
Masunari (1982, 1983) used a mesh ~e small
enough to collect both the macro and meiofauna of
Amphiroa but did not distinguish between the two
categories.
Sargassum forms extensive coverings close
to the lower leveI of the intertidal zone and also in the shallow subtidal zone on the rocky shores of the southeastern Brazilian coast. On Lázaro Beach, S.
cymosumvarocymosumis found in the intertidal zone
(Paula, 1978; Eston, 1987).
The present study seeks, qualitatively and quantitatively to evaluate the meiofauna associated with Sargassum cymosum C. Agardh, and estimate
the density and biomass ofthe taxa and their temporal variation.
Material and methods
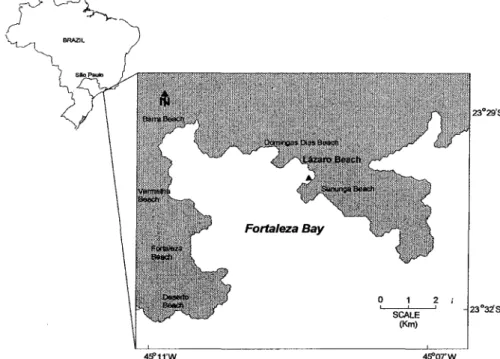
The samples were collected on the
rocky northeastern shore of Lázaro Beach (23°S
-45°W), in Fortaleza Bay, Ubatuba, São Paulo
State (Fig. 1). The rocky shore is moderately
exposed to wave action. It is a shallow area, with
water depth of about 2 m (Eston, 1987).
Promontóries formed by spurs projecting from the base of the mountain chain limit the extension of Lázaro Beach.
Fortaleza Bay
4S'11'W
o, 1I 21
SCALE (Km)
Fig. 1. Map ofLázaro Beach, Ubatuba, SP, showing study site ( ).
CURYELO & CORBISIER: Meiofauna associated whith Sargassum cymosum 121
Samples were collected at intervals of one to two months during the period ITomOecember 1990 to July 1991, in late spring (01/12) and summer (18/01 and 14/03), autumn (15/04 and 30/05) and winter (26/07). Ouring each sampling period, 5 individual
plants of Sargassum cymosum were collected
randomly below the lowest tidallimit (with the ITonds submerged) and were immediately put into plastic bags. The algae were washed in pails containing a formaldehyde solution. The solution containing the animaIs was then sieved through a series of 500, 200, 120 and 60 lJ1llmesh size sieves to separate the organisms into different size categories and estimate the biomass (Pfannkuche & Thiel, 1988). The organisms were fixed in 4% buffered formaldehyde, stained with Rose Bengal and the taxa identified and counted.
As an estimation of measurement of the available space for the meiofauna, the volume of the algae was determined by displacement in a measurÍng cylinder. The algal biomass was determined by drying until a constant weight at 60°C was attained (Paula, 1978; Montouchet, 1979). AIgal volume and biomass
also include the epiphytic algae Hypnea, since this
algae is impossible to separate ITom Sargassum.
Temperature and salinity of the seawater were measured during the collection.
The biomass of the meiofauna was estimated in terms of ~g of ash-ITee dry weight (AFOW) for each zoological group and separated into categories by size, using the individual mean weights (Corbisier,
1993).
Harpacticoid copepods were identified to genus. One hundred of each sample were randomly separated using a Oolphus plate. For identification purposes the studies of Lang (1948, 1965a, 1965b),
Wells (1976), Coull (1977) and Huys et ai. (1996)
were used.
The data were standardized for 20 ml of algae, which represents the smallest volume collected. Oensity is expressed as number of individuaIs per 20 ml of algae and biomass as ~g per 20 ml of algae. The data were transformed into log (x+ 1) to normalize the ITequency distribution and the homogeneity of the variances was checked by Bartlett's test (Zar, 1996). Oifferences in total meiofauna and in the density and biomass of the main groups were investigated ITom month to month lIsing one-way variance analysis
(ANOVA) and Tukey's a posteriori multiple
comparison (Zar, 1996).
Density and biomass of total meiofauna, Copepoda nauplii, Copepoda juveniles and adults, and Nematoda data were analysed by non-metric multidimensional scaling ordination (NMS) (Kruskal
& Wish, 1978) using double square root
transformations with the Bray-Curtis similarity index (Clarke & Green, 1988) and Persons r correlation between variables (density and biomass) and the axes.
Enviromental variables (water temperature and
salinity, algae volume and biomass) were
superimposed on the 2-0 NMS configurations to
provide visual correlations (Fieldet ai., 1982).
Results
Environmental data
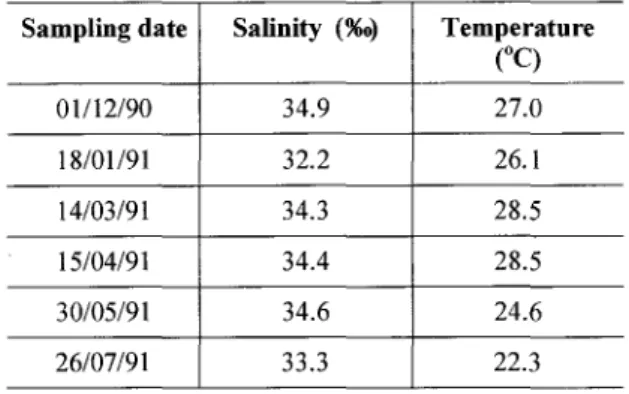
The lowest salinity value measured was 32.2, occurring in January, when a high precipitation index was observed during the sampling day and the previous day. A maximum salinity of 34.9 was measured in Oecember. Sea water temperature was lowest in July (22.3°C) and highest in March and April (28.5°C) (Table 1).
Table I. Environmental data fiom Lázaro Beach. Ubatuba.
Sargassum cymosum
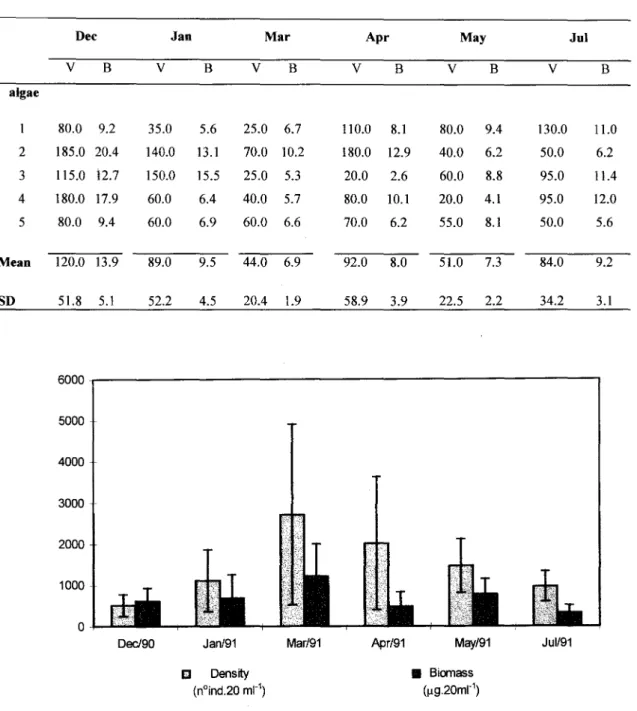
The average biomass of the algae varied ITom6.9 g dry weight (:t1.9) in March to 13.9 g dry weight (IS.I) in Oecember, which corresponds to months of minimum and maximum variation in volume, respectively (Table 2).
Meiofauna
The lowest density of the meiofauna was observed in Oecember, with an average of 502.9 indo 20 mrl (:t269.3), whereas the highest average
occured in March with 2706.6 indo 20 mr1
(:t2194.6) (Fig. 2). The estimated biomass was
lowest in July, with an average of 326.6 ~g 20
mrl (::1::190.4),and highest in March, with an
average of 1214.4 ~g 20 ml-I (:t779.5) (Fig. 2). ANOVA results show significant differences in density and biomass of the meiofauna as between months (Tables 3 and 4).
Sampling date Salinity (%0) Temperature
eq
01/12/90 34.9 27.0
18/01/91 32.2 26.1
14/03/91 34.3 28.5
15/04/91 34.4 28.5
30/05/91 34.6 24.6
6000
5000
4000
3000
2000
1000
o
Decl90 Jan/91 Mar/91
EI Density
(nOind.20 ml,1)
Apr/91 May/91 Jul/91
. Biomass
(1l9.20mr1)
Fig. 2. Meiofauna mean density (nOind.20 mI'l) and biomass (/-lgof ash-fi'ee dry weight. 20mr1) onSargassum cymosum.
Values found for the total density of the meiofauna show that in December (late spring) density was lowest, distinguishing this month ITom March and April (summer and early autumn), when values were higher. Copepod nauplii, the most abundant organisms, folIowed by adult and juvenile copepods, and Nematoda showed a similar pattern of density variation as welI, both having high densities in March (late summer). Some taxa had lowest densities in the spring (Decernber) and early summer (January). Other taxa which showed highest abundance mainly in December and/or March were
Acari, Ostracoda, Gastropoda, Gammaridea and Polychaeta, with lower densities found in April (autumn) or July (winter) (Table 3).
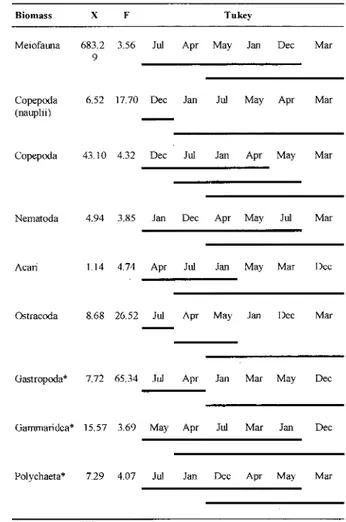
For biomass data, April (early autumn) and July (winter) showed the lowest values, contrasting with March, when the highest values occurred. Copepoda was the most abundant group, with alI stages presenting maximum values in March
(summer). The ANOVA and the a posteriori
comparison results of the biomass of the main groups among the different colIections showed the same general groupings as observed for density (Table 4).
122 Rev.bras.oceanogr.,48(2),2000
Table 2. Volume (V, ml) and biomass (B, g dry weight) ofSargassum cymosum onLázaro Beach, Ubatuba.
Dec Jan Mar Apr May Jul
V B V B V B V B V B V B
algae
80.0 9.2 35.0 5.6 25.0 6.7 110.0 8.1 80.0 9.4 130.0 11.0
2 185.0 20.4 140.0 13.1 70.0 10.2 180.0 12.9 40.0 6.2 50.0 6.2
3 115.0 i2.7 150.0 15.5 25.0 5.3 20.0 2.6 60.0 8.8 95.0 11.4
4 180.0 17.9 60.0 6.4 40.0 5.7 80.0 10.1 20.0 4.1 95.0 12.0
5 80.0 9.4 60.0 6.9 60.0 6.6 70.0 6.2 55.0 8.1 50.0 5.6
Mean 120.0 13.9 89.0 9.5 44.0 6.9 92.0 8.0 51.0 7.3 84.0 9.2
CURVELO & CORBISIER: Meiofauna associated whith Sargassum cymosum 123
Table 3. One-way analysis of variance (ANOYA) and a posteriorimultiple comparison ofTukey (p<O.05) in relation to total meiofauna and main group densities.
Gastropoda* 1.52 54.25 Ju! Apr Jan Mar May Dee
Gammaridea* 1.46 3.89 May Apr Ju! Mar Jan Dee
Polyehaeta* 0.97 4.31 Ju! Jan Dee Apr May Mar
* temporary meiofatma
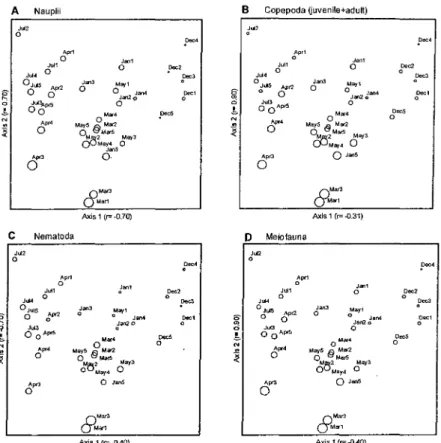
NMS configuration for the density of the meiofauna taxa studied are shown in Figure 3.
The month replicates clustered more or less
closely to each other and are arranged in a clear similar sequence (ITom right to left): December, January-March, May. and April-July, except for
March 1, 3 replicates, and the axis 2 where
variation is much more pronounced. March I, 3
replicates were always separate ITom the
remaining months' replicates. The correlation test on the double square root transformed density data
indicates that April-July densities were
significantly different ITom March 1, 3, the highest densities, and ITom December with the smallest densities.
From Figure 4 it is clear that there is no close relationship between the configuration and the natural environmental variables temperature and salinity. There is an inverse correlation mainly with algae volume, and a lesser one with biomass, with the highest volume on the upper side ofthe configuration.
Table 4. One-way analysis of variance (ANOYA) and a posteriori multiple comparison ofTukey (p<O.05)
in relation to total meiofauna and main group biomasses.
*temporary meiofalD1a
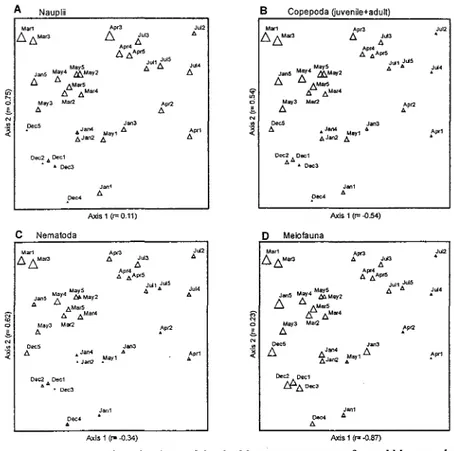
NMS configuration for the total and the
meiofaunal taxa biomass studied showed no
such clear trend as density. Nevertheless, there is some indication that Copepoda nauplii, Copepoda and Nematoda biomass varied inversely with the
volume and biomass of the algae, and the
months' replicates cluster according to a pattem
similar to that for density mainly as regards
March I, 3 which are distinct ITom the others, especiaIIy ITom the December-January and April replicates (Figs 5 and 6).
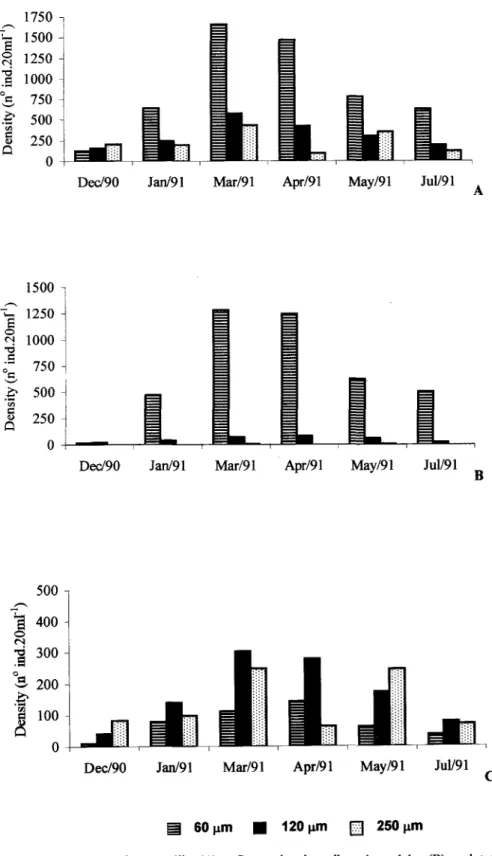
ln relation to the size of the organisms, the Copepoda were observed in the greatest numbers in
the 250 and 120 f..I111meshes, except in April, when
they were more abundant in the 120 and 60 ~m meshes (Fig. 7 and Table 5).
Eight genera of Hapacticoid Copepods were
identified: Tisbe sp., Ectinossoma sp., Diarthrodes
sp.,Amphiascus sp.,Laophonte sp.,Scutellidium sp., Harpacticus sp. and Tegastes sp. The Tisbe and Ectinossomagenera were the most abundant.
Density X F Tnkey
Meiofatma 1459. 4.52 Dee Ju! Jan May Apr Mar
6
Copepoda 50.8320.14 Dee Jan Ju! May Apr Mar
(naup1ii)
-Copepoda 25.99 4.18 Dee Ju! Jan Apr May Mar
Nematoda 8.65 4.74 Dee Jan Apr May Ju! Mar
Aeari 4.46 5.30 Apr Ju! May Jan Mar Dee
Ostraeoda 3.71 26.90 Ju! Apr May Jan Dee Mar
Biomass X F Tukey
Meiofatma 683.2 3.56 Ju! Apr May Jan Dee Mar
9
-Copepoda 6.52 17.70 Dee Jan Ju! May Apr Mar
(nauplii)
-Copepoda 43.10 4.32 Dee Ju! Jan Apr May Mar
Nematoda 4.94 3.85 Jan Dee Apr May Ju! Mar
Aeari Ll4 4.74 Apr Ju! Jan May Mar Dee
Ostraeoda 8.68 26.52 Ju! Apr May Jan Dee Mar
Gastropoda* 7.72 65.34 Ju! Apr Jan Mar May Dee
-Gammaridea* 15.57 3.69 May Apr Ju! Mar Jan Dee
124
A Nauplii B Copepoda ijuvenile+aduli)
Rev. bras. oceanogr., 48(2), 2000
Já2 o .0ec4 " .... ci, A'" o Jul, o Já' °JLd5 Apr2o o
JuI~pr5
00 M~'
May5 2Mar2 of:::;fM~
}!Jrl..2 May3 {yMay4J"'" o
o. Joo' o ~2
.
.Dec3 Joo3 o M"" o Jan4 Joo2oo o~,
N
.
.x« OA",
Ap<2
O
..DM~ UMart
Axis 1 (r= -0.70) Axis 1 (F -0.31)
c Nematoda D Meiofauna
J.2
o oJá2
,0ec4
t'" J'" o
Já' o Ju!5 Apr2
o o Jut3 Apt5 00 Joo' o ~2 o Dec3 0~2 o ."'" Joo' o May1
oJan20Jan4 o ~1
o e;-O> ci, N :.ji OoeS o DoeS o A'" O
Axis 1 (r=-OAO) Axis 1 (r= -0.40)
Fig. 3. Two dimensional NMS ordinations of the double square-root transformed density data: Copepoda nauplii (A), Copepoda juveniles plus adults (B), Nematoda (C) and total meiofauna (D) onSargassumin December/90, January, March, April, May and July/91. The scaling of symbols on these diagrams can be deduced from tables 1 and 2.
A Temperature B Salinity
"M~
.-~ ~
.
Mar3Axis 1 (~0.27) Axis 1 (r= 0.30)
C Algae volume D Algae biomass
Jul2
.
.
Jul2.'
.'
"
~ ci" '=-.APrt Já'Jul4
·
Jan38Jul5
.
.
Apr2.
Jul3.
. ApiS
.
00c5.""
J.'
Jul4
·
JanJ
8JulS Apr2
.
.
.
Jan1
.
Doe2
.
.
Doe'Doe2
.
.
~,D."
.
:aY1
. .
Jan2Jan4· J""
May1
Jan2
.
.
De"
.
Ju!3.. AprS
DoeS
.
N
.
.x
« Apr4 May5, . Mar4MarS
· May~ . May4 .. Mar2May3
JwS
.
. Mar4
.Apr4M~.=M~ . May4:ay3 JooS
.
.Apr3M.!!.l Axis 1 (r= 0.25)
. Mo<3
. Mar1
Axis1 (1'="0.37)
Fig. 4. Two dimensional NMS configuration with symbols representing values of enviromental variables superimposed on density data of meiofauna: A - Temperature; B - Salinity; C - Algae volume; D - Algae biomass. The scaling of symbols on these diagrarns can be deduced from tables 1 and 2.
pec4 Apr1 Jan1 o De02 Jut1 o o o Dec3 Já' Joo' u""
O\A5 Ap" o o Joo4 fj"<-'
" o Joo2.
m bLdbAprS o ci oS Mar4 o N Ap<' May5 M<:J2
:.ji O o Mo6
ã!/May4OMay3
Ap<2 OJ""
O
Ap" o
M J001
Jú4 o .
R °Ju15o oAp<2 oJoo3 oMay1
9 J"" J""
, o o A'" 3f\20
N
.
Ap" o Maf4:.ji o Mõ5€iMM:;
ay4 õay3
6'" o J"""
J"2
aoc,
Doe'
.
.
;ul2
.
.AP"
AP<'
;lan1 00c2
.
Jan1 Doe2Jul1
."""
;1.1I1
.
.""" JuI4·
May1
.
J'"
.
8Jul5 AP<2 Joo'
.
Doe' Jan3 May1Doe' <õ
.
.
Joo'.
Jul5 Apr2
.
.
Joo'
Jan2
.
21
..
ê"'.
.
ci J"DoeS Jljl3 OoeS ..AprS 'Ma"
.
" '.AP 'M'.
N.APf4 May5 MaIS
N
.AP" May5 MaIS Mar2 May3
· Mar2 May3
Ma aY4. May . May4 .
:""
JooS
.AP<3
Ap"
.
Curvelo & Corbisier: Meiofauna associated whith Sargassum cymosum 125
!,'ig.5. Two dimensional NMS ordinations ofthe double square-root transformed biomass data: Copepoda nauplii (A), Copepoda juveniles plus adults (B), Nematoda (C) and total meiofauna (D) on Sargassum in December/90, January, March, April, May and July/91. The scaling of symbols on these diagrams can be deduced ttom tables 1 and 2.
Fig. 6. Two dimensional NMS configuration with symbols representing values of enviromental
variablessuperimposedon biomassdataof meiofauna:A- Temperature;B - Salinity;
C - Algae volume; D - Algae biomass. The scaling of symbols on these diagrams can be deduced ttom tables 1 and 2.
A Nauplii B Cape poda Guvenile+adult)
M." Ap" Jul2 M.., Ap" Jul2
!::,. I:,.M'" !::,. J"" ..
!::,.!::,.M'" /:;. J.3 .
Apr4fj. Apr4A
/:;.t;.A'" .l:.. /:1AprS
May5 i:.UI1UI5 J"'
Jan5 May4M&May2
Jul1Jul5
JanS May4 May2 t;. .. . lU4
/:;. t;. t;.M'" I:,. I:,. M"" .
lS. t!J.Mar4 !:!. AMar4
ci M.,3 M. Ap ci M.,3 Moa Ap"
.!C A t;. -=-" /:;. ..
N J3 N
De05
0 De" 0 Jan3
A Jan4 May1 i:J. A", A ..Jan4 Ma1 t""
.ó.Jan2.l:.. A b,Jan2 .l:J.y
Oec:A Dec1. 0K3 oe<::21:J.Dec1
1J. .I.Dec3
J' J'
A
p- t.
pec4
AJOs1 (r-0.11) Axis 1 (r=-D.54)
C Nematoda D Meiofauna
M'" Ap(3 J.2 M'" Ap(3 J"'2
fl!::,.M'" A t;.J.3 .. !::"flM'" t. AJ.3 ,
Apr4
t.rxlAPr5
1:. .àApr5
Jul1Jul5 Jul4 Ju11Ju15
May4Mg.5M8Y2
t. .
t.
Jan5 A4 M5MaY2 A .. 11.14;.an5 Â
.ó.MarS !::,. b.M""
N .6. ,ô.Mar4 li l:J.MN4
"'
ci May3 M"" ci May3 M."
.!C A fpr2 .!C /:;. fpt2
N
05 N O, J3
.x A ..Jan4 1003 Ap I::. !::J.Jar14 D.
t""
.. . Jan2 aMay1
.
l:J..Jan2 t.MB'(1Oec2 Dec1
Def:.:p..0ec1
AA. Dec3 '.6.Dec3
Jan1 J1
o, . 0.04 t.
.
AAxis 1 (r= -0.34) Axis 1 (r= -0.87)
A Temperature B Salinily
Mar1 Ap" J"Q M." Ap" Jul2
.Â'"
.
,:IU!3 ... ...M." ... J"13 '"Apr4 Apr4
..AP.s ...AJX5JUI1 JulS
JanS May4Ma.!:May2 :U!, .Jul5 .Ju14 May4 M1.MaY2 '" '"
Ju14 '"
Â. j. MaIS .JanS.Â. MarS
MaJJ..Mar4 '"o MaQ ...Mar4
ci May3 Ap" ci May3 Ap"
.!C ..
.
.!C Â ...N O5 Jan3 N
0
.
J,03...
tJan4 MaY1. i:." . Jan4 May1 .
Apr1
Jan2 ... . Jan2.Â. ...
Dec2 Dec1 Dec2 Dec1
jJJ...3
De03
Jan'
I I
:an1
De,4 ... 4
...
.
Axis 1 (r= -0.39) Axis 1 (I"'"-0.28)
C Algae volume D Algae biomass
.Apr3 Jul2 M." .Ao" Jul2
M'"
.Mar3
'"J"13 .. .. ..M8r3 '"Jul3.
A,,4 A,,4
. .AprS
... ... AprSJu!1Ju15 J.4 Jul1JulS J.4
May5M 2 ...
.
'" M."'".
...ian5 My4 ... ay JanS M:y4 M>.May2
...MarS . M""
Mar2.." Mar4 MaJ2A ... Mar4
ci
f'ay3 Ap" ci May3 1'"
.!C
.
.!C ..Jan3 N "'" J.03
0
..
De05...Jan4 MaY1Â Ao" .. ... Jan4 MaY1. Ao"
.. Jan2 ... ... ÂJan2 ... ..
Dec2 Dec1 Dec2 Dec1
...De03 ...""3
J1 J1
De,4 . Doe4..
.
Â126
1750 -:- 1500E
~
1250:5 1000 0= 750'-' C 500 .;n
5 250
O O
500
-'"'"'
ã
o 400 N -d 300.51 o
E- 200
.€ '" 100
~
O
Rev. bras. oceanogr., 48(2), 2000
Decl90 Jan/91 Mar/91 Apr/91 May/91 Jul/91 A
Decl90 Jan/91 Apr/91 Jul/91
B May/91
Mar/91
Dec/90 Jan/91 Mar/91 Apr/91 May/91 Jul/91
c
§I
60~m .
120
~m EI
250~m
Fig. 7. Copepoda nauplii (A), Copepoda juveniles plus adults (B) and total meiofauna densities data (C) retained in 60, 120 e 250 ~ meshes, in the months sampled.
1500
'"'"'
-S 1250 1000
=
.-
7500='-' .8'" 500
= 250
(1)
Discussion
The comparison of studies analyzing the structure of meiofaunal communities associated with macroalgae is hindered by the lack of uniformity as regards the way in which macroalgae are quantified. Some works caIculate the number of individuaIs per wet weight or dry weight of algae; others by the number of individuaIs per algae volume or per surface area of the rock. The latter method suffers fTomthe problem of the algae size, which has very different characteristics in the third dimension. The dry weight of the algae or the volume gives a good indication of the space available for the meiofauna.
The meiofauna density observed in the
Sargassum of Lázaro Beach is within the values
found on other algae. In Brazil, studies of the phytal
communities of Sargassum were about macrofauna
and took into account only a part of the meiofauna, which makes comparisons difficult, but the values were lower than those obtained in this present study (Table 6).
ln biomass terms, the variation observed in the present study ranges fTom0.03 to 0.12 g AFDW m-2, while in South AfTica the biomass of the meiofauna in several intertidal macroalgae ranges fTom 0.01 g to 8.5 g dry weight m-2 (Gibbons & Griffiths, 1986). Copepoda represented 43% of the total meiofauna biomass, folIowed by Ostracoda, nauplii of Copepoda and Nematoda. Copepoda (adults and juveniles) were the most numerous because, besides constituting the second group in density terms, they were relativeIy large in size being present in greatest numbers in the 250 and 120 !lill meshes.
The composition of the meiofauna is the resuIt of the various characteristics of the habitat,
such as the shape and texture of the stalks of the plants, the interstices, the accumulation of sediment and detritus, the quantity of epiphytas, the degree of
protection fTom the waves and dessication
(Muralikrishnamurty, 1983; Preston & Moore, 1988). The large number of harpacticoids is correlated with the low silt-cIay texture and detritus retained in the algal substratum (Mukai, 1971; Boaden, 1996). Besides, alI the harpacticoid genera found in S.
cymosum are characteristic of the phytal habitat (Tisbe sp., Ectinossoma sp., Diarthrodes sp., Amphiascus sp., Laophonte sp., Scutellidium sp., Harpacticus sp. and Tegastes sp.), indicating a
smaller amount of sediment on the algae (Hicks, 1985). These genera are adapted to a fTee-swimming existence and also show a dorso-ventrally depressed
body(Scutellidiumsp.) to stickto the substratum,or
present the first differentiated pair of jaws and maxillipeds sufficientIy welI deveIoped to hold on to
the algal substratum(Laophontesp) (Hicks & CoulI,
1983).
The meiofauna showed a seasonal trend in density and estimated biomass. The abundance was highest in Iate summer (March) and early autumn (April), decreasing gradualIy until the winter (July). However, seasonal changes were not cIear for individual taxa. Two groups can be distinguished, one incIuding nauplii and aduIts of Copepoda, Nematoda, Ostracoda and Polychaeta, with its highest density in Iate summer (March), and another incIuding the Acari, Gastropoda and Gammaridea with its highest density in Iate spring (December). To confirm the
observed seasonal trend in the densities of the
main taxa specific further study of these taxa is necessary which has so far been impossible due to a lack of specialists in some of the taxa (Jarvis & Seed, 1996).
CURVELO & CORBISIER: Meiofauna associated whith Sargassum cymosum 127
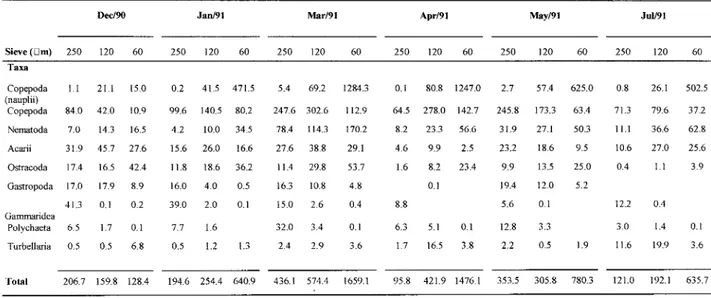
Table 5. Average densities (nO indo 20 mr1) ofthe meiofauna taxa in the various sieves. during the study.
Decl90 Jan/91 Mar/91 Apr/91 May/91 Jul/91
Sieve (Dm) 250 120 60 250 120 60 250 120 60 250 120 60 250 120 60 250 120 60 Taxa
Copepoda 1.1 21.1 15.0 0.2 41.5 471.5 5.4 69.2 1284.3 0.1 80.8 1247.0 2.7 57.4 625.0 0.8 26.1 502.5 (nauplii)
Copepoda 84.0 42.0 10.9 99.6 140.5 80.2 247.6 302.6 112.9 64.5 278.0 142.7 245.8 173.3 63.4 71.3 79.6 37.2 Nematoda 7.0 14.3 16.5 4.2 10.0 34.5 78.4 114.3 170.2 8.2 23.3 56.6 31.9 27.1 50.3 11.1 36.6 62.8
Acarii 31.9 45.7 27.6 15.6 26.0 16.6 27.6 38.8 29.1 4.6 9.9 2.5 23.2 18.6 9.5 10.6 27.0 25.6 Ostracoda 17.4 16.5 42.4 11.8 18.6 36.2 11.4 29.8 53.7 1.6 8.2 23.4 9.9 13.5 25.0 0.4 1.1 3.9 Gastropoda 17.0 17.9 8.9 16.0 4.0 0.5 16.3 10.8 4.8 0.1 19.4 12.0 5.2
41.3 0.1 0.2 39.0 2.0 0.1 15.0 2.6 0.4 8.8 5.6 0.1 12.2 0.4
Gammaridea
Polychaeta 6.5 1.7 0.1 7.7 1.6 32.0 3.4 0.1 6.3 5.1 0.1 12.8 3.3 3.0 1.4 0.1
Turbellaria 0.5 0.5 6.8 0.5 1.2 1.3 2.4 2.9 3.6 1.7 16.5 3.8 2.2 0.5 1.9 11.6 19.9 3.6
128 Rev. bras. oceanogr.. 48(2). 2000
AliTHOR
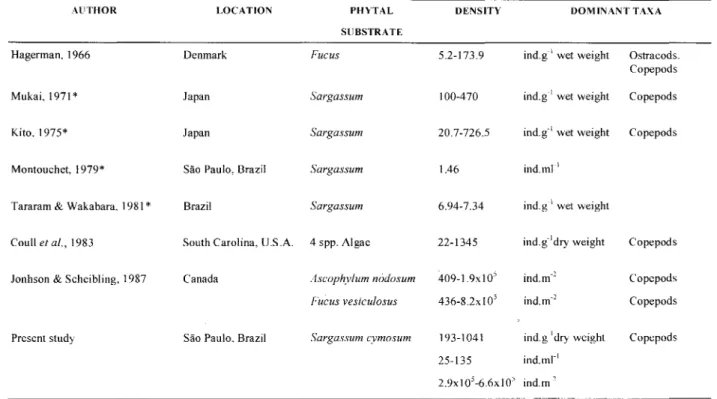
Table 6. Phytal meiofauna studies.
Hagerman. 1966
Mukai. 1971 *
Kito. 1975*
Montouchet. 1979*
Tararam & Wakabara. 1981 *
Coull et ai.. 1983
Jonhson & Scheibling. ] 987 Canada Ascophylum nódosum
Fucus vesiculosus
409-1.9xIO'
436-8.2x IO'
Present study São Paulo. Brazil Sargassum cymosum 193-1041
25-135
DOMINANT TAXA
2.9xI05-6.6xI05 ind.m"
* These studies included the macrofauna
Table modified ITom Hicks & Coull (1983) and Coull et aI. (1983)
Acari, Gastropoda and Gammaridea had the highest biomass in late spring and in summer
(December and January). The Gastropoda,
Gammaridea, Polychaeta, lsopoda and Bivalvia contributed with 52% of the biomass in December and 44% in January (summer). These groups constitute the temporary meiofauna, juveniles which move into macrofauna as they grow (Gibbons & Griffiths, 1986). The results do not agree with those found by Gibbons & Griffiths (1986), who reported a lower contribution of the same groups in the summer (6.7%) and winter (11%).
The density of the meiofauna showed an inverse relationship with the biomass and' algal volume and a positive relationship seems to be only true for the Acari, Gastropoda and Gammaridea. ln Japan the seasonal variations of the meiofauna were
affected by the biomass ofthe algaSargassum,a high
density of the meiofauna occurring in the winter and early autumn, coinciding with the growth of
Sargassumand consequent increase in algal biomass (Mukai, 1971). However, the populations of S.
cymosum of Ubatuba are perennial, with their
holdfasts and main stems persisting throughout the year. Their primary lateral branches are constantly in development, being continually renewed (Paula & Oliveira, 1980).
The biomass and volume of Sargassum
measured in this project include the epiphytic algae.
The presence of epiphytic algae promotes an increase in the complexity of the habitat. The quantity of epiphytes present generally introduces seasonal variation, and their high abundance in general corresponds to periods of low algal biomass (Jonhson & Scheibleing, 1987; Martin-Smith, 1993; Jarvis & Seed, 1996). ln Ubatuba, the presence of epiphytes in
Sargassum is common during the summer and in
early autumn, and is related to the larger number of mature branches of the algae (Eston, 1987). This suggests that epiphyte abundance and its seasonal
changes influence the meiofauna of S.cymosum.
Another hypothesis regarding the higher density of the meiofauna may be linked to the reproductive period of some species and is reflected in the higher density observed in the summer owing to the large number of organisms retained in the 60 /l-mmesh. Among these, the nauplii of Harpacticoida were the most abundant, indicating the predominance of young stages over the adult meiofauna. ln Hagerman's study (1966) the greatest microfauna
density associated with Fucus serratus was also
correlated with the reproductive period of many species in the summer.
The high density found in January and March (summer) may also be, in part, the result of climatological conditions generating high food availability. On the coast of São Paulo State the rainfall is more frequent during the summer (Pereira,
LOCA TlON PHYTAL DENSITY
SUBSTRATE
Denmark Fucus 5.2-173.9
Japan Sargassum 100-470
Japan Sargassum 20.7-726.5
São Paulo, Brazil Sargassum 1.46
Brazil Sargassum 6.94-7.34
South Carolina, V.S.A. 4 spp. AIgae 22-1345
ind.g" wet weight Ostracods.
Copepods
ind.g" wet weight Copepods
ind.g" wet weight Copepods
ind.mr'
ind.g"' wet weight
ind.g"dry weight Copepods
ind.m.2 Copepods
ind.m.2 Copepods
ind.g"'dry weight Copcpods
CURVELO & CORBISIER: Meiofauna associated whith Sargassum cymosum 129
1994), causing an increase in the input of fine material and organic matter ftom the forest adjacent to the rocky shore.
Acknowledgements
We thank Ora. Tagea K. S. Bjornberg, Or. Paulo 1. P. dos Santos and Ora. Lília P. Souza-Santos for their collaboration in this study. Coordenação de Aperfeiçoamento de Pessoal de Nível Superior (CAPES) provided schollarships to R. Curvelo. Two anonymous referees for their comments.
References
Boaden, P. 1. S. 1996. Habitat provision for
meiofauna by Fucus serratus epifauna with
particular data on the tlatworm Monocelis
lineata.Mar. Eco!', 17(1-3):67-75.
Clarke, K. R. & Green, R. H. 1988. Statistical design and analysis for a "biological effects" study. Mar. Eco!.-Prog. Ser., 46(1-3):213-226.
Corbisier, T. N. 1993. Meiofauna da plataforma continental interna do litoral norte de São Paulo
- verão/89. Publção esp. Inst. oceanogr., S
Paulo, (10):123-135.
Coull, B. C. 1977. Marine tlora and fauna of the
northeastern United States. Copepoda:
Harpacticoida. NOAA Technical Report. NHFS Circular, (399):1-48.
Eston, V. R. de. 1987. Avaliação experimenta] da
dominância ecológica em uma comunidade
de macroalgas do intralitoral rochoso
(Ubatuba, SP, Brasi]). Tese de doutorado.
Universidade de São Paulo, Instituto
Oceanográfico. 2v.
Field, J. G. 1.;Clarke, K. R. & Warwick, R. M. 1982. A practical strategy for analysing multispecies distribution patterns. Mar. Eco!. Prog. Ser., 8(1):37-52.
Gibbons, M. 1. & Griffiths, C. L. ]986. A
comparison of macrofaunai and meiofauna] distribution and standing stock across a rocky shore, with an estimate of their productivities. Mar. Bio!', 93(2):181-188.
Hagerman, L. 1966. The macro- and microfauna
associated with Fucus serratus L., with some
ecological remarks. Ophelia, 3:]-43.
Hicks, G. R. F. ]977. Observations on substrate preference of marine phytal harpacticoids (Copepoda). Hydrobio]ogia, 56(1):7-9.
Hicks, G. R. F. 1980. Structure of phyta] harpacticoid
copepod assemblages and the intluence of
habitat complexity and turbidity. 1. expl mar. Bio!. Eco!', 44(2-3): 157-192.
Hicks, G. R. F. 1985. Meiofauna associated with
rocky shore algae. In: Moore, P. G.Ik Seed, R.
The eco]ogy of rocky coasts. London, Hodder and Stoughton. p. 36-56.
Hicks, G. R. F. & Coull, B. C. 1983. The eco]ogy of marine meiobenthic Harpacticoid Copepods. Oceanogr. mar. Bio!' a. Rev., 21 :67-175.
Huys, R.; Gee, M. 1.; Moore, C. G. & Hamond, R.
1996. Marine and Brackish water
harpacticoid Copepods - Part 1.ln: Kermack,
D. M.; Barnes, R. S. K.; Crothers, 1. H., eds.
Synopses of the British fauna (new series).
353p.
Jarvis, S. C. & Seed, R. 1996. The meiofauna of
Ascophyllum nodosum (L.) Le Jolis:
characterization of the assemb]ages associated with two common epiphytes. 1. exp!. mar. Bio!' Eco!., 199(2):249-267.
Johnson, S. C. & Scheibling, R. E. 1987. Structure and dynamics of epifaunal assemblages on
intertida] macroa]gae Ascophyllum nodosum
and Fucus vesiculosus in Nova Scotia,
Canada. Mar. Eco!.-Prog. Ser., 37(2-3):209-227.
Kito, K. 1975. Pre]iminary report on the phytal
animais in the Sargassum confusum region in
Oshoro Bay, Hokkaido. J. Fac. Sci. Hokkaido Univ., Ser. VI, Zoo!., 20 (1):141-158.
Kito, K. 1982. Phytal marine nematode assemblage on Sargassum confusum Agardh with reference to the structure and seasona] tluctuations. 1. Fac. Sci. Hokkaido Univ., Ser. VI, Zoo!., 23(1):143-161.
Kruskal, 1. B. & Wish, M. 1978. Multidimensiona] sca]ing. Beverly Hills Sage Pub]ications. 93p.
Lang, K. 1948. Monographie der Harpacticiden. Lund, Hakan Ohlsson's Boktryckeri. 2v.
Lang, K. 1965a. Copepoda Harpacticoida aus dem
Küstengrundwasser dicht bei dem
130 Rev. bras. oceanogr.. 48(2). 2000
Lang, K. 1965b. Copepoda Harpacticoida trom the Californian Pacific coast. K. svenska vetensk. Akad. Handl.. 10(2): 1-566.
Martin-Smith, K. M. 1993. Abundance of mobile epifauna: the role of habitat comp1exity and predation by fishes. 1 exp1mar. Biol. Ecol., 174: 243-260.
Masunari, S. 1982. Organismos do fita1deAmphiroa
beauvoisii. Lamouroux, 1816 (Rhodophyta:
Corallinaceae). I. Autoecologia. Bolm lool.,
Univ. S Paulo, 7:57-148.
Masunari, S. 1983. The phytal of the algaAmphiroa
fragilissima (Linnaeus) Lamaroux, 1816. Stud.
Neotrop. Fauna Env., 18(3):151-161.
Montouchet, P. C. G. 1979. Sur Ia communauté des animaux vagi1es associés àSargassum cymosum C. Agradh à Ubatuba, État de São Paulo, Brésil. Stud. Neotrop. Fauna Env., 14(1):33-64.
Mukai, H. 1971. The phyta1 animaIs on the thalli of
Sargassum serratifolium in Sargassum sp.
region, with reference to their seasonal
tluctuations. Mar. Biol., 8: 170-182.
Muralikiishnamurty, P. V. 1983. Intertidal phytal fauna off Gangavaram, East Coast of India. Indian 1 mar. Sci., 12(2):85-89.
Paula, E. 1 1978. Taxonomia, aspectos biológicos e
ecológicos do gênero Sargassum (Phaeophyta,
Fucales) no litoral do Estado de São Paulo. Dissertação de mestrado. Universidade de São Paulo, Instituto de Biociências. 190 p.
Paula, E. J de & Oliveira F", E. C. de 1980. Aspectos
fenológicos de duas populações de Sargassum
cymosum(Phaeophyta-Fucales) do litoral de São
Paulo, Brasil. Bolm Bot., Univ. S Paulo, 8:21-39.
Pereira, C. S. 1994. Meteorologia. In: FUNDESPA
-Fundação de Estudos e Pesquisas Aquáticas. ed. Diagnóstico ambiental oceânico e costeiro das regiões sul e sudeste do Brasil. São Paulo, FUNDESPA,2:243-243.
Pfannkuche, O. & Thiel, H. 1988. Sample processing. In: Higgins, R. P. & Thiel, H. eds Introduction
to the study of meiofauna. Washington,
Smithsonian Institution Press. p. 134-135.
Preston, A. & Moore, P. G. 1988. The tlora and fauna
associated withCladophora albida(Huds) Kütz.
trom rockpools on great Cumbrae island, Scotland. Ophelia, 29(3): 169-186.
Tanaka, M. O. & Leite, F.P.P. 1998. The effect of sieve mesh size on the abundance and
composition of macrophyte-associated
macrofaunal assemblages. Hydrobiologia,
389(1-3):21-28.
Tararam, A. S. & Wakabara, Y. 1981. The mobile
fauna - especially Gammaridea of Sargassum
cymosum.Mar. Ecol.-Prog. Ser., 5(2):157-163.
Wells, 1 B. 1 1976. Keys to aid in the identification of marine Harpacticoid Copepods. University of Aberdeen, Department of loology. 215p.
lar, 1 H. 1996. Biostatistical analysis. 3rd. ed. Englewood Cliffs, N. 1, Prentice- Hall. 661p.