BRAZILIAN JOURNAL OF OCEANOGRAPHY, 55(2):121-131, 2007
SPATIAL AND TEMPORAL CHANGES IN INTERSTITIAL MEIOFAUNA ON A
SANDY OCEAN BEACH OF SOUTH AMERICA*
Elaine F. Albuquerque1**, Ana Paula Brandão Pinto1, Antonieta d’Alcântara de Queiroz Perez2
& Valéria Gomes Veloso2
1
Universidade Santa Úrsula
(Rua Fernando Ferrari, 75, Botafogo 22231-040 Rio de Janeiro, RJ, Brasil)
2
Universidade Federal do Estado do Rio de Janeiro (Avenida Pasteur, 458, Urca, Rio de Janeiro, RJ, Brasil)
A
B S T R A C TSpatial and temporal patterns of meiofauna community from a Brazilian sandy beach were investigated. The objective of this work was to analyze the meiofauna distribution using a statistical model that considers the biological data as variables, and granulometric characteristics, organic matter, and temperature as covariables.Four zones were sampled throughout one year in a Brazilian sandy beach and three sediment cores were taken monthly from each zone. The meiofauna was composed by 12 taxa, with tardigrades and nematodes comprising 92% of the total fauna. The meiofauna mean density varied from 1556.25 to 13125.25 ind.10 cm-2, with the highest densities in December. The results of multiple regression showed that the mean effects of zones, vertical layers, and months on the organisms were significantly correlated with the principal taxa of meiofauna. The retention zone and the 0-10 cm layer presented the highest densities. The temporal distribution showed different patterns and some taxa were more abundant in the dry season, and others in the rainy season. Sedimentological variables had strong and significant effects on the meiofauna taxa. According to the results, physical variables at the retention zone create optimal living conditions for the meiobentos, making this zone an area that favors the basic and applied ecological studies.
R
E S U M OOs padrões de distribuição espacial e temporal da meiofauna em uma praia arenosa do Brasil foram analisados usando um modelo estatístico que considerou os dados biológicos como variáveis e as características granulométricas, % de matéria orgânica, temperatura como covariáveis. Quatro zonas litorais foram amostradas durante o período de um ano e três cores de sedimento foram coletados em cada zona. A meiofauna foi composta de 12 taxa principais e os Tardigrada e Nematoda representaram 92% da fauna total. A densidade média da meiofauna variou de 1.556,25 a 13.125,25 ind.10cm-2, com as mais altas densidades em dezembro. Os resultados da regressão múltipla mostraram que os efeitos médios das zonas, estratos e meses nos organismos foram significativamente correlacionados com os principais grupos da meiofauna. A zona de retenção e o estrato de 0-10 cm apresentaram os mais altos valores de densidade. A distribuição temporal mostrou diferentes padrões, onde alguns taxa foram mais abundantes na estação seca e outros na estação úmida. As variáveis sedimentológicas tiveram um forte efeito significante sobre os grupos meiofaunísticos. As ótimas condições de vida da zona de retenção para o meiobentos fazem desta região uma área favorável para estudos de ecologia básica e aplicada.
Desxriptors:Meiofauna, Interstitial, Sandy beach, South America, Spatial distribution.
Descritores: Meiofauna, Intersticial, Praias arenosas, Distribuição espacial, América do Sul.
I
NTRODUCTIONSandy beaches are examples of simple ecosystems driven principally by the interacting physical forces of waves, tides and sediment movements (Gheskiere et al., 2005b). The meiofauna communities of sandy beaches are diverse and the different taxonomic groups have complex distribution patterns.
__________
(*) Paper presented at the 1st Brazilian Congress of Marine Biology, on 15-19 May, 2006. Rio de Janeiro, Brazil.
population variability in these ecosystems is by documenting responses to abiotic factors (Jaramillo & McLachlan, 1993; Brazeiro, 2001).
The meiofauna is horizontally and vertically variable and the median grain size and the degree of sorting of the sand grains determine the available space for the interstitial meiofauna (Coull & Bell, 1979).
The vertical distribution shows seasonal fluctuations marked by the instability of the physical and chemical conditions, accentuated by the rhythms of immersion and emersion (Coull & Bell, 1979) and it is determined by the degree of drainage and sediment oxygenation. Vertical movements of meiofauna have also been correlated with disturbances by waves and rain (Brown & McLachlan, 1990).
In the intertidal zone of sandy beaches, temperature and salinity are highly variable and can also influence the distribution and faunal composition (Olafsson, 1991).
The faunal distribution varies according to the season of the year (Hicks & Coull, 1983) and animals can also make daily or tidal migrations (Joint et al., 1982).
Generally it is very difficult to separate temporal from spatial variability (Fleeger & Decho, 1987). In this context, analyses should include models which take into consideration the factors which influence distribution, evaluating the partial contribution of each one.
There are many studies on the ecology of interstitial meiofauna in the world (Dye et al., 1981; Harkantra & Parulekar, 1989; Olafsson, 1991; Armonies & Reid, 2000; Rodriguez et al., 2001; 2003; Menn et al., 2002, Gheskiere et al., 2004; 2005 a; b; Moreno et al., 2005; 2006). In Brazil, the interest in sandy-beach meiofauna has been intensified in recent decades (Medeiros, 1984; 1992; Silva et al., 1991; 1997; Bezerra et al., 1996; 1997; Corbisier et al., 1997; Esteves et al., 1997; 1998; Esteves & Fonseca-Genevois, 1997; Wandeness et al., 1997; Esteves & Silva, 1998; Albuquerque & Genofre, 1997; Netto et al., 1999).
The objectives of this study were: (1) to verify the spatial and temporal variations in the abundance of the meiofauna community in an exposed sandy beach on the southeast coast of Rio de Janeiro, Brazil; (2) to determine the role of the environmental variables in explaining the observed patterns.
Study Area
The Marambaia Restinga (Fig. 1) is situated on the southeast coast of Rio de Janeiro, Brazil at 23003'S and 043034'W. It is formed by a sandbar about 40 km long and up to 5 km wide. The beach is long and morphodynamically intermediate (Veloso et al., 2003). This area, controlled by the Brazilian Armed Forces, is not subject to urban or industrial occupation and has undergone little anthropogenic impact (Costa, 1998).
M
ATERIAL ANDM
ETHODSSamplings were carried out from July 1998 to June 1999 in four zones: the saturation zone (level 0), resurgence zone (level 4), retention zone (level 7), and dry-sand zone (level 9) (Salvat, 1964). At each level three replicate samples were collected using plexiglass corers (inner diameter =3, 5 cm) and each core sample was divided into three layers: 0-10cm (layer A), 10-20 cm (layer B), and 20-30 cm (layer C). The sediment was preserved with 4% formaldehyde and stained with Rose Bengal.
In the laboratory, the meiofauna was extracted from the sediment by elutriation. The animals retained on a 45µm sieve were sorted and counted to major taxa using a stereomicroscope and the density was expressed as abundance in 10 cm2.
Two additional samples were taken for analysis of organic matter and granulometry. Granulometric analysis was done according to Suguio (1973). The sediment organic matter content was measured by incineration at 450ºC in a muffle. Temperature and redox potential of the sediment were measured with electrodes inserted into each sediment layer.
A regression model was employed including the effects of month, zone, and stratum about the meiofauna density and as covariables, the granulometric variables, organic matter and sediment temperature. The density data transformed in log (x+1) were used as the response variables in Gaussian regression models. For all responses, the models fit quite well, the R1 2 varying from 0.8057 for Copepoda to 0.9317 for total meiofauna. Simulated envelopes for residuals showed the points well inside the confidence band indicating the appropriateness of the Gaussian assumption.
The mean effects were used to analyze the spatial and temporal distributions of the principal taxonomic groups.
Because months, depths and zones were considered as factors, and both month/depth and month/zone interactions were significant for all responses, the mean effects and the difference between the mean effects must be interpreted with care. The simultaneous confidence intervals for the difference between mean effects were constructed by the Sheffe method. The ANOVA tables were constructed by adding the effects sequentially.
R
ESULTSSediment temperature varied from 21.6 (in July) to 34.5ºC (in December). The granulometric results showed a high percentage of fine sand in almost all samples, and the mean grain diameter varied
from 2.51 to 1.63 mm. The sediment was well to moderately sorted. The organic matter of sediment varied from 0.01% (December) to 0.39% (September). The largest precipitation indexes occurred between September and March.
Twelve meiofauna taxa were found and tardigrades (71.35%), nematodes (20.65%), copepodes (4.5%), turbellarians (2.30%) and oligochaetes (0.29%) were the most frequent and abundant (Fig. 2). Oligochaetes, polychaetes, halacarines, collembolans, ostracods, gastrotrichs, isopods, and cnidarians were present in low densities and occurrence frequency.
20,65% 4,50%
2,30%
0,29% 4,88%
71,35%
Turbellaria Nematoda Tardigrada
Copepoda Oligochaeta Others
Fig. 2. Relative abundance (%) of meiofauna taxa during the sampling period.
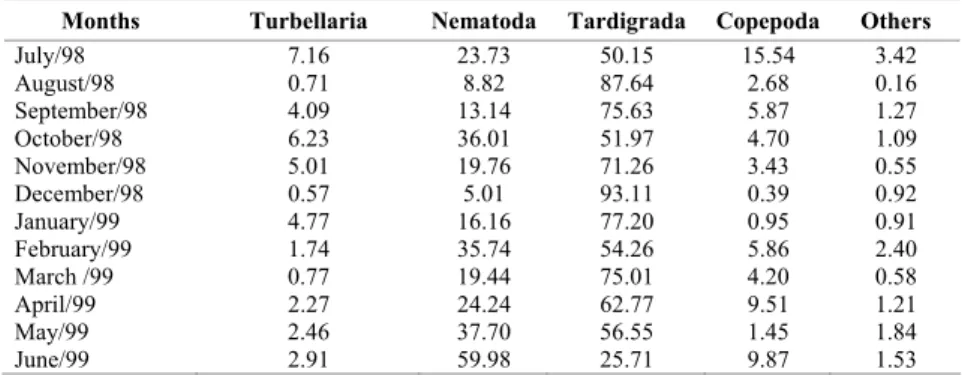
Tardigrades were the most abundant group throughout the year, except in June when nematodes were present with highest density (Table 1).
The mean density of meiofauna ranged from 1556.25 ind.10 cm-2 to 13125.25 ind.10 cm-2. The maximum density occurred in December and the minimum in October.
The effect of different zones was strongly and significantly correlated with the density of total meiofauna, tardigrades, nematodes, copepods, and turbellarians (Table 2).
The retention zone (level 7) contained the highest densities of total meiofauna and tardigrades in most months (Figs 3A, B). The highest densities of nematodes (Fig. 3C) occurred over most months in both the dry-sand zone and the retention zone. Copepods showed higher densities in the saturation zone in most months (Fig. 3D). Turbellarians (Fig. 3E) were more abundant in the retention zone during the dry season (except August), whereas in the rainy season, they were more abundant in the resurgence zone (level 4). The saturation zone (level 0) contained the lower densities of tardigrades (Fig. 3B) and nematodes densities (Fig. 3C), whereas turbellarians (Fig. 3E) and copepods (Fig. 3D) had lower densities in the dry-sand zone. Oligochaetes were more abundant in December in the saturation zone, but in February, March, and June their abundance was higher in the retention zone (Fig. 3F).
Table 1. Relative abundance (%) of the meiofauna taxa of Marambaia Restinga during the sampling period.
Months Turbellaria Nematoda Tardigrada Copepoda Others
July/98 7.16 23.73 50.15 15.54 3.42
August/98 0.71 8.82 87.64 2.68 0.16
September/98 4.09 13.14 75.63 5.87 1.27
October/98 6.23 36.01 51.97 4.70 1.09
November/98 5.01 19.76 71.26 3.43 0.55
December/98 0.57 5.01 93.11 0.39 0.92
January/99 4.77 16.16 77.20 0.95 0.91
February/99 1.74 35.74 54.26 5.86 2.40
March /99 0.77 19.44 75.01 4.20 0.58
April/99 2.27 24.24 62.77 9.51 1.21
May/99 2.46 37.70 56.55 1.45 1.84
June/99 2.91 59.98 25.71 9.87 1.53
Table 2. Analysis of Variance of biotic and abiotic variables of Marambaia Restinga. ns= not significant; *= significant; **= very significant; ***= highly significant; MS=mean square
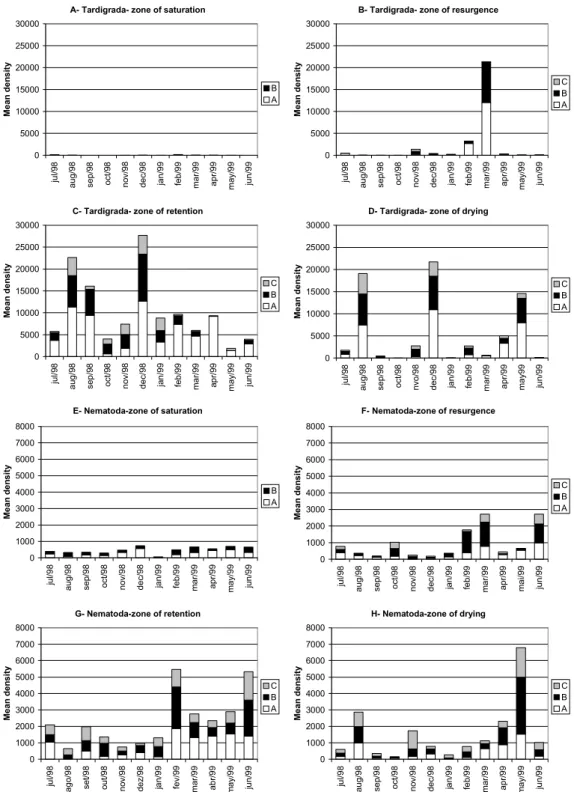
The mean effects of the profundity on the organisms were highly significant for total meiofauna, tardigrades, copepods, turbellarians, and oligochaetes but only significant for nematods because their their
distribution in the strata varied among the months (Figs 4E, F, G, H (Table 2). Tardigrades were most abundant in layer A, in almost all the zones (Figs 4B, C; D).(Table 2).
Source MS F p MS F P MS F p
Months 10.9865 64.38 *** 47.7488 69.90 *** 11.3438 73.46 ***
Profundity 18.2621 107.01 *** 92.0508 134.76 *** 0.5834 3.77 *
Zones 83.8058 491.08 *** 453.7306 664.28 *** 29.6706 192.16 ***
Silt 2.8983 16.98 *** _ _ ns 2.4910 16.13 ***
Organic matter 0.6698 3.92 * _ _ ns 5.1644 33.44 ***
coarse sand _ _ ns 17.6900 25.89 *** _ _ ns
sorting _ _ ns 7.0308 10.29 ** 4.0062 25.94 ***
Xmdf _ _ ns _ _ ns 6.2811 40.67 ***
Temperature _ _ ns _ _ ns 1.4143 9.16 **
Months X profundity 2.0636 12.09 *** 4.7410 6.94 *** 1.2298 7.96 ***
Months X Zones 8.6337 50.59 *** 21.8056 31.92 *** 4.6552 30.14 ***
fine sand _ _ ns ns ns ns 1.8472 11.96 ***
Residual 0.17065 0.6830 0.15441
Source MS F p MS F p MS F p
Months 21.8492 18.97 *** 5.7502 10.12 *** 22.1174 33.61 ***
Profundity 66.3125 57.58 *** 5.2100 0.17 *** 4.7549 7.22 ***
Zones 245.0802 212.83 *** 155.1156 272.69 *** 2.5178 3.82 *
Silt _ _ ns _ _ ns _ _ ns
Organic matter 2.1051 1.82 ns _ _ ns 7.5940 11.54 ***
coarse sand 3.8331 3.32 ns. _ _ ns _ _ ns
sorting _ _ ns _ _ ns 12.8296 19.49 ***
Xmdf _ _ ns 11.0206 19.37 *** _ _ ns
Temperature 10.9345 9.49 * _ _ ns _ _ ns
Months X profundity 4.4575 3.87 *** 1.0494 1.8449 ** 2.8977 1.10 ***
Months X Zones 8.9557 7.77 *** 6.0288 10.59 *** 9.4008 14.28 ***
fine sand _ _ ns 8.6003 15.11 *** 7.7943 11.84 ***
Residual 1.1515 0.5688 0.6580
Copepoda Turbellaria Oligochaeta
A- Total meiofauna 0 10000 20000 30000 40000 50000 60000 ju l/ 9 8 a u g /9 8 se p /9 8 o ct /9 8 n o v/ 9 8 d e c/ 9 8 ja n /9 9 fe b /9 9 ma r/ 9 9 a p r/ 9 9 ma y/ 9 9 ju in /9 9 M e a n d e n s ity 9 7 4 0
B- Tardigrada
0 10000 20000 30000 40000 50000 60000 ju l/ 9 8 a u g /9 8 se p /9 8 o ct /9 8 n o v/ 9 8 d e c/ 9 8 ja n /9 9 fe b /9 9 ma r/ 9 9 a p r/ 9 9 ma y/ 9 9 ju n /9 9 M e a n d e n s ity 9 7 4 0 C-Nematoda 0 2000 4000 6000 8000 10000 12000 ju l/ 9 8 a u g /9 8 se p /9 8 o ct /9 8 n o v /9 8 d e c /9 8 ja n /9 9 fe b /9 9 ma r/ 9 9 a p r/ 9 9 ma y/ 9 9 ju n /9 9 M e a n d e n s ity 9 7 4 0 D-Copepoda 0 500 1000 1500 2000 2500 3000 ju l/ 9 8 a u g /9 8 s e p /9 8 o ct /9 8 n o v /9 8 d e c /9 8 ja n /9 9 fe b /9 9 ma r/ 9 9 a p r/ 9 9 ma y/ 9 9 ju n /9 9 M e a n d e n s ity 9 7 4 0 E-Turbellaria 0 200 400 600 800 1000 1200 1400 ju l/ 9 8 a u g /9 8 s e p /9 8 o ct /9 8 n o v/ 9 8 d e c /9 8 ja n /9 9 fe b /9 9 ma r/ 9 9 a p r/ 9 9 ma y/ 9 9 ju n /9 9 M e a n d e n s ity 9 7 4 0 F- Oligochaeta 0 50 100 150 200 250 ju l/ 9 8 a u g /9 8 se p /9 8 o c t/ 9 8 n o v/ 9 8 d e c /9 8 ja n /9 9 fe b /9 9 ma r/ 9 9 a p r/ 9 9 ma y/ 9 9 ju n /9 9 M e a n d e n s ity 9 7 4 0
Fig.3. Horizontal distribution of different taxonomic groups of meiofauna during the sampling period.9= dry sand zone; 7- retention zone; 4= resurgence zone; 0= saturation zone.
Copepods reached higher densities in layer A in the saturation and resurgence zones (Figs 5 A, B), except in February and March, when they were most abundant in layer B (Fig. 5A). However, in the retention zone they were more abundant in the lower layer (C), except in July and April (Fig. 5C). Turbellarians were distributed in layers A and B in most months and zones (Figs 5E, F, G, H).
The statistical analysis showed that the mean effects of months on the density of organisms were highly significant for total meiofauna and for all the
taxonomic groups. The total meiofauna presented abundance peaks in August and December, coinciding with the high densities of tardigrades and the nematodes were more abundant from February to June (Fig. 6A). Turbellarians had highest densities in July, September, November and May, and lowest densities in August, October, December and March. Copepods were more abundant in July, August, September, February, March, April, and June. Oligochaetes were more abundant in December, February, March and April (Fig. 6B).
A- Tardigrada- zone of saturation 0 5000 10000 15000 20000 25000 30000 ju l/ 9 8 a u g /9 8 se p /9 8 o ct /9 8 n o v/ 9 8 d e c /9 8 ja n /9 9 fe b /9 9 ma r/ 9 9 a p r/ 9 9 ma y/ 9 9 ju n /9 9 Me a n d e n s it y B A
B- Tardigrada- zone of resurgence
0 5000 10000 15000 20000 25000 30000 ju l/ 9 8 a u g /9 8 se p /9 8 o ct /9 8 n o v/ 9 8 d e c /9 8 ja n /9 9 fe b /9 9 ma r/ 9 9 a p r/ 9 9 ma y/ 9 9 ju n /9 9 Me a n d e n s it y C B A
C- Tardigrada- zone of retention
0 5000 10000 15000 20000 25000 30000 ju l/ 9 8 a u g /9 8 se p /9 8 o ct /9 8 n o v /9 8 d e c/ 9 8 ja n /9 9 fe b /9 9 ma r/ 9 9 a p r/ 9 9 ma y /9 9 ju n /9 9 Me a n d e n s it y C B A
D- Tardigrada- zone of drying
0 5000 10000 15000 20000 25000 30000 ju l/ 9 8 a u g /9 8 s e p /9 8 o ct /9 8 n v o /9 8 d e c/ 9 8 ja n /9 9 fe b /9 9 ma r/ 9 9 a p r/ 9 9 ma y9 9 ju n /9 9 Me a n d e n s it y C B A
E- Nematoda-zone of saturation
0 1000 2000 3000 4000 5000 6000 7000 8000 ju l/ 9 8 a u g /9 8 se p /9 8 o c t/ 9 8 n o v /9 8 d e c/ 9 8 ja n /9 9 fe b /9 9 ma r/ 9 9 a p r/ 9 9 ma y /9 9 ju n /9 9 Me a n d e n s it y B A
F- Nematoda-zone of resurgence
0 1000 2000 3000 4000 5000 6000 7000 8000 ju l/ 9 8 a u g /9 8 se p /9 8 o c t/ 9 8 n o v /9 8 d e c/ 9 8 ja n /9 9 fe b /9 9 ma r/ 9 9 a p r/ 9 9 ma i/ 9 9 ju n /9 9 M e a n d e n s ity C B A
G- Nematoda-zone of retention
0 1000 2000 3000 4000 5000 6000 7000 8000 ju l/ 9 8 a g o /9 8 se t/ 9 8 o u t/ 9 8 n o v/ 9 8 d e z/ 9 8 ja n /9 9 fe v/ 9 9 ma r/ 9 9 a b r/ 9 9 ma y /9 9 ju n /9 9 M e a n d e n s ity C B A
H- Nematoda-zone of drying
0 1000 2000 3000 4000 5000 6000 7000 8000 ju l/ 9 8 a u g /9 8 se p /9 8 o ct /9 8 n o v/ 9 8 d e c/ 9 8 ja n /9 9 fe b /9 9 ma r/ 9 9 a p r/ 9 9 ma y /9 9 ju n /9 9 M e a n d e n s ity C B A
Fig. 4. Vertical distribution of Tardigrada and Nematoda during the sampling period.
A-Copepoda - zone of saturation 0 200 400 600 800 1000 1200 1400 1600 1800 2000 ju l/ 9 8 a u g /9 8 se p /9 8 o c t/ 9 8 n o v /9 8 d e c /9 8 ja n /9 9 fe b /9 9 ma r/ 9 9 a b r/ 9 9 ma y /9 9 ju n /9 9 Me a n d e n s it y B A
B-Copepoda - zone of resurgence
0 200 400 600 800 1000 1200 1400 1600 1800 2000 ju l/ 9 8 a u g /9 8 se p /9 8 o c t/ n o v/ 9 8 d e c /9 8 ja n /9 9 fe b /9 9 ma r/ 9 9 a p r/ 9 9 ma y /9 9 ju n /9 9 Me a n d e n s it y C B A
C-Copepoda - zone of retention
0 200 400 600 800 1000 1200 1400 1600 1800 2000 ju l/ 9 8 a u g /9 8 s e p /9 8 o c t/ 9 8 n o v/ 9 8 d e c /9 8 ja n /9 9 fe b /9 9 ma r/ 9 9 a p r/ 9 9 ma y9 9 ju n /9 9 M e a n d e n s it y C B A
D-Copepoda - zone of drying
0 200 400 600 800 1000 1200 1400 1600 1800 2000 ju l/ 9 8 a g o /9 8 se t/ 9 8 o u t/ 9 8 n o v /9 8 d e z/ 9 8 ja n /9 9 fe v /9 9 ma r/ 9 9 a b r/ 9 9 ma i/ 9 9 ju n /9 9 M e a n d e n s it y C B A
E-Turbellaria- zone of saturation
0 100 200 300 400 500 600 700 800 900 1000 ju l/ 9 8 a u g /9 8 s e p /9 8 o c t/ 9 8 n o v/ 9 8 d e c/ 9 8 ja n /9 9 fe b /9 9 ma r/ 9 9 a p r/ 9 9 ma y /9 9 ju n /9 9 Me a n d e n s it y B A
F-Turbellaria- zone of resurgence
0 100 200 300 400 500 600 700 800 900 1000 ju l/ 9 8 a u g /9 8 se p /9 8 o c t/ 9 8 n o v/ 9 8 d e c /9 8 ja n /9 9 fe b /9 9 ma r/ 9 9 a p r/ 9 9 ma y /9 9 ju n /9 9 Me a n d e n s it y C B A
G-Turbellaria- zone of retention
0 100 200 300 400 500 600 700 800 900 1000 ju l/ 9 8 a u g /9 8 se p /9 8 o c t/ 9 8 n o v /9 8 d e c /9 8 ja n /9 9 fe b /9 9 ma r/ 9 9 a p r/ 9 9 ma y/ 9 9 ju n /9 9 M e a n d e n s it y C B A
H-Turbellaria- zone of drying
0 100 200 300 400 500 600 700 800 900 1000 ju l/ 9 8 a u g /9 8 se p /9 8 o c t/ 9 8 n o v /9 8 d e c /9 8 ja n /9 9 fe b /9 9 ma r/ 9 9 a p r/ 9 9 ma y/ 9 9 ju n /9 9 M e a n d e n s it y C B A
Fig. 5.Vertical distribution of Copepoda and Turbellaria during the sampling period. A=0-10 cm; B=10-20 cm; C=20-30 cm.
A
0 10000 20000 30000 40000 50000 60000
ju
l/
9
8
a
u
g
/9
8
se
p
/9
8
o
ct
/9
8
n
o
v/
9
8
d
e
c/
9
8
ja
n
/9
9
fe
b
/9
9
ma
r/
9
9
a
p
r/
9
9
ma
y/
9
9
ju
n
/9
9
Me
a
n
d
e
n
s
it
y
Nematoda Tardigrada total meiofauna
B
0 500 1000 1500 2000 2500 3000
ju
l/
9
8
a
u
g
/1
9
9
8
se
p
/1
9
9
8
o
c
t/
1
9
9
8
n
o
v
/9
8
d
e
c/
1
9
9
8
ja
n
/9
9
fe
b
/1
9
9
9
ma
r/
9
9
a
p
r/
1
9
9
9
ma
y
/1
9
9
9
ju
n
/9
9
Me
a
n
d
e
n
s
it
y
Turbellaria Oligochaeta Copepoda
Fig. 6. Temporal distribution of different groups of meiofauna on Marambaia Restinga
Besides the highly significant effects of zones, layers and months on the density of interstitial meiofauna taxa, the interactions between months and zones and months and layers were also highly significant. The variance analysis (Table 2) showed that fine sand had a highly significant effect on nematodes, turbellarians and oligochaetes, whereas coarse sand had a significant effect only on the density of tardigrades. Temperature was significant only for copepod and nematode density, while organic matter had a significant effect on nematode and oligochaete densities. Finally, the degree of grain sorting was significant for tardigrades, nematodes and oligochaetes.
Because the statistical analysis used the mean effects among the zones, layers and months, the results should be interpreted with caution, because the effects on density between Month X Layer and Month X
Zone were highly significant for the total meiofauna and for the majority of taxonomic groups.
D
ISCUSSIONA biological or physical factor, by itself, does not explain the distribution of a given taxonomic group, because the sediment-water interface is a highly dynamic atmosphere that undergoes constant chemical, physical, and biological processes, affecting the meiobenthic communities (Snelgrove & Butman, 1994; Giere, 1993).
The simple determination of mean grain diameter does not adequately indicate the complexity of the habitat. The available interstitial space is the most important factor and many studies have used the degree of grain sorting to indicate the interstitial space (Jansson, 1966). The Marambaia Restinga has fine, moderately sorted sand, which probably favors the meiofauna abundance and richness.
Large-scale heterogeneity is a factor of changes in physical factors, especially associated with the sediments (Findlay, 1981). Sedimentological variables have significant effects on the distribution of different taxa, because the size and the degree of sorting of the sand determine the space available for the interstitial meiofauna (Coull & Bell, 1979). The granulometric variables were the most significant factor for the horizontal distribution of principal taxonomic groups in the Marambaia Restinga and had strong and significant effects on the meiofauna distribution.
The total organic matter concentrations, by ignition loss, do not indicate the real fraction available to consumers (Fabiano et al., 1995). It is possible that temporary changes in meiofauna density are dependent on changes in the concentration of plant detritus and other organic compounds (Danovaro, 1996). In this work the organic matter had significant effect only on the nematodes and oligochaetes densities.
The statistical model showed that in the Marambaia Restinga, there were significant differences in meiofauna density among the coastal zones, months, and layers. Bezerra et al. (1996) did not find significant differences in the meiofauna density among coastal zones, but they found differences among months, layers, and transects. Bezerra et al. (1996) found higher meiofauna densities in the dry-sand zone, but in the present study, the retention zone presented the highest densities. This zone may provide the best conditions for interstitial life, because it has good water circulation, high dissolved oxygen content, abundant food, and physical stability (McLachlan, 1983; Brown & McLachlan, 1990). In the Marambaia Restinga, tardigrades were distinctly more abundant in the retention and dry-sand zones, and Medeiros (1992) observed the same distribution on Anchieta Island. These animals usually occur far from the waterline (De Zio & Grimaldi, 1966) and their preference for dry sands can be explained, according to these authors, because these animals resist well to the lack of water, reducing their
metabolism and surviving in high temperatures (Margulis & Schartz, 2001). The oligochaetes were found in the three zones but they were more abundant in the dry-sand zone in several months. The dominance of oligochaetes in the driest layers reveals their terrestrial origin (Jansson, 1968). To the opposite, harpacticoid copepods are very sensitive to the decrease in interstitial water (Moore, 1979) and their high abundance in the saturation zone of the Marambaia Restinga is probably related to this.
The physical variables are also the ultimate factors controlling vertical distribution of meiofauna in macrotidal beaches (McLachlan, 1978). Meiofauna is known to respond to these important factors, for example, by migrating down into deeper layer away from desiccated areas (Jansson, 1968). Vertical migration of meiofauna has been reported in several works, mainly in temperate areas, where some groups such as turbellarians, copepods, nematodes, gastrotrichs, and tardigrades migrate to the deepest layers in winter. Great reductions of meiofauna abundance have also been recorded during periods with reduced salinity, after heavy rain (Govindankutty & Nair, 1966). Similar vertical movements were noticed in relation to rainfall and wave disturbance by Boaden (1968). In tropical beaches, although the seasons are not very marked, these same factors are related to periods of "good weather” and “storms” influencing the vertical migration (Silva et al., 1991). In the Marambaia Restinga, the meiofauna taxa presented different vertical distributions during the sampling period, but the highest densities were almost always found in the uppermost layer. However, tardigrades, nematodes and turbellarians were more abundant in layers B and C in October and November, probably because of the strong rains that occurred in these months.
Vertical distribution is a very important factor in designing a sampling plan. The determination of the depth, without previous sampling, can lead to errors on the estimating of meiofauna density. The temporal variability of vertical distribution in the taxonomic groups should also be observed before a sampling depth is selected for the study period.
Temporal distribution of meiofauna taxa showed different patterns but the highest densities of total meiofauna were found in a rainy season when temperatures are usually higher. The sediment temperature affected significantly the nematodes and copepods distribution in the Marambaia Restinga and according to Harris (1972) temperature can also affect indirectly the population increase, by controlling growth of bacteria and the number of diatoms. In tropical areas, the seasonal changes are less defined, but most meiofauna organisms show some seasonality, with greater abundance in the warmest months (Coull,
1988). In the Marambaia Restinga, tardigrades, nematodes, and oligochaetes, showed higher densities in the rainy season. Wandeness et al. (1997) also observed that tardigrades were more abundant in the rainy months.
The ecological studies of meiofauna are important for the understanding of trophodynamic processes of a sandy beach. Furthermore, the assessment of ecological role and the spatial and temporal changes of meiobenthos can be used in environmental monitoring programs whose main goal is often to identify patterns in community structure and to relate them to measured environmental variables including pollutants (Moreno et al., 2006).
According to the results obtained, physical variables at the retention zone create optimal living conditions for the meiobenthos, making this zone an area that favors basic and applied ecological studies.
A
CKNOWLEDGEMENTSThis work had the support and financial assistance of Santa Úrsula University (USU), Rio de Janeiro University (UNIRIO), and the Foundation for Support of Research of Rio de Janeiro State (FAPERJ). We are grateful to Dr. Ricardo Pollery for helping with the sedimentological analysis.
R
EFERENCESAlbuquerque, E. F. & Genofre, G. C. 1999. Flutuação da população de Microcerberus ramosae (Crustacea-Isopoda) da fauna intersticial da Praia Vermelha, Rio de Janeiro, Brasil. In: Silva S. H. G. & Lavrado H. P. edS. Oecologia Brasiliensis VII: Ecologia dos ambientes costeiros do Estado do Rio de Janeiro. Rio de Janeiro: UFRJ. p.229-243.
Armonies, W. & Reise, K. 2000. Faunal diversity across a sandy shore. Mar. Ecol.- Prog Ser., 196:49-57.
Bezerra, T. N. C.; Fonsêca-Genevois, V. & Genevois B. 1996. Distribuição horizontal e vertical da meiofauna em uma região tropical intermareal (Istmo de Olinda-Pernambuco-Brasil) Trabhs Oceanogr., Univ. Fed. Pernambuco, 24: 249-264.
Bezerra, T. N. C.; Fonsêca-Genevois, V. & Genevois, B. 1997. Influência da granulometria na distribuição e adaptação da meiofauna na praia arenosa do Istmo de Olinda-PE. In: Absalão, R. S. & Esteves, A. M. eds. Oecologia Brasiliensis III: Ecologia de Praias Arenosas do Litoral Brasileiro. Rio de Janeiro: UFRJ. p.107-116. Boaden, P. J. S. 1968. Water movement-a dominant factor in
interstitial ecology. Sarsia, 34:125-136.
Brazeiro, A. 2001. Relationship between species richness and morphodynmics in sandy beaches: what are the underlying factors? Mar. Ecol.Prog.- Ser, 224:35-44. Brown, A. C. & McLachlan, A. 1990. Ecology of Sandy
Shores. Amsterdam: Elsevier, 328 p.
Corbisier, T. N.; Sousa, C. P. M. & Eicher, B. B. 1997. Distribuição espacial do meiobentos e do
microfitobentos na Enseada do Flamengo, Ubatuba, São Paulo. Revta. bras. Biol., 57(1):109-119.
Costa, H. 1998. Uma avaliação da qualidade das águas costeiras do Estado do Rio de Janeiro. Rio de Janeiro: FEMAR. 261 p.
Coull, B. C. 1988. Ecology of the marine meiofauna. In: Higgins, R. P & Thiel, H.(ed.) Introduction to the study of Meiofauna. Washington, D.C.:Smithsonian Institution Press. p.18-38.
Coull, B .C. & Bell, S. S. 1979. Perspectives of marine meiofaunal ecology. In: Livingston, R. J.(ed..)Ecological processes in coastal and marine systems. New York, p.189-216.
Covazzi, A.; Pusceddu, A.; Della Croce, N. & Danovaro, R. 2001. Spatial and temporal changes in beach meiofaunal communities of the Ligurian Sea (NW Mediterranean). Rev. Biol. mar. Ocean., 35(1):57-64.
Danovaro, R. 1996. Detritus-bacteria-meiofauna interactions in a seagrass bed (Posidonia oceanica) of the NW Mediterranean. Mar. Biol., 127: 1-13.
De Zio, S. & Grimaldi, P. 1966. Ecological aspects of Tardigrada distribution in South Adriatic beaches. Veröff. Inst Meeresforsch. Bremerhav., 2: 87-94. Dye,H.; McLachlan, A. & Wooldridge, T. 1981. The ecology
of sandy beaches in Natal, South África. S. Afr. J. Zool, 16:200-209.
Esteves, A. M.; Absalão, R. & Silva, V. M. A. P. 1997. The importance of cost-effectiveness sampling in the study of intertidal sandy beach meiofauna. Trop. Ecol., 38(1): 47-53.
Esteves, A. M; Bloise, C. & Nogueira, C. S. R. 1998. Variação espaço-temporal da meiofauna ao longo de um período quinzenal, em um ponto fixo da Praia Vermelha, Rio de Janeiro. In: Simpósio de Ecossistemas Brasileiros, 4. Anais. p. 179-193.
Esteves, A. M. & Fonsêca-Genevois, V. 1997. Microdistribuição da meiofauna na Coroa do Avião, Pernambuco-Brasil, com referência especial à utilização da análise de autocorrelação espacial. Arq. Biol. Tecn., 40(1): 89-95.
Esteves, A. M. & Silva, V. M. A. P. 1998. The behavior of sugar flotation technique in meiofauna extraction from different sand types. Trop. Ecol., 39(2):283-284. Fabiano, M.; Danovaro, R. & Faschetti, S. 1995. A three-year
time series of elemental and biochemical composition of organic matter in subtidal sandy sediments of the Ligurian Sea (WW Mediterranean) Continent. Shelf Res., 15:1453-1469.
Findlay, S. E. G. 1981. Small-scale distribution of meiofauna on a mud-and sand flat. Estuar. coast. Shelf Sci., 12:471-484.
Fleeger, J. W. & Decho, A. W. 1987. Spatial variability of interstitial meiofauna: a review. Stygologia, 3(1):35-54. Geskiere, T.; Hoste, E.; Vanaverbeke, J.; Vincx, M. &
Degraer, S. 2004. Horizontal zonation patterns and feeding structure of marine nematode assemblages on a macrotidal, ultra-dissipative sandy beach (De Panne, Belgium). J. Sea Res., 52: 211-226.
Geskiere, T.; Vincx, M.; Weslawski, J. M.; Scapini, F. & Degraer, S. 2005b. Meiofauna as descriptor of tourism-induced changes at sandy beaches. Mar. Environ. Res., 60:245-265.
Giere O. 1993.Meiobenthology. The microscopic fauna in Aquatic sediments. Berlin: Springer Verlag, Germany. 328p.
Govindankutty, A. G. & Balakrisnan Nair, N. 1966. Preliminary observations on the interstitial fauna of the South-West coast of India. Hydrobiologia, 28:101-122. Harkantra, S. N. & Parulekar, A. H. 1989. Population
distribution of meiofauna in relation to some environmental features in a sandy intertidal region of Goa, West coast of India. Indian J. Mar. Sci., 18: 259-264.
Harris, R. P. 1972. The distribution and ecology of the interstitial meiofauna of a sandy beach at Whitsand Bay, East Cornwall. J. mar Biol. Ass. U. K., 52: 1-18. Hicks, G. R. F. & Coull, B. C. 1983. The ecology of marine
meiobenthic harpaticoid copepods. Oceanogr. mar. Biol. a. Rev., 23:399-489.
Jansson, B. O. 1966. Microdistribution of factors and fauna in marine sandy beaches. Veröff Inst. Meeresforsch. Bremerhav., 2:77-86
Jansson, B. O. 1968. Quantitative and experimental studies of the interstitial fauna in four Swedish sandy beaches. Ophelia. 5: 1-71.
Jaramillo, E & McLachlan, A. 1993. Community and population response of the macroinfauna to physical factors over a reange of exposed sandy beaches in South-Central Chile. Estuar. coast. Shelf Sci., 37:615-624. Joint, I. R.; Gee, J. M. & Warwick, R. M. 1982.
Determination of fine-scale vertical distribution of microbes and meiofauna in an intertidal sediment. Mar. Biol., 72:157-164.
Margulis, L. & Schartz, K.V. 2001. Cinco Reinos: um guia ilustrado dos filos da vida na Terra. 3.ed. Rio de Janeiro:Guanabara Koogan. 497p.
McLachlan, A. 1978.Sediment particle size and body size in meiofaunal harpacticoid copepods. S. Afr. J. Sci., 74: 27-28.
McLachlan, A. 1983. Sandy beach ecology- a review. In: McLachlan A, Erasmus T,(eds). Sandy beaches as Ecosystems. The Hague: W. Junk Publishers,. .p.321-381.
McLachlan, A.; Jaramilo, E.; Donn, T. E. & Wessels, F. 1993. Sandy beach macrofauna communities and their control by the physical environment a geographical comparison. J. coast. Res., 15:27-38.
Medeiros, L. R. A. 1984. Meiofauna da região entre marés do litoral norte do Estado de São Paulo. Ciencia Cult., S Paulo, 34:388p.
Medeiros, L. R. A. 1992. Meiofauna de praia arenosa da Ilha de Anchieta, São Paulo: I Fatores físicos Bolm Inst. Oceanogr., S Paulo, 40(1/2):27-38.
Menn, I. 2002. Beach morphology and food web structure: comparison of an eroding and an accreting sandy shore in the North Sea. Helgolander mar. Res, 56: 177-189. Moore, C. G. 1979. The distribution and ecology of
psammolittoral meiofauna around the Isle of Man Cah. Biol. mar., 20: 383-415.
Moreno, M.; Granelli, V.; Albertelli, G. & Fabiano, M. 2005. Meiofaunal distribution in microtidal mixed beaches of
the Ligurian Sea (NW Mediterranean). Meiofauna Marina, 14:131-137.
Moreno, M.; Ferrero, T.J.; Granelli, V.; Marin, V.; Albertelli, G. & Fabiano, M. 2006. Across shore variability and trophodynamic features of meiofauna in a microtidal beach of the NW Mediterranean. Estuar. coast Shelf Sci., 66: 357-367.
Netto, S. A.; Attrill, M. J. & Warwick, R. M. 1999. The effect of a natural water movement related disturbance on the disturbance on t he structure of meiofauna and macrofauna communities in the intertidal sand flat of Rocas Atoll (Ne, Brazil). J. Sea Res., 42: 291-302. Olafsson, E. 1991. Intertidal meiofauna of four sandy beaches
in Iceland. Ophelia, 33:55-65.
Renaud-Mornant, J. & Pollock, W. 1971. A review of the systematic and ecology of marine Tardigrada. Smithson. Contr.. Zool., 76:109-117.
Rodil, L. F. & Lastra, M. 2004. Environmental factors affecting benthic macrofauna along a gradient of intermediate sandy beaches in northern Spain. Estuarin. coast. Shelf Sci., 61:37-44.
Rodriguez, J.G.; Lopez, J.& Jaramillo, E. 2001. Community structure of the intertidal meiofauna along a gradient of morphodynamic sandy beach types in Southern Chile. Revta Chil. Hist. Nat., 74:885-897.
Rodriguez, J. G.; Lastra, M. & Lopez, J. 2003. Meiofauna distribution along a gradient of sandy beaches in northern Spain. Estuar. coast Shelf Sci, 585:65-71. Salvat, B. 1964. Les conditions hydrodinamiques
interstitielles des sédiments meubles intertidaux et la répartition verticale de la faune endogée. C. R. Acad. Sci,Paris, 259:1576-1579.
Silva, V. M. A. P. da; Grohmann, P.A. & Nogueira, C.S.R. 1991. Studies of meiofauna of Rio de Janeiro, Brazil. Coast. Zone, 91(3):2011-2022.
Silva, V. M. A. P. da, Grohmann, P.A. & Esteves, A.M. 1997. Aspectos gerais do estudo da meiofauna de praias arenosas. In: Absalão, R.S. & Esteves, A. M. eds. Oecologia Brasiliensis III: Ecologia de praias arenosas do litoral brasileiro. Rio de Janeiro: UFRJ.p. 67-92 Snelgrove, P. V. R. & Butman, C. A. 1994. Animal-sediment
relationships revisited: cause versus effect. Oceanogr Mar. Biol. a. Rev., 32:111-177.
Suguio, K. 1973. Introdução à sedimentologia. São Paulo: Blucher/Edusp. 375p.
Veloso, V. G.; Caetano, C. H. S. & Cardoso, R. S. 2003. Composition, structure and zonation of intertidal macroinfauna in relation to physical factors in microtidal sandy beaches in Rio de Janeiro state, Brazil. Sci. Mar., 67(4):393-402.
Wandeness, A.; Esteves, A. M. ; Subrinho, S. J. R. P. & Nogueira, C. S. 1997. Meiofauna da zona entre-marés da Praia dos Anjos, Arraial do Cabo, RJ. In Absalão, R. S. & Esteves, A. M. eds. Oecologia Brasiliensis, III:
Ecologia de praias arenosas do litoral brasileiro. Rio de Janeiro: UFRJ. p. 93-106.
(Manuscript received 07 June 2006; revised 06 November 2006; accepted 21 December 2006)