A FORÇA DOS RELACIONAMENTOS EM REDES
SOCIAIS DE COAUTORIA: ANÁLISES,
MÉTRICAS E UM NOVO MODELO
MICHELE AMARAL BRANDÃO
A FORÇA DOS RELACIONAMENTOS EM REDES
SOCIAIS DE COAUTORIA: ANÁLISES,
MÉTRICAS E UM NOVO MODELO
COMPUTACIONAL
Tese apresentada ao Programa de Pós--Graduação em Ciência da Computação do Instituto de Ciências Exatas da Universi-dade Federal de Minas Gerais como requi-sito parcial para a obtenção do grau de Doutor em Ciência da Computação.
Orientadora: Mirella Moura Moro
MICHELE AMARAL BRANDÃO
TIE STRENGTH IN CO-AUTHORSHIP SOCIAL
NETWORKS: ANALYSES, METRICS AND A NEW
COMPUTATIONAL MODEL
Thesis presented to the Graduate Program in Computer Science of the Federal Univer-sity of Minas Gerais in partial fulfillment of the requirements for the degree of Doctor in Computer Science.
Advisor: Mirella Moura Moro
Brandão, Michele Amaral
B817t Tie strength in co-authorship social networks: analyses, metrics and a new computational model / Michele Amaral Brandão. — Belo Horizonte, 2017
xxx, 166 f. : il. ; 29cm
Tese (doutorado) — Universidade Federal de Minas Gerais – Departamento de Ciência da Computação
Orientadora: Mirella Moura Moro
1. Computação - Teses. 2. Redes de relações sociais. 3. Sistemas de recomendação. 4. Coautoria. I.
Orientadora. II. Título.
I dedicate this work to everyone who believed in me.
Acknowledgments
My warm thanks to everyone who encouraged me and contributed in some way to the development of this work. Firstly, I want to thank God, my fountain of faith, light and hope. Thank you God for all your blessings to me and my family. For the strength You give me each day and for all the people around me. Without You, nothing would be possible.
Also, my huge thanks to my parents, Ivan and Margarete, for all the support, love, care and stimuli unconditionally dedicated in my entire life. If I’m taking another important step in my life, this is a result of the education that you gave me.
I also want to thank my lovely husband Rafick, for being always present, sharing the joys in moments of success and helping me to overcome the moments of discour-agement. For understanding my absence and believing in me. Also, by the right word at the right time and the hug that makes everything seems better.
Additionally, I thank my family and dear friends, specially, my grandmother Janete and my godfather Brandão, my brother Tauan, my lovely uncles and cousins, Delza, Jorge, Tânia, Lívia, Taiana, Iolanda, Ludivan, Manuela, Renata, Leonardo and Sophia for the affection, encouragement and friendship.
I also thank my dear friends who make me feel at home in Belo Horizonte: Ju-liana Padilha, Laís Mota, Natália Machado, Guilherme Vezula, Danilo Seufitelli, Elaine Muniz, Mônica Machado, Arielle Moura, Ricardo Bigarella and Jaqueline Sauer.
I want to especially thank my advisor Mirella M. Moro for her teachings, dis-position, patience, confidence, willingness, opportunities and friendship. Her guidance and knowledge were very essential. Words are few to describe the eternal gratitude for having devoted so much, and for so long, to my guidance.
I also want to thank the faculty at UFMG and UESC. Specially, professor Pedro O. S. Vaz de Melo for his wise ideas, suggestions, disposition and great opportunity of cooperation; professor Ana Paula Couto for all important discussions about social network analyses; professors Jussara Almeida and Wagner Meira Jr. (specifically at the beginning of my PhD) for their willingness to clarify doubts and give suggestions.
Guilherme Augusto, Matheus Diniz, Sérgio Canuto, Vitor Mangaravite, Júlio Reis, Daniel Xavier and Jeancarlo Leão.
I thank the professors, Dr. Ana Paula Couto, Dr. Jonice Oliveira, Dr. José Palazzo M. de Oliveira and Dr. Pedro O. S. Vaz de Melo, for accepting to be part of the defense committees, even in the face of so many commitments and activities.
I thank CAPES, for the financial support in the form of a scholarship. This work was also partially supported by CNPq and InWeb (Brazil). These financial supports are gratefully acknowledged.
I also want to thank my little dog Malú, for all her love, friendship and calming me down when I’m stressed and worried.
Finally, I thank the staff of the Computer Science Department (UFMG) for being always available to solve doubts and meeting requests. Specially, Sônia, Linda, Claudia, Sheila and Cida.
This work would not be possible without all the people in my life. For me, all of you are the best. Thank you very much!
“Success is going from failure to failure without losing your enthusiasm.” (Winston Churchill)
Resumo
O estudo de relacionamentos sociais tem sido utilizado para construir modelos rigorosos que revelam a evolução de redes sociais e seus dinamismos. Uma propriedade dos rela-cionamentos sociais é a força, a qual tem sido aplicada em diferentes contextos como por exemplo: difusão de informação, análises de padrões em logs de comunicação e avaliação da produtividade científica de pesquisadores. Especialmente, analisar a força dos relacionamentos permite investigar como diferentes relacionamentos desempenham papéis distintos e identificar o impacto em nível micro e macro na rede. O objetivo desta tese é medir a força dos relacionamentos de coautoria em redes sociais acadêmi-cas não-temporais e temporais. As principais contribuições são: (1) uma revisão do estado-da-arte e uma taxonomia para redes sociais profissionais, que contextualizam o problema abordado neste trabalho; (2) uma análise de como propriedades topológicas relacionam-se com a força dos relacionamentos, pois nossos resultados mostram que diferentes propriedades topológicas explicam variações na força dos relacionamentos de coautoria, dependendo da área de pesquisa; (3) uma nova métrica chamadatieness que é fácil de calcular e melhor diferencia a força dos relacionamentos em diferentes níveis em redes sociais de coautoria não-temporais; (4) uma análise da dinâmica das forças dos relacionamentos ao longo do tempo por meio de dois algoritmos, um já existente e um proposto aqui, chamado STACY (Strength of Ties Automatic-Classifier over the Years); e (5) um novo modelo computacional chamado temporal_tieness que direta-mente classifica com baixo custo computacional a força dos relacionamentos em redes sociais temporais de coautoria.
Palavras-chave: Rede Social, Força dos Relacionamentos, Redes Temporais.
Abstract
The study of social ties has lead to build rigorous models that reveal the evolution of social networks and their dynamism. A property related to social ties is the strength of ties, which has been largely explored in different contexts, such as information diffusion, analyses of patterns in communication logs and evaluation of scientific researchers pro-ductivity. Specially, analyzing tie strength allows investigating how distinct relation-ships play different roles and identifying impact at micro-macro levels in the network. In this thesis, the goal is to measure the strength of co-authorship ties in non-temporal and temporal real academic social networks. In summary, the main contributions are: (1) a survey and a taxonomy of social professional networks that contextualize the problem addressed in this work; (2) an analysis of how topological properties relate to the strength of ties in non-temporal social networks, as our results show different topological properties explain variations in the strength of co-authorship ties, depend-ing on the research area; (3) a new metric called tieness that is easy to calculate and better differentiates tie strength in different levels in non-temporal co-authorship so-cial networks; (4) an analysis of tie strength dynamism over time by measuring such strength with an existing algorithm in the state of the art and a new one proposed here, called STACY (Strength of Ties Automatic-Classifier over the Years), which bet-ter identifies strong ties; and (5) a new computational model called temporal_tieness that directly classifies the strength of ties in temporal co-authorship social networks with low computational cost.
Keywords: Social Network, Tie Strength, Co-authorship, Temporal Networks.
List of Figures
1.1 Thesis overview: measuring tie strength in non-temporal and temporal
co-authorship social networks. . . 4
2.1 Examples of homogeneous and heterogeneous (bipartite, multipartite, multigraphs and multilayers) SN models. . . 14
2.2 DBLP results when searching publications with the term “social network”. 16 2.3 Real SN classified by their main purpose. . . 16
2.4 Hierarchical diagram of social professional networks types. . . 18
2.5 Main social networks topics related to the tasks and issues. . . 21
2.6 Relationship among clustering, recommendation and ranking algorithms. . 22
2.7 Stages of clustering, recommendation and ranking in social network, based on Jain et al. [1999]. . . 23
2.8 Clustering techniques and their overlaps: E - exclusive, NonE - nonexclusive, In - intrinsic, Ex - extrinsic, H - hierarchical and P - partitional. . . 26
4.1 Architecture of a general research evaluation-oriented system. . . 46
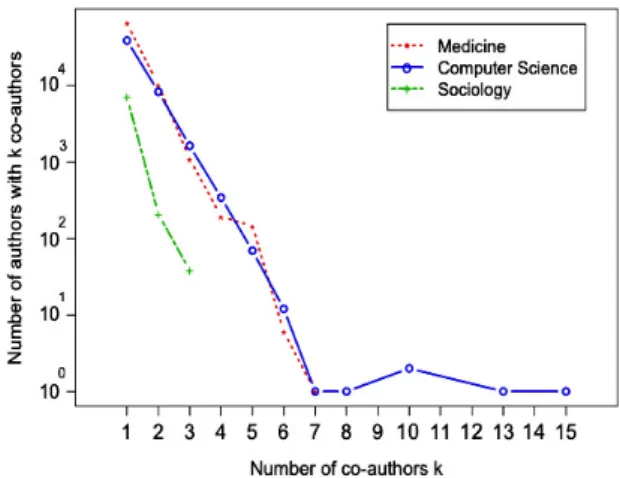
4.2 Distribution of numbers of co-authors for researchers in each area. . . 47
4.3 Analyzing the neighborhood overlap versus co-authorship frequency. . . 49
4.4 Empirical CDF of neighborhood overlap and co-authorship frequency com-puted by the co-authorship between pairs of researchers. . . 50
4.5 The strength of ties intra-communities in a perfect clustering. . . 61
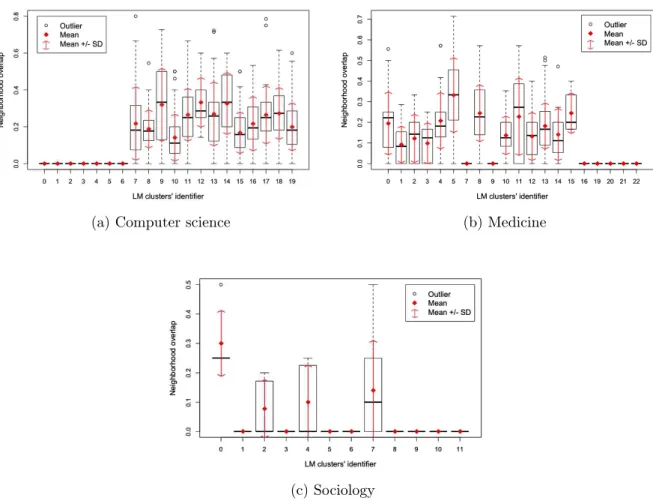
4.6 LM – The strength of ties intra-communities measured by neighborhood overlap. . . 62
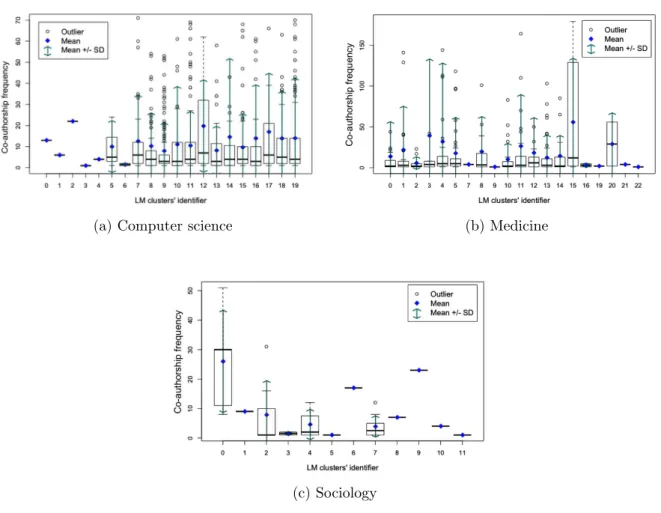
4.7 LM – The co-authorship frequency as a measure of the strength of ties intra-communities. . . 63
4.8 LM – The strength of ties inter-communities measured by neighborhood overlap. . . 64
4.10 CPM – Neighborhood overlap as a measure of the strength of tie
intra-communities (note the small number of outliers). . . 66
4.11 CPM – The co-authorship frequency as a measure of the strength of ties intra-communities. . . 67
4.12 Empirical CDF of overlaps among communities detected by CPM. . . 68
4.13 MCL – The strength of ties intra-communities measured by neighborhood overlap (clusters’ identifiers in x axis are ordered by the size of communities). 70 4.14 CPM – The strength of ties intra-communities measured by co-authorship frequency (x axis ordered by the size of communities; all outliers are present). 71 4.15 Comparing the results of the clustering methods and using neighborhood overlap to measure the strength of the ties. . . 72
4.16 Comparing the results of the clustering methods and measuring the strength of the ties with co-authorship frequency. . . 74
5.1 Case 1, no common co-author. . . 79
5.2 Case 2, no community information. . . 80
5.3 Case 3, many common co-authors. . . 80
5.4 Case 4, results too small/high. . . 81
5.5 ECDF of each metric. In this scenario, modified neighborhood overlap and tieness metrics have more distinct values through the quartiles. . . 85
6.1 Main steps to analyze the link persistence and link transformation through different tie strength classes. . . 93
6.2 The performance of RECAST and fast-RECAST for PubMed dataset (the largest one). . . 99
6.3 Distribution of quantity of publications by pairs of researchers as counted yearly. . . 102
6.4 Distribution of quantity of publications by pairs of researchers in each class detected by STACY. . . 104
6.5 Social network for each relationship class from DBLP Articles and DBLP Inproceedings dataset. . . 105
6.6 Social network for each relationship class from PubMed and APS dataset. 106 6.7 Amount of pairs of authors in each class generated by fast-RECAST. . . . 109
6.8 SNs with N nodes and edges classified as strong ties. . . 111
6.9 Amount of pairs of authors in each class generated by STACY. . . 112
A.1 CNARe architecture. . . 156 A.2 Relational schema of CNARe database: 16 main tables and two associative
tables (Publication_has_Researcher and Researcher_has_Area). . . 157 A.3 Use case diagram: a researcher can execute all actions. The include indicates
that those actions depending on the search of a researcher. . . 159 A.4 Main interface of CNARe with recommendations to Mirella M. Moro. . . . 160 A.5 Green lines represent recommended collaborations: the more intense more
has been recommended by the algorithm. . . 161 A.6 Global network example. . . 162 A.7 Visualization of PubMed social network from the venue Lancet Medical
Journal (London, England). . . 165
List of Tables
2.1 Topological properties and concepts on social networks. . . 17 2.2 Recommendation Summary. . . 33
3.1 Datasets and their basic statistics and information. . . 38 3.2 Given two nodes i and j, there are different metrics that can be used to
measure the strength of ties. . . 42
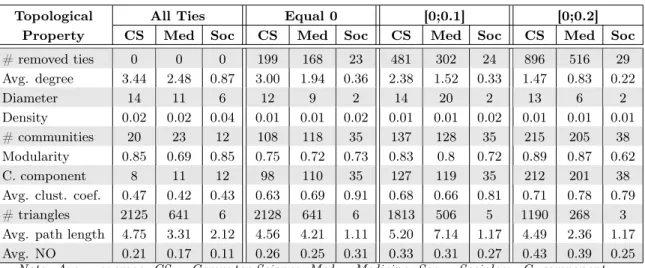
4.1 Description of the datasets for building social networks. . . 47 4.2 Co-authorship social networks properties when removing weak ties. . . 52 4.3 Co-authorship social networks properties when removing strong ties. . . 52 4.4 Social network topological properties (see [Easley and Kleinberg, 2010] for
formal definitions). . . 53 4.5 Pearson correlation coefficients between topological properties and
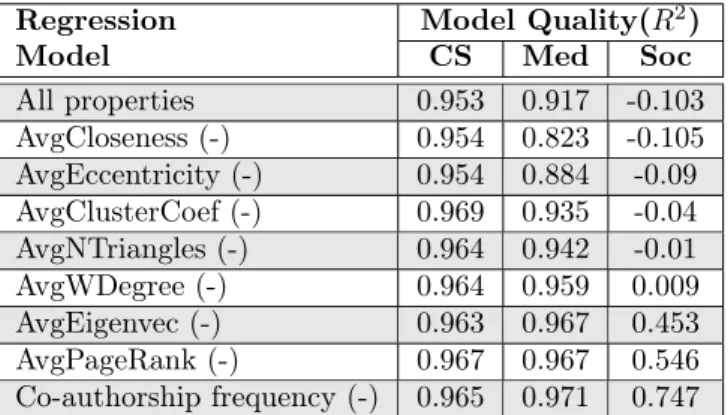
neigh-borhood overlap. Values lower than 0.1 are insubstantial. . . 54 4.6 Results with all properties and removing one property at a time. . . 57 4.7 Computer Science: Variation of neighborhood overlap and co-authorship
frequency between pairs of researchers in different communities. . . 69 4.8 Medicine: Variation of neighborhood overlap and co-authorship frequency
between pairs of researchers in different communities. . . 69 4.9 Properties correlation to the strength of ties. . . 75
5.1 The correlation coefficients between neighborhood overlap and co-authorship frequency. All p-values are smaller than 2.2e-16. . . 81 5.2 Tieness for each case study. . . 84 5.3 DBLP Articles: Number of connected components when weak and strong
ties are removed from the social network. . . 86 5.4 DBLP Inproceedings: Number of connected components when weak and
strong ties are removed from the social network. . . 87
5.6 APS: Number of connected components when weak and strong ties are removed from the social network. . . 87 5.7 Proportion between the number of connected components and the number
of edges in the social networks when weak and strong ties are removed. . . 88
6.1 STACY relationship classes. . . 100 6.2 Top 10 researchers with most publications and their respectively co-authors
with most publications in strong class. . . 103 6.3 Top 10 researchers with most publications and their respectively co-authors
with most publications in bridge+ class. . . 104 6.4 Top 10 researchers with most publications and their respectively co-authors
with most publications in transient class. . . 107 6.5 Top 10 researchers with most publications and their respectively co-authors
with most publications in periodic class. . . 107 6.6 Top 10 researchers with most publications and their respectively co-authors
with most publications in bursty class. . . 107 6.7 Top 10 researchers with most publications and their respectively co-authors
with most publications in bridge class. . . 107 6.8 Top 10 researchers with most publications and their respectively co-authors
with most publications in weak class. . . 108 6.9 Top 10 researchers with most publications and their respectively co-authors
with most publications in random class. . . 108 6.10 fast-RECAST: 80% represents the past and 20% is the present. . . 113 6.11 fast-RECAST: 70% represents the past and 30% is the present. . . 113 6.12 STACY: 80% represents the past and 20% is the present. . . 114 6.13 STACY: 70% represents the past and 30% is the present. . . 114 6.14 fast-RECAST: Link transformation results for DBLP Articles. . . 115 6.15 fast-RECAST: Link transformation results for DBLP Inproceedings. . . 115 6.16 fast-RECAST: Link transformation results for PubMed. . . 116 6.17 fast-RECAST: Link transformation results for APS. . . 116 6.18 STACY: Link transformation results for DBLP Articles. . . 116 6.19 STACY: Link transformation results for DBLP Inproceedings. . . 116 6.20 STACY: Link transformation results for PubMed. . . 117 6.21 STACY: Link transformation results for APS. . . 117 6.22 Range of values per class in DBLP Articles. . . 118
6.23 Range of values per class in DBLP Inproceedings. . . 118 6.24 Range of values per class in PubMed. . . 118 6.25 Range of values per class in APS. . . 118
A.1 Description of the dataset stored in CNARe database. . . 159 A.2 Description of the large social networks stored in CNARe database. . . 163
Contents
Acknowledgments xi
Resumo xv
Abstract xvii
List of Figures xix
List of Tables xxiii
1 Introduction 3
1.1 Relevance . . . 5 1.2 Hypothesis and Goals . . . 7 1.3 Contributions . . . 9 1.4 Thesis Organization . . . 10
2 General Taxonomy for Social Networks 11
2.1 Main Definitions . . . 13 2.1.1 Social Networks Overview . . . 13 2.1.2 Social Professional Networks Types . . . 18 2.2 General Taxonomy for Social Networks . . . 20 2.3 Clustering . . . 23 2.3.1 Nodes and Edges Patterns . . . 23 2.3.2 Clustering Techniques . . . 24 2.3.3 Clustering Evaluation . . . 27 2.3.4 Clustering Overview on Social Professional Networks . . . 29 2.4 Recommendation . . . 30 2.4.1 Topological and Semantic Features . . . 30 2.4.2 Recommendation Techniques . . . 31
2.5 Ranking applied to Clustering and Recommendation . . . 34 2.6 Future Directions . . . 34 2.7 Concluding Remarks . . . 36
3 Background 37
3.1 Basic Concepts for the Experimental Analyses and Evaluations . . . 37 3.1.1 Co-authorship Social Networks . . . 37 3.1.2 Approaches to Tie Strength Analyses and Measures . . . 38 3.2 Related Work over Tie Strength . . . 41 3.2.1 Tie Strength Overview . . . 41 3.2.2 Tie Strength in Temporal Networks . . . 43 3.3 Concluding Remarks . . . 44
4 A Preliminary Study on the Strength of Co-authorship Ties 45
4.1 Datasets Main Features . . . 46 4.2 Characterizing the Strength of Ties . . . 47 4.2.1 Neighborhood Overlap Characterization . . . 48 4.2.2 Granovetter’s Theory Analysis . . . 51 4.3 The Impact of the Properties on Tie Strength . . . 53 4.3.1 Correlation Analyses . . . 54 4.3.2 Regression Analyses . . . 55 4.4 A Comparative Analysis of the Strength of Co-authorship Ties in Clusters 58 4.4.1 Analyses Setup . . . 60 4.4.2 Evaluated Clustering Techniques . . . 62 4.4.3 Comparative Analyses . . . 73 4.5 Concluding Remarks . . . 75
5 Tie Strength over Non-temporal Co-authorship Social Networks 77
5.1 Methods Overview . . . 78 5.2 Neighborhood Overlap and Absolute Frequency of Interaction . . . 79 5.2.1 Four Motivating Cases . . . 79 5.2.2 Analysis of N O and W over Different Networks . . . 81 5.3 Tieness: a New Metric for the Strength of Ties . . . 82 5.4 Results and Discussion . . . 86 5.5 Concluding Remarks . . . 88
6 Tie Strength over Temporal Co-authorship Social Networks 91
6.1 Fundamental Concepts . . . 93 6.1.1 Temporal Social Networks Models . . . 94 6.1.2 The Original RECAST . . . 95 6.2 Measuring Tie Strength . . . 96 6.2.1 Revisiting the Concept of Tie Strength . . . 97 6.2.2 Multiprocessing RECAST . . . 97 6.2.3 STACY . . . 99 6.3 Experiments and Results . . . 101 6.3.1 Data Description . . . 102 6.3.2 Characterizing STACY Classes . . . 103 6.3.3 Comparing fast-RECAST and STACY . . . 108 6.3.4 Deriving temporal_tieness from STACY . . . 118 6.4 Concluding Remarks . . . 119
7 Conclusions and Future Work 121
7.1 Conclusions . . . 121 7.1.1 RQ1: How to identify which aspects impact on the strength of
collaboration ties? . . . 121 7.1.2 RQ2: How to measure the strength of co-authorship ties in
non-temporal social networks? . . . 122 7.1.3 RQ3: How to measure the strength of co-authorship ties in
tem-poral social networks? . . . 122 7.1.4 RQ4: How is tie strength defined for temporal networks? . . . . 123 7.1.5 RQ5: How much does the strength of ties vary over time? . . . 123 7.2 Publications . . . 124 7.3 Open Problems and Future Work . . . 125
Bibliography 129
Appendix A CNARe 153
A.1 Related Work . . . 154 A.1.1 Recommender Systems . . . 155 A.1.2 Social Network Visualizations . . . 155 A.2 CNARe Architecture . . . 156 A.3 Design and Interfaces . . . 160 A.3.1 Collaboration Recommendation . . . 160 A.3.2 Visualizations and Filters . . . 161
A.5 Concluding Remarks . . . 165
List of Acronyms and Abbreviations
Acronym Description
APS American Physical Society
CNARe Co-authorship Networks Analysis and Recommendations
coAfrequency Co-authorship Frequency
CCDF Complementary Cumulative Distribution Function
CPM Clique Percolation Method
CS Computer Science
DBLP Digital Bibliography & Library Project
DCWN Dynamic Complex Wireless Networks
ECDF Empirical Cumulative Distribution Function
fast-RECAST fast Random rElationship ClASsifier sTrategy
LM Louvain Method
MCL Markov Cluster Algorithm
Med Medicine
NO Neighborhood Overlap
per Edge Persistence
RECAST Random rElationship ClASsifier sTrategy
RQ Research Question
SN Social Network
Soc Sociology
SPN Social Professional Network
STACY Strength of Ties Automatic-Classifier over the Years
Chapter 1
Introduction
Social networks (SN) are complex structures that describe individuals in any social context. Theoretically, they can be mapped to graphs where nodes represent the in-dividuals and edges connect nodes according to the inin-dividuals relationships. Then, properties and features can be extracted from the graph as well as metrics can be applied to nodes and edges in order to better understand the individuals social be-havior [Barabási, 2016]. Finally, there are many interesting applications based on such networks, including (but definitely not limited to) ranking individuals and their groups, link prediction, information diffusion, recommendation and pattern analysis (e.g., [Bagci and Karagoz, 2016; Brandão and Moro, 2017a; Brandão et al., 2013; Freire and Figueiredo, 2011; Hristova et al., 2016; Luna et al., 2013; Seo et al., 2017]).
Furthermore, Social Networks Analysis has evolved from a Social Sciences re-search area to a Computer Science-based Multidisciplinary rere-search area. Despite the many analyses possible, there are two main aspects to any research at both perspec-tives (Social and Computer Science): (i) how to collect and manage social data, and (ii) how to build and analyze the social networks derived from such data.
Also, a specific perspective of evaluation is given by academic social networks, in which nodes represent researchers and edges their co-authorships and academic rela-tions. Building the structure of such networks is relatively simple, as the nodes are given by any set of researchers who are connected through their common published work, for example. However, one central aspect of more complex analysis is the strength of the ties among researchers, as pairs of researchers have stronger or weaker connections depending on the degree of academic relationship. Such degree of relationship (or tie strength) may be defined according to Granovetter’s theory: the ties are weak when they serve as bridges in the network by connecting users from different groups, and strong when they link individuals in the same group (community) [Granovetter, 1973].
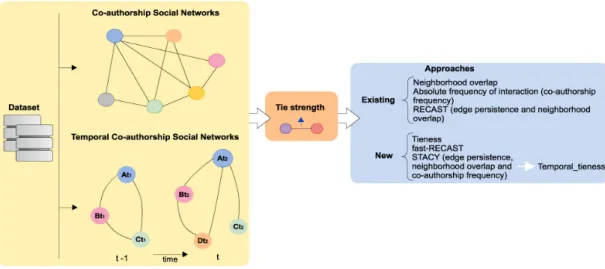
Figure 1.1: Thesis overview: measuring tie strength in non-temporal and temporal co-authorship social networks.
Starting from measuring tie strength in non-temporal (static) co-authorship SNs, this thesis moves forwards to temporal (dynamic) co-authorship social networks. Non-temporal co-authorship social networks do not consider time as an aspect of the rela-tionships, whereas temporal social network do. In this context, studying the strength of ties allows to identify patterns of co-authorship over time, to detect aspects that influence it, to determine a limit of co-authorship in a period, and so on.
Tie strength may be measured by a combination of the amount of time, the coop-eration intensity and the reciprocal services that characterize the tie [Granovetter, 1973; Rana et al., 2014]. Such strength may also be measured by using theneighborhood over-lap metric (also known as topological overlap or Jaccard Similarity Coefficient) [Easley and Kleinberg, 2010], a numerical quantity that captures the total number of collabo-rations between the two ends of each edge. This metric has been used for uncovering the community structure [Li et al., 2012], analyzing structural properties of a large network of mobile phone users [Akoglu and Dalvi, 2010] and measuring tie strength [Brandão and Moro, 2015; Easley and Kleinberg, 2010; Onnela et al., 2007; Pan and Saramäki, 2012; Vaz de Melo et al., 2015]. In this thesis, neighborhood overlap is the base to the development of new tie strength metrics and algorithms.
1.1. Relevance 5
existing ones (neighborhood overlap, absolute frequency of interaction and RECAST – Random rElationship ClASsifier sTrategy), and three proposed by us (tieness1,
fast-RECAST and STACY – Strength of Ties Automatic-Classifier over the Years). Note that RECAST (consequently, fast-RECAST) and STACY use an additional feature called edge persistence [Nicosia et al., 2013; Vaz de Melo et al., 2015]. Such feature has been used to measure tie strength in mobile networks [Akoglu and Dalvi, 2010; Raeder et al., 2011], but not applied in co-authorship social networks. Thus, in this thesis we define a computational model and algorithm to automatically infer the strength of the ties in non-temporal and temporal co-authorship social networks.
1.1
Relevance
Extracting and analyzing relevant knowledge from social networks provide many chal-lenges for developers, users and technology. For developers, after collecting data from collaborators, it is necessary to model, store and manage them within databases with proper interface to whatever application uses them. For users, when they need to ob-tain relevant knowledge from these networks. For technology, which should provide the necessary support for implementation of methodologies. For instance, exploring collab-orative relations can improve the accuracy and quality of existing methods that combine bibliometry and academic social analysis. In such a context, this thesis presents two main contributions: (i) to define a metric that represents the strength of the relation-ship between pairs of collaborators in non-temporal co-authorrelation-ship social network; and (ii) to develop an algorithm that automatically classifies the strength of ties in tem-poral co-authorship social networks. Moreover, we derive a computational model with low computational cost from this algorithm that can be used to measure the strength of co-authorship ties in temporal networks.
Specifically, initial studies of social networks have emphasized the importance of properly measuring the strength of social ties to understand social behaviors [Brugge-man, 2016; Granovetter, 1973; New[Brugge-man, 2001a]. Also, the study of social ties has been used to build rigorous models that reveal the evolution of social networks and the dynamics of information exchange [Aiello et al., 2014]. More recently, analyzing tie strength has allowed to investigate the different roles of relationships including ranking for influence detection [Freire and Figueiredo, 2011], identify impact at micro-macro levels in the network [Burt, 2010], its influence in patterns of communications [Wiese et al., 2015] and team formation [Castilho et al., 2017].
1
Despite the importance of analyzing the strength of ties, there are not many studies on evaluating how to measure it inscientific collaboration networks (also called co-authorship networks). In such networks, nodes are researchers and there is an edge between those pairs that have co-authored at least one scientific publication. Specif-ically, studying the strength of co-authorship ties may reveal how its behaviors re-late to research, and any application based on co-authorship patterns may benefit. For instance, new strength-related metrics could help existing works on measuring re-search productivity [Chan et al., 2016; Ductor, 2015], ranking rere-searchers [Freire and Figueiredo, 2011] and their graduate programs [Lopes et al., 2011], as well as recom-mending collaborations [Brandão et al., 2013].
Furthermore, properly measuring the strength of co-authorship ties may help to identify which collaborations are more influent to each researcher. For example, if a researcher A collaborates with other researchers B and C, the strength of ties reveals which one is more important toA, then allowing different studies, such as team
formation analyses. Also, researchers that form mostly weak (or strong) ties in the social network may indicate different collaboration patterns. For example, a researcher who has many collaborators through single papers, i.e., that person has collaborated only once with many people.
Formally, we consider two definitions of tie strength in this thesis. The first one is for non-temporal social networks, in which given a non-temporal graph G(V,E), a tie(i, j) is likely to be strong if it has a high number of common neighbors or a large co-authorship frequency. On the other hand, the tie (i, j) is likely to be weak if it has few common neighbors or small co-authorship frequency. The second definition is for temporal social networks, in which given a temporal graph Gk(Vk,Ek), where k is
the time step in which a co-authorship occurs, a tie(i, j) is likely to be strong if it is
present inGk for most values ofk, and likely to be weak if it is present in Gk for just
a few values ofk.
One of the first notable studies covering tie strength was published by Granovetter [1973]. He presents the importance of weak ties in SNs for various aspects, such as the spread of information. Since then, the strength of ties has been studied in different contexts with distinct goals [Brandão and Moro, 2015; Gupte and Eliassi-Rad, 2012; Lopes et al., 2011; Silva et al., 2014]. However, few studies have addressed the strength of ties in temporal social networks [Dasgupta et al., 2008; Karsai et al., 2014; Kostakos, 2009; Laurent et al., 2015; Nicosia et al., 2013].
1.2. Hypothesis and Goals 7
interactions appear and others perish over time. Also, social networks properties are employed over different domains for distinct purposes, including (but not limited to) recommend collaborators [Brandão et al., 2013; de Sousa et al., 2015; Lopes et al., 2010], viral marketing [Subramani and Rajagopalan, 2003] and graduate programs evaluation [Lopes et al., 2011]. Hence, those properties should represent reality in the best way and consider the time dimension - as time is part of most realities. Furthermore, adding time to any social model may interfere in the process of computing not only properties and features but also complex calculations such as defining communities.
1.2
Hypothesis and Goals
Tie strength can be computed in different ways (for example, amount of time, co-operation intensity and reciprocal services). Then, our main hypothesis is that such strength can be better computed by considering the neighbors of individuals involved in the relationship and combining it with other social networks properties (such as the absolute frequency of interaction and edge persistence). Also, we claim that the time is an important aspect to consider when measuring tie strength. Thus, the main goal of this research is to propose, apply and validate new strategies to measure the strength of co-authorship ties in non-temporal and temporal social networks. These are not easy tasks as there is no ground truth to automatically evaluate the strength of ties metrics. Hence, this general objective can be divided in five specific goals, defined by the following research questions:
• Research Question 1 (RQ1): How to identify which aspects impact on the strength of co-authorship ties? The analysis of aspects that affect the strength of collabo-ration ties is important to better measure and represent such strength. According to Granovetter’s theory, aspects related to the strength of ties are the amount of time, the cooperation intensity and the reciprocal services. Indeed, analyz-ing such strength based on a sanalyz-ingle absolute value from a metric may provide misleading interpretations. We use statistical techniques to answer this question.
thesis, we compare three non-temporal approaches: neighborhood overlap, abso-lute frequency of interaction (also known as co-authorship frequency) and tieness (our new metric). Note that we compare neighborhood overlap and tieness by analyzing how both differentiate the strength of ties between pairs of researchers.
• Research Question 3 (RQ3): How to measure the strength of co-authorship ties in temporal social networks? Considering the temporal aspect to measure social net-work properties is a challenge due to the dynamism of nodes and their interactions over time. In this thesis, we measure the strength of co-authorship ties in tempo-ral networks by using tree different approaches: RECAST and fast-RECAST (a multiprocessing version of RECAST), and STACY (our new algorithm). Then, we derive a computational model from STACY to measure the strength of ties. Also, we compare RECAST and STACY by investigating how they classify ties that persist over time.
• Research Question 4 (RQ4): How is tie strength defined for temporal networks? There are several measures of tie strength for non-temporal networks. For in-stance, Dasgupta et al. [2008] consider an edge with high call frequency or call volume (weight) as a strong tie, whereas Brandão and Moro [2015] define strong ties as edges with high neighborhood overlap (also known as topological overlap). In temporal networks, such definitions do not hold, since these values may vary over time. In this thesis, we consider that a strong tie characterizes interactions that are likely to appear in the future, whereas a weak tie occurs sporadically.
• Research Question 5 (RQ5): How much does the strength of ties vary over time? Nicosia et al. [2013] claim that if two nodes are strongly (or weakly) connected in a time t1, they will also be strongly (or weakly) linked in a time t2 where
1.3. Contributions 9
edge classes composed from two of the aforementioned metrics, namely edge per-sistence and neighborhood overlap (the two metrics are part of RECAST and fast-RECAST). These properties represent the regularity of interaction and the similarity between people in a relationship. Then, we compare the results gener-ated by these two metrics, which give four tie strength classes, with the results of eight edge classes from the combination of edge persistence, neighborhood overlap and co-authorship frequency, which compose STACY.
1.3
Contributions
The main contributions of this thesis are summarized as follows.
1. A new general taxonomy to social networks that helps to identify related work in the area according to their main goal (necessary to all research questions).
2. An analysis of how nine topological properties affect the strength of co-authorship ties when measured by neighborhood overlap (RQ1). Here, we present a multiple regression model to predict the value of neighborhood overlap by using different topological properties.
3. A nominal scale to neighborhood overlap for classifying a tie as weak or strong (RQ2). We define such scale by analyzing the distribution of neighborhood over-lap and comparing the values of neighborhood overover-lap with the absolute frequency of interaction. Then, we present four case studies that show problems of measur-ing the strength of ties with only neighborhood overlap or absolute frequency of interaction. Easley and Kleinberg [2010] claim neighborhood overlap can be used to measure the strength of ties. We verify that such metric can also be applied in co-authorship SN. However, such metric presents limitations when applied alone.
4. A new metric to measure the strength of ties in non-temporal social networks called tieness, resulting from a combination of a modified neighborhood overlap with absolute frequency of interaction (or co-authorship frequency) (RQ2). We also define a nominal scale to tieness based on the values of modified neighborhood overlap and absolute frequency of interaction.
6. A set of eight tie strength classes identified by STACY (RQ3). We have charac-terized each class according to the number of researchers’ publication.
7. An analysis of how tie strength is defined over time (RQ4). To do so, we improve an existing algorithm (RECAST) that we call as fast-RECAST. We also use STACY to do such analysis.
8. An analysis of how such strength varies through the years (RQ5). Our results show that most ties, even the strong ones, tend to perish over time. Also, real co-authorship social networks from different research areas have more weak and random ties than strong and bridge ties. Finally, STACY is able of better identify strong ties than fast-RECAST.
1.4
Thesis Organization
Chapter 2
General Taxonomy for Social
Networks
The Web has introduced different and new ways in which professionals can easily share their work, publish content, find job opportunities, interact with other professionals, and so on. Besides general purpose social networks (SN), such as Facebook and Twitter, there are online social professional networks (SPN) whose focus is on those activities. Indeed, there are currently more than 20 websites for social professional purposes. Furthermore, as pointed out by Yang et al. [2014], online social networks as a type of communication networks enable straightforward information access. Finally, with a big volume of data available, researchers have used the data from those sites to study SPN characteristics and discover behavioral patterns.
However, there are many challenges in working with social networks [Kleinberg, 2007; Knoke and Yang, 2008]: collecting the data, inferring social process from the data, keeping individual privacy, choosing the best technique to select the data, among others. The social professional networks have an additional challenge that is modeling user emotion. For instance, it is hard to differ if a professional behavior is based on emotional reasons or not. Therefore, in this chapter, we help to identify possible solutions in the literature for these challenges by categorizing existing work according to the social professional network type, goal and stage of development. Note that co-authorship social network is a type of social professional network. Thus, this chapter helps to situate the tie strength research in the state of the art.
Specifically, we define that different research topics address social professional networks and are divided in issues and tasks. The issues emerge from the need for crawling, storing, managing and treating the data from the networks [Carpineto and Romano, 2012; Chau et al., 2007; Garcia-Molina et al., 2000; Gjoka et al., 2011b;
Han et al., 2011; Harth et al., 2006; Huynh et al., 2012; Mihalcea and Radev, 2011; Rezvanian and Meybodi, 2015; Russell, 2013; Vural et al., 2014; Zaki and Meira Jr, 2014; Zhuang et al., 2005]. Then, the tasks represent the ways that such networks can be analyzed, used, improved and applied in different contexts [Aral and Walker, 2012; Arnaboldi et al., 2016; Brandão and Moro, 2015; Easley and Kleinberg, 2010; Elmacioglu and Lee, 2005; Guille et al., 2013; Kadushin, 2012; Kempe et al., 2003; Kramer, 2010; Murray, 2013; Pak and Paroubek, 2010; Park et al., 2015; Scott and Carrington, 2011; Trusov et al., 2009; Wasserman, 1994; Weng et al., 2010].
In this chapter, we propose a general taxonomy considering issues and tasks as a first-level classification. Overall, the issues are problems within social networks regarding their maintenance and usage, whereas the tasks are problems whose solutions benefit fromusing SN data. We describe works related to both, but we focus on research topics related to tasks that are specific to social professional networks (note that issues relate to any type of SN). Hence, we further analyze works whose main tasks are: (i) grouping people or items on SPN, (ii) recommending people or items, and (iii) applying ranking strategies to improve the last two topics.
For the first task, the strategy to form groups is called clustering and has been largely presented in different contexts [Ahmed et al., 2014; Backstrom et al., 2006; Blondel et al., 2008; Fortunato, 2010; Girvan and Newman, 2002; Gómez et al., 2015; Keyes, 2015; Palla et al., 2005; Palla et al., 2007; Sales-Pardo et al., 2007; Tang et al., 2007; Xie et al., 2013]. We note that organizing data into groups is one of the most fundamental ways of understanding and learning about patterns intra and inter commu-nities. In turn, considering the variety of information available on social networks that potentially overwhelms users, generating recommendations becomes crucial [Brandão et al., 2013; Lopes et al., 2010; Lops et al., 2011; Schall, 2014; Sharma and Yan, 2013; Yang et al., 2015, 2014; Yu et al., 2016b; Zhang et al., 2014]. At that end, ranking strategies are important to improve clustering approaches [Ahmed et al., 2014; Baumes et al., 2005; Sun et al., 2009] and essential to present the recommendations in a proper order [Brandão et al., 2013; Fouss and Saerens, 2008; Liben-Nowell and Kleinberg, 2007; Lopes et al., 2010; Pu et al., 2012; Schall, 2014; Shani and Gunawardana, 2011; Sharma and Yan, 2013; Song et al., 2011; Xia et al., 2014; Yang et al., 2015; Zhang et al., 2014].
2.1. Main Definitions 13
search by publications on Google Scholar1 using the keyword “Social Network”. Then,
we consider only publications in relevant venues of Computer Science area (specifically, publications from ACM, SPRINGER, ELSEVIER, IEEE); (Step 3) Evaluating study quality: we compare different studies grouping them by their main characteristics and analyzing the year of publication, venue, number of citations and abstract; (Step 4) Summarizing the evidences: we summarize the evidences in distinct categories that allow to identify the main research topics in SN; (Step 5) Interpreting the findings: systematic review findings allow to generate our new taxonomy.
In this chapter, our main contributions are: an overview about social networks and a categorization of social professional networks (Section 2.1); a general taxonomy for social professional networks (Section 2.2); a summary of clustering algorithms (Sec-tion 2.3) and recommenda(Sec-tion approaches (Sec(Sec-tion 2.4) applied to social professional networks grouped by their stages of development; a discussion on ranking strategies applied to clustering and recommendation approaches (Section 2.5); and insights over future directions (Section 2.6).
2.1
Main Definitions
In this section, we focus on social professional networks, a specific type of social net-works in which the relationships go beyond simply friendship and acquaintances. Thus, we first present an overview of social networks (Section 2.1.1) and then describe the social professional networks with their main types and features (Section 2.1.2).
2.1.1
Social Networks Overview
Any society or social interaction can be mapped to a SN. Then such a network can be analyzed to reveal hidden information of all types, from how a disease has spread and major political views to who the new criminals are.
A social network is defined as a graph(V,E), where V is the set of nodes (or vertices) representing individuals (persons, organizations, countries, etc), and E is the set of edges (or links) constituting their relationships, given by an n ×n matrix in
which ei,j ∈ E is the (weighted or not, directed or not) relation between nodes i and j [Barabasi, 2002; Newman, 2003; Wasserman and Faust, 1994]. In such definition,
the set of nodes and edges can be of a single type, representing a homogeneous social network model. For example, all nodes represent persons and all edges their friendship.
1
Figure 2.1: Examples of homogeneous and heterogeneous (bipartite, multipartite, multigraphs and multilayers) SN models.
Likewise, having more than one type of nodes defines a heterogeneous social net-work, e.g., nodes can be people and blogs. The edges between people result from a comment of a person in a post of another person, and the edges from people to blogs represent a person who posted in that blog. There are also edges between blogs, if they have related topics. In both types of social networks (homogeneous or heterogeneous), the edges can be directed or not, and weighted or not. To better illustrate the dif-ferences, Figure 2.1 shows generic structures of social networks for homogeneous and heterogeneous models.
Heterogeneous social networks can also be modeled by bipartite or multipartite graphs [Ghosh and Lerman, 2009]. Bipartite graphs are formally defined asgraph(V1∪ V2,E), in which a nodeiinV1 can be only connected to another nodej inV2, i.e. there is no connection among nodes withinV1 (or V2). Figure 2.1 presents an example of an undirected bipartitie graph, in which, for instance, the nodes represented by pentagons can be women in social networks and the nodes illustrated by cubes can be events that they attended. Likewise, multipartite graphs withn different types of nodes are formally described asgraph(V1∪ V2∪...∪ Vn,E)such that for each edge betweeniand j,i∈ Vk andj ∈ Vk+1for somek∈ {1, ..., n−1}[Dawande et al., 2001]. Figure 2.1 also presents a structure of undirected multipartite graphs, in which, for example, nodes represented by pentagons are developers, nodes identified by circles are development projects, and the cubes are a set of commits that a developer did in a project. The thickness of the edges represents the strength of the relationship.
2.1. Main Definitions 15
...∪Vn,E1∪E2∪...∪Em), whereV is the set of nodes ofntypes (representing individuals or
items, e.g., events) and belongs toVk...Vnfor somek ∈ {1, ..., n−1}, and edges between
nodes in V can be of m types and belong to Ek...Em for some k ∈ {1, ..., m−1}. For
instance, the multigraph in Figure 2.1 may represent a knowledge-sharing network (e.g. Stack Overflow2), in which the nodes are different individuals and they are connected
by distinct relationships, such as making questions, answering questions, commeting questions or answers. The latter represents networks where nodes are in several layers of the graph, and nodes from a layer are connected to nodes in another one [Bianconi, 2013; Kivelä et al., 2014; Lotero et al., 2016].
In a formal way, multilayer graphs are determined bygraph(Vα,Eα, L
|L|), in which
α ∈ {1, ...,|L|} and |L| is the number of layers. Each layer may represent nodes from distinct social networks, social status, organizations, among others. For example, each layer of the multilayer graph in Figure 2.1 represents a social network: Layer 1 is GitHub3, Layer 2 is AngelList4 and Layer 3 is ResearchGate5. Moreover, according
to Salehi et al. [2015], multilayer is a generic term that refers to models involving multiple graphs, such as interconnected [Hristova et al., 2016], multiplex (different types of relationships) [Meng et al., 2016], interdependent [Dickison et al., 2016], multisliced [Mucha and Porter, 2010], multidimensional [Ahmed et al., 2016], multiple [Zhang et al., 2016b], multilevel [Wang et al., 2016] networks, and networks of networks [D’agostino and Scala, 2014]. Kivelä et al. [2014] also consider that all these networks are types of multilayer network, but with a few distinct properties, such as the adjacency of nodes, the set of nodes and edges, the number of possible layers, and so on.
There are other models that consider the dynamics of temporal and spatial infor-mation [Kivelä et al., 2014]. Considering the temporal aspect, social networks evolve as relationships may appear or disappear over time [Kostakos, 2009]. The analysis of temporal graphs (also called as time-varying networks) may reveal publications pat-terns [Wang et al., 2016] and users’ interactions classes (random or social relationship) [Vaz de Melo et al., 2015], for example. Another dynamic aspect is the spatial infor-mation, in which the nodes have locations and the existence of edges are described by those locations [Dale and Fortin, 2010]. Spatial networks (also known as location-based social networks) have been investigated to improve link prediction algorithms [Scellato et al., 2011] and to discovery malicious accounts [Xuan et al., 2016], among others.
Overall, social networks is a very prolific research area. Indeed, looking for “social
2
Stack Overflow: stackoverflow.com 3
GitHub: github.com 4
AngelList: angel.co 5
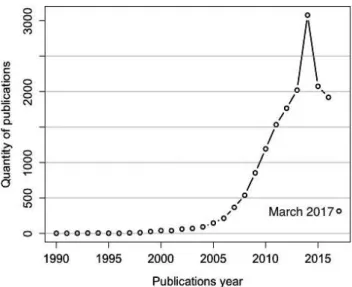
Figure 2.2: DBLP results when searching publications with the term “social network”.
Figure 2.3: Real SN classified by their main purpose.
network” on DBLP6 returned over 16,380 entries in March 2017. Considering them,
Figure 2.2 presents the noncumulative distribution of the increasing amount of publi-cations over the years. Focusing in 2017, there are 314 publipubli-cations by March 29th.
Among such publications, there are studies addressing different types of social networks with specific goals. Considering social interaction aspects, a high-level classi-fication for such networks is: onlineandoffline. An online SN is a website or web-based service that allows people to interact with others, i.e., the relationship between users is caracterized by the presence of online communications and not necessarily face-to-face contact [Arnaboldi et al., 2016]. On the other hand, an offline SN is characterized by the absence of online communications to mediate the relationship between users. Also, it is built to represent social relationships in order to allow the study of structural and semantic properties.
6
2.1. Main Definitions 17
Table 2.1: Topological properties and concepts on social networks: Given a graph
G(V,E)with a set of nodes V and edges E, in whichi and j are nodes in V.
Property Definition Examples of application
Degree (ki) ki = P
j∈V∧i6=j
edge(i, j), in which
edge(i, j) is 1 when there is an edge connectingitojand 0, otherwise.
Performing decentralized search in networks [Wu et al., 2011].
Path length(lG(i, j)) lG(i, j) = P i6=j
distance(i, j), in which
distance(i, j)= 0 ifjcannot be reached byi.
Improving collaboration recom-mendations quality [Brandão et al., 2013; Lopes et al., 2010].
Density (DG) DG = P otential EdgesActual Edges , where
P otential Edge=|V|(|V|−2 1).
Evaluating knowledge-sharing in social networks [Wiemken et al., 2012], assessing quality of gradu-ate programs [Lopes et al., 2011] and studying communities struc-tures [Newman, 2003].
Community, group or cluster
Subsets of nodes in which the connec-tions among nodes intra communities are dense, but between different com-munities are less dense.
Interpreting social mobility within the United States [Melamed, 2015], investigating the time dependence and evolution of overlapping com-munities [Palla et al., 2007] and assessing researchers’ productivity [Silva et al., 2015a].
Modularity (QG) QG=41mP ij
(Aij− kikj
2m)sisj, wherem
is the total number of edges in the net-work,Aijis the total of edges between
iandj, andki (kj) is degree of nodei
(j). For a dividion of the network into two groups, let si = 1 if i belongs to
group 1 and si = −1 if it belongs to
group 2.
Determining if there are subgroups that should be connected or ad-dressed separately in a research project [Valente et al., 2015].
Common neighbors score(i, j) = Γ(i)∩Γ(j), in whichΓ(i)
(Γ(j)) is the set of neighboors ofi(j).
Being one of predictors to link pre-diction model [Liben-Nowell and Kleinberg, 2007] and a feature to a community detection algorithm [Xu et al., 2007].
Betweenness (BC(i)) BC(i) = P
i6=j∈N
δi(j), where δi(j) = P
w:j∈pred(i,w)
δij
δiw(1 +δi(w)), pred(i, w)
is the set of predecessors of w in the shortest paths from i to w, δij is the
number of shortest path betweeniand
j and δi(w) is the number of shortest
path throughw.
Defining a new algorithm to detect communities [Girvan and Newman, 2002] and identifying central schol-ars in database communities [Elma-cioglu and Lee, 2005].
Random networks It is built based on an original network. Thus, a random network has the same number of nodes, edges and empirical degree distribution as the original net-work. The difference between them is the way that the nodes are connected to each other.
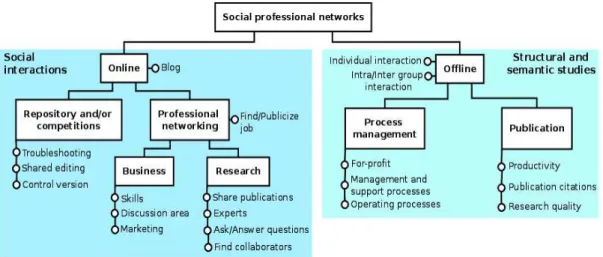
Figure 2.4: Hierarchical diagram of social professional networks types.
Figure 2.3 shows examples of real social networks. Specifically, we have classified them as professional or general, with an intersection representing mixed purposes. For example, Meetup7 can be used to set up meetings to discuss research or to schedule a
school class reunion. Our classification considers the original goal with which a social network was developed. For instance, Flickr has two main goals that are to make photos and videos available and to provide ways for organizing them. This kind of network can be used by non-professionals and professionals (as photographers). Thus, Flickr is not specifically aimed at professionals as LinkedIn. Overall, our focus is social professional networks, and we present examples of general networks only to account for their existence.
Finally, Table 2.1 describes concepts related to social networks that are used throughout this thesis. Note that degree, path length, density, modularity, common neighbors and betweenness represent topological properties from social networks. Thus, they can be computed in different kinds of social networks. Communities and random networks are also concepts related to the network topology. However, there are al-gorithms to detect communities that also consider semantic properties (theoretical characteristics related to the nodes and edges, for example, geographic location). Such aspects depend on the information available in the social networks.
2.1.2
Social Professional Networks Types
Social professional networks serve different purposes including sharing code and papers, solving doubts, etc. Given their similarities, Figure 2.4 presents the main types of social professional networks organized hierarchically and their main features: the rectangles
7
2.1. Main Definitions 19
describe the main goal of each network type, and each small circle represents networks’ features. For instance, blog is a functionality of all SPN, andfind/publicize job is one feature of networks aiming at professional networking. Next, we summarize the SPN types and their features.
Repository and/or competition. This kind of network allows to share code, files
and datasets, discuss solutions, discover trends on industry problems, access resources and tools, and/or participate in competitions. Examples include GitHub, Kaggle8,
SourceForge9, E.Factor10 and GrabCAD11. Regarding research on the topic, Dabbish
et al. [2012] study how individuals interpret and use information about other users’ actions on code in GitHub. Likewise, Thung et al. [2013] use GitHub to explore the relationship between developers and projects, whereas Bartusiak et al. [2016] predict developers collaboration in the same network. Finally, Narayanan et al. [2011] describe a solution to link prediction problem on Flickr that resulted from a competition in Kaggle social network [Narayanan et al., 2011].
Professional networking. Designed for business or research purposes, its main goal is to provide a platform for professional networking and interaction. Examples are Classemates12, LinkedIn13, ResearchGate14, StartupNation15 and AngelList.
Regard-ing research, Skeels and Grudin [2009] investigate if such sites enhance productivity, are useful for enterprises and cause issues for new user populations (e.g. stresses from combining personal and professional people). Also, Russell [2013] describes how to crawl LinkedIn data and suggests types of analyses including a histogram of compa-nies in which the contacts have already worked, counting job titles for the technology industry, etc. Moreover, Yu et al. [2016a] evaluate ResearchGate metrics that are used to quantify the performance of researchers and institutions.
Process management. It is a type of offline SN in which the nodes can be com-panies, employees, sellers, suppliers, customers and/or other business entities that are connected by business relationships. These networks main purpose is usually analyz-ing interfirm relationships role within a marketanalyz-ing perspective [Heide and Wathne, 2006]. Additionally, Burt [2010] uses industry networks to analyze theories at micro (individuals or small groups) and macro (collective) levels.
Publication. They represent relationships among academic entities such as publi-cations, authors, specialists, advisor/advisee and so on. As the others, the academic networks have been largely studied. Examples are co-authorship, citation, advisorship and teachers’ professional interactions social networks. Focusing on research, Fu et al. [2014] define different metrics to rank authors, publication venues and institutions. Silva et al. [2015b] consider different properties to analyze researchers’ behavior and their publication dynamics in different venues classes. Lee [2015] investigates the multidisciplinary characteristics of technology management research through journal citation network analysis. Brandão et al. [2013] and Lopes et al. [2010] recommend potential collaborators to researchers.
Overall, SN have improved professional activities as job search, contact making, networking, productivity evaluations, etc. Such improvements are clear by the number of existing social professional networks and the large volume of users, data and inter-actions. Hence, studying such networks has the potential to improve even further their reach and benefits. Moreover, having so many networks requires a proper classification in order to compare them, leading to our proposed taxonomy next.
2.2
General Taxonomy for Social Networks
We propose a taxonomy based on the tasks and issues of social networks. By analyzing the publications on the area, we have identified two main tasks (analysis and appli-cation) and two main issues (data acquisition and preparation, and data storage), as illustrated in Figure 2.5 and detailed next.
Data acquisition and preparation. The focus is obtaining the data from social
networks or other sources. Current approaches include data from social networks web-sites [Chau et al., 2007; Gjoka et al., 2011b; Rezvanian and Meybodi, 2015; Russell, 2013], digital libraries [Carpineto and Romano, 2012; Huynh et al., 2012; Zhuang et al., 2005] and the web [Harth et al., 2006; Vural et al., 2014] (i.e., researchers use data from digital libraries and the web to build the structure of social networks).
2.2. General Taxonomy for Social Networks 21
Figure 2.5: Main social networks topics: the tasks refer to using social networks to solve problems, and the issues address problems related to managing social networks.
find a suitable, useful, meaningful and valid organization of nodes and edges. Here, we focus on graph clustering, because entities represented by a social network tend to form clusters, and the number of existing clustering algorithms as well as applications is high. We further describe them considering the SPN context in Section 2.3.
Data storage. Social networks require storing and accessing their data. Specifically for data storage, there are plenty of approaches on how to efficiently store data for different purposes. As examples, Garcia-Molina et al. [2000] extensively discuss types of data storage, Corbellini et al. [2017] and Han et al. [2011] describe the background, basic characteristics and data model of NoSQL databases, and Cellary et al. [2014] focus on concurrency control in distributed database systems. Furthermore, there are studies addressing how to deal with the large volume of data that comes from social networks [Almeida, 2013; Yu et al., 2017].
Figure 2.6: Relationship among clustering, recommendation and ranking algorithms.
[Easley and Kleinberg, 2010; Guille et al., 2013; Kadushin, 2012; Scott and Carrington, 2011; Wasserman, 1994]. Tie strength studies are also categorized as this kind of task [Alves et al., 2016; Brandão and Moro, 2015; Brandão et al., 2016; Castilho et al., 2017; Gupte and Eliassi-Rad, 2012; Wiese et al., 2015; Vaz de Melo et al., 2015]. Moreover, we emphasize that clustering algorithms also serve for social network analysis and further discuss them in Section 2.3.
Application. The goal is to use SN to develop methods, features and programs to benefit users. The main types of SN applications include marketing, visualization, recommendation and ranking. Note that marketing [Kempe et al., 2003; Subbian et al., 2017; Trusov et al., 2009] and visualization [Giridhar et al., 2017; Guerra-Gomez et al., 2016; Murray, 2013; de Sousa et al., 2015] may motivate SN analysis or be an application. Therefore, in this chapter, we focus on recommendation (Section 2.4) and ranking (Section 2.5) strategies in social professional network context. Both applications have motivated competitions such as Netflix Prize, CAMRA, the Yahoo! Music KDD Cup 2011 and Kaggle’s competitions.
Overall, solutions applied to the first two issues (data acquisition/preparation and data storage) may be adapted to the SN context as they are not exclusive for social professional networks. The same cannot be said about the two tasks (analysis and application), which we study specifically in the context of social professional networks. Hence, our research focuses on the latter (i.e., the tasks), and the next sections cover research topics related to clustering, recommendation and ranking algorithms.
2.3. Clustering 23
Figure 2.7: Stages of clustering, recommendation and ranking in social network, based on Jain et al. [1999].
2.3
Clustering
Most things in nature and society can be separated into groups according to similarities and properties. A key question is how to group different things in specific contexts. Specially in Computer Science, this question may be rewritten as how to automatically cluster data by using a computer. This task is called clustering, whose main goal is to find a useful and valid organization of the input data. There are many algorithms for clustering data. Here, we focus on those that aim to cluster nodes and edges in a graph (i.e., are easily applied to SN).
Clustering techniques have been largely used to detect communities in social net-works [Ahmed et al., 2016; Fortunato, 2010; Fortunato and Hric, 2016; Girvan and Newman, 2002; Palla et al., 2005; Tabarzad and Hamzeh, 2017; Xie et al., 2013]. De-tecting communities is a task in social networks as it allows the analysis of the interac-tions and relatedness among users. According to Lancichinetti et al. [2009], nodes in a community are more connected to each other than to the remain of the social network. Note that in the social network context, clusters are also called as community [Girvan and Newman, 2002]. Therefore, we use both terms interchangeably to maintain the nomenclature of the clustering algorithms’ authors.
Figure 2.7 presents the stages of clustering in social networks that may also be applied to recommendation and ranking. The following sections detail each level for clustering by discussing existing works.
2.3.1
Nodes and Edges Patterns
This section overviews concepts necessary for understanding clustering techniques. In a graph, nodes and edges of social networks can be clustered for different purposes and by considering different characteristics. We detail and exemplify works divided into three categories as follows.
Spatial patterns. Here, nodes and edges compose clusters according to geographic
di-rectional lanes (a property of edge direction) to present visualizations of clusters in a graph. Such clusters represent the amount of GitHub follower data in cities of the United States. Wal et al. [2009] use SN analysis to study inter-firm networks in clusters, regional innovations system and agglomeration economies. Sorenson [2005] also con-siders SN concepts to investigate how industries in concentrated regions might increase their production. Finally, for the three approaches, the nodes/edges spatial patterns define clusters based on their common geographic regions.
Collaborative interactions. The relationship between nodes is collaborative when
they interact to reach a common goal or do a task in an intellectual endeavor. In this context, the main goal of clustering is to group individuals that collaborate. For instance, [Newman, 2001b] analyzes co-authorship SN from biomedical, theoretical physics, high-energy physics and computer science research areas. He shows there is a very strong clustering effect in such scientific communities. Różewski et al. [2015] present a model that combines concepts of knowledge workers to form clusters within an organizational SN. The goal is to increase the competence of knowledge workers’ collaborative learning. Kshitij et al. [2015] study how patterns of collaboration in cancer research impact on research policy in India. Such study considers co-authorship SN built from publications in cancer research. By applying a clustering algorithm, the authors reveal the presence of small clusters of researchers connected to one or more highly central researchers.
Different categories. Clusters can group and categorize different types of entities. For example, given a set of nodes and edges representing people in a university, a cluster can represent the class of either professors, students or staff. Considering such a categorization aspect, Ahmed et al. [2014] propose a clustering algorithm to gather LinkedIn users. The clustering criteria are factors significant to users for building groups in such a network, including: area of expertise, job openings, security and time. Melamed [2015] uses eigenspectrum decomposition for community detection in social mobility data. The author considers six categories based on social class (e.g., employers and employees) as nodes, and there is a weighted relation between them when people change the social category.
2.3.2
Clustering Techniques
2.3. Clustering 25
size fits all” here, as the choice of clustering type highly depends on the problem and the properties of the input data. For example, if the data have category labels and the problem requires a solution considering specific properties of such categories, the extrinsic approach is more suitable. Traditional clustering algorithms include k-means, k-spectral clustering, DBSCAN and clique percolation [Zaki and Meira Jr, 2014]. As each of them clusters the data according to a different set of features, their resulting clusters for the same input may differ significantly. Next, we discuss all six types of clustering techniques and summarize how they have been applied to SPNs.
Exclusive or nonexclusive. An object may belong to exactly one cluster (exclu-sive) or to more than one (nonexclu(exclu-sive). Considering exclusive algorithms, Fortunato [2010] overviews exclusive clustering detection on SN. The author provides an example of the division of a co-authorship social network in disjoint clusters by describing the algorithm proposed by Girvan and Newman [2002] (which uses edge betwenness metric to form clusters). Regarding nonexclusive approaches, Xie et al. [2013] compare 14 overlapping clustering algorithms. Among such algorithms, [Palla et al., 2005] pro-pose one that creates overlapping groups by considering the set of nodes’ statistical features on SN. Then, Palla et al. [2007] use clique percolation to study the time de-pendence of overlapping communities (groups) on a co-authorship social networks then characterizing communities evolution.
Intrinsic or extrinsic. Given a set of objects as input to a clustering algorithm,
a proximity matrix is computed by measuring the distance between them. In such a context, intrinsic is a kind of unsupervised learning based solely on the proximity matrix to perform classification. On the other hand, besides such matrix, extrinsic uses category labels on the objects as well. Regarding intrinsic techniques, Keyes [2015] applies k-means (unsupervised technique) to geographically cluster LinkedIn users and plots the results on Google Maps16 or Google Earth17. Sales-Pardo et al. [2007] also
propose an intrinsic algorithm that forms overlapping clusters by extracting nested hierarchical organization. On the extrinsic perspective, in order to form groups with LinkedIn users, Ahmed et al. [2014] propose a semi-supervised clustering approach that uses partially labeled data. Tang et al. [2007] also use an extrinsic technique to cluster publications into exclusive groups by using characteristics of the publications.
Partitional or hierarchical. A partitional clustering assigns each resulting cluster to a single partition. Then, a hierarchical clustering nests a set of partitions in different levels. Backstrom et al. [2006] study group formation and evolution in co-authorship
16
Google Maps: maps.google.com 17
Figure 2.8: Clustering techniques and their overlaps: E - exclusive, NonE - nonexclu-sive, In - intrinsic, Ex - extrinsic, H - hierarchical and P - partitional.
and conference publications in DBLP. They consider a conference represents a cluster of researchers. There are overlaps among communities and the clusters are partitional. Likewise, Baumes et al. [2005] propose a partitional algorithm that aims to detect overlapping communities based on the clusters density. They experiment in synthetic (random graphs) and real data (DBLP). On the other hand, Ahmed et al. [2014] use hierarchical clustering technique to extract groups from LinkedIn users based on their profiles. Also, Gómez et al. [2015] propose a divisive algorithm based on hierarchical clustering technique for a network of papers and their citations. First, the edges are ordered from the most to the least divisive, then ordered from the most to the least similar. Blondel et al. [2008] propose an algorithm that combines hierarchical technique with modularity optimization to form communities in different networks, including papers and their citations.