Submitted 13 July 2015 Accepted 14 September 2015 Published1 October 2015
Corresponding author
Sarni Mat Junit, [email protected]
Academic editor
Vladimir Uversky
Additional Information and Declarations can be found on page 26
DOI10.7717/peerj.1292
Copyright
2015 Razali et al.
Distributed under
Creative Commons CC-BY 4.0
OPEN ACCESS
Investigation into the e
ff
ects of
antioxidant-rich extract of
Tamarindus
indica
leaf on antioxidant enzyme
activities, oxidative stress and gene
expression profiles in HepG2 cells
Nurhanani Razali, Azlina Abdul Aziz, Chor Yin Lim and Sarni Mat Junit
Department of Molecular Medicine, Faculty of Medicine, University of Malaya, Kuala Lumpur, Malaysia
ABSTRACT
The leaf extract ofTamarindus indicaL. (T. indica) had been reported to possess high phenolic content and showed high antioxidant activities. In this study, the effects of the antioxidant-rich leaf extract of theT. indicaon lipid peroxidation, antioxidant enzyme activities, H2O2-induced ROS production and gene expression patterns
were investigated in liver HepG2 cells. Lipid peroxidation and ROS production were inhibited and the activity of antioxidant enzymes superoxide dismutase, catalase and glutathione peroxidase was enhanced when the cells were treated with the antioxidant-rich leaf extract. cDNA microarray analysis revealed that 207 genes were significantly regulated by at least 1.5-fold(p<0.05)in cells treated with the antioxidant-rich leaf extract. The expression ofKNG1, SERPINC1, SERPIND1, SER-PINE1, FGG, FGA, MVK, DHCR24, CYP24A1,ALDH6A1, EPHX1andLEAP2were amongst the highly regulated. When the significantly regulated genes were analyzed using Ingenuity Pathway Analysis software, “Lipid Metabolism, Small Molecule Biochemistry, Hematological Disease” was the top biological network affected by the leaf extract, with a score of 36. The top predicted canonical pathway affected by the leaf extract was the coagulation system(P<2.80×10⁻⁶)followed by the superpath-way of cholesterol biosynthesis(P<2.17×10⁻⁴), intrinsic prothrombin pathway (P<2.92×10⁻⁴), Immune Protection/Antimicrobial Response(P<2.28×10⁻³) and xenobiotic metabolism signaling(P<2.41×10⁻³). The antioxidant-rich leaf extract ofT. indicaalso altered the expression of proteins that are involved in the Coagulation System and the Intrinsic Prothrombin Activation Pathway (KNG1, SERPINE1, FGG), Superpathway of Cholesterol Biosynthesis (MVK), Immune pro-tection/antimicrobial response (IFNGR1, LEAP2, ANXA3 and MX1) and Xenobiotic Metabolism Signaling (ALDH6A1, ADH6). In conclusion, the antioxidant-rich leaf extract ofT. indicainhibited lipid peroxidation and ROS production, enhanced antioxidant enzyme activities and significantly regulated the expression of genes and proteins involved with consequential impact on the coagulation system, cholesterol biosynthesis, xenobiotic metabolism signaling and antimicrobial response.
Subjects Biochemistry, Food Science and Technology, Genomics, Molecular Biology, Nutrition
INTRODUCTION
Research on the role of nutrients on general well-being and disease prevention has gained momentum in recent years. Amongst the nutrients studied, natural sources from plants have been gaining notable attention. Plants and herbs have been widely consumed in many populations of the world mainly as food and for various medicinal benefits. Amongst the multitude of bioactive compounds found in plants and herbs, phenolic compounds that are secondary metabolites, have been widely reported as potent antioxidants (Covas et al., 2006;Thangapazham, Passi & Maheshwari, 2007;Singh et al., 2008). Numerous findings support the role of phenolics in the prevention of oxidative damage-related diseases including cancers (Le Marchand, 2002), cardiovascular diseases (CVD) (Reaven et al., 1993), osteoporosis and neurodegenerative diseases (Halliwell, 1994).
Tamarindus indicaL. (T. indica) of which the fruit pulp is widely used as an acidic flavor in cooking, is one of the plants with reported therapeutic properties.T. indicabelongs to the family of Leguminosae and grows naturally in many tropical and sub-tropical regions. Our group had recently reported that the methanol seed, leaf, leaf veins, fruit pulp and skin extracts ofT. indica possessed high phenolic content and antioxidant activities (Razali et al., 2012). Amongst these extracts, the methanol leaf extract showed the highest antioxidant activities. The leaves are traditionally used to treat various ailments including cough, worm infection, rheumatism, jaundice and ulcer (Sreelekha et al., 1993). The methanol leaf extract ofT. indicahas been shown to have antibacterial (Muthu, Nandakumar & Rao, 2005;Mel´endez & Capriles, 2006), antimalarial (Asase et al., 2005), antimicrobial (Escalona-Arranz et al., 2014), antiviral (El Siddig, Ebert & Luedders, 1999), anticancer (Saleem, 2009), anti-inflammatory (Bhadoriya et al., 2011), hepatoprotective and antioxidant (Sudhahar et al., 2007) activities as well as inhibitory effects on tyrosine phosphatase 1B (Na et al., 2009). The presence of lupanone and lupeol (Imam et al., 2007), catechin, epicatechin, quercetin and isorhamnetin (Razali et al., 2012) in the leaf extract could have contributed towards the diverse range of the medicinal activities. A recent study reported that the leaf extract ofT. indicaprotected the red blood cells by attenuating H2O2-induced membrane damage and also inhibiting intracellular ROS production
(Escalona-Arranz et al., 2014). Molecular evidence to support the beneficial effects of the leaf extract is however, still lacking.
MATERIALS AND METHODS
Chemicals
All reagents used in the experiments were of analytical grade and obtained mostly from Fluka and Sigma. Solvents used for extraction of plant samples were purchased from Fisher Scientific. The phenolic standards were obtained from Sigma. Water used was of Millipore quality. The human hepatoma, HepG2 cell lines were purchased from ATCC, USA. The growth medium, serum and antibiotics for the cell culture experiments were purchased from Flowlab, Australia.
Preparation of the methanol leaf extract ofT. indica
The leaves ofT. indicawere collected from Kedah in the northern region of Malaysia and were processed within a day of harvesting. The plant was deposited in the Rimba Ilmu Herbarium, University of Malaya with a voucher specimen of KLU 45976. The methanol leaf extract ofT. indicawas prepared as previously described (Razali et al., 2012). Briefly, the dried powdered samples were extracted with methanol at room temperature for 24 h with a mass to volume ratio of 1:20 (g/mL). The extracts were evaporated to dryness on the rotary evaporator at 37◦C and the residues were re-dissolved in 10% DMSO. Extracts were kept at−20◦C until further analyses.
Cell culture
The human liver cells line, HepG2 (ATCC, Manassas, VA, USA) were grown in Dulbecco’s modified Eagle’s medium (DMEM) supplemented with 10% foetal bovine serum (Flowlab, Australia), 1% penicillin (Flowlab, Sydney, Australia) and 1% streptomycin (Flowlab, Sydney, Australia). Cells were maintained in humidified air with 5% CO2at 37◦C.
Cell viability analysis using the MTT assay
Cell viability assay was carried out using 3-(4,5-dimethylthiazol-2-yl)-2,5-diphenyltetrazolium bromide (MTT) as described byMosmann (1983), with minor modifications (Denizot & Lang, 1986;Hansen, Nielsen & Berg, 1989). Briefly, HepG2 cells at a density of 5,000 cells per well were seeded in a 96-well ELISA microplate. The cells were incubated at 37◦C in 5% CO2for 24 h. After 24 h, the plant extracts,
at various concentrations (0–600µg/ml) were added into the wells and the cells were
further incubated for 48 h. After 48 h, MTT reagent (Merck, Kenilworth, New Jersey, USA) was added and the mixture was incubated for 4 h. Then, the mixtures in each well were removed and formazan crystals formed were dissolved in 75% isopropanol. Spectrophotometry measurement of the mixture was performed using a microplate-reader (Bio-Rad, Hercules, California, USA) at wavelengths of 570 and 620 nm. A log plot of cell viability (%) against the concentrations of plant extracts was constructed. From the plot, a near non-toxic concentration(IC20)of the extracts was calculated and used for the
Evaluation of lipid peroxidation and antioxidant enzyme activities
HepG2 cells were seeded and pre-treated with the IC20concentration of the plant extracts.
Following the pre-treatment with the extracts, HepG2 cells were exposed to oxidative stress condition by induction with 1 mM of H2O2for 2 h. After 24 h, the cells were subsequently
washed with ice-cold PBS and detached using a scraper. Cells were then collected into a microtube and centrifuged for 10 min at 8,000×g at 4◦C. The supernatant was discarded and the cell pellets were lyzed in Tris–HCl buffer (25 mM, pH 7.4). The lyzed cells were then sonicated for 5 min at 60% amplitude. Protein content of each sample was quantified using Bradford assay, employing bovine serum albumin (BSA) as the standard (Ausubel et al., 1999). Hundredµg/ml of protein was used in the lipid peroxidation and antioxidant
enzyme assays.
Inhibition of lipid peroxidation
Levels of lipid peroxidation in the treated cells were determined by measuring the production of malondialdehyde (MDA) in the presence of thiobarbituric acid (TBA) (Inal, Kanbak & Sunal, 2001). The TBA reagent used in this assay consisted of a mixture of TBA, trichloroacetic acid (TCA) and 70% perchloric acid(HClO4)in distilled water.
Tetraethoxypropane (TEP) in ethanol was used as the standard. Briefly, 0.5 ml of TBA reagent was added to 0.1 ml sample or standard and boiled for 20 min. The mixture was left to cool and was centrifuged for 10 min at 960×g at 25◦C. The supernatant was pipetted into a 96-well plate and absorbance was measured at 532 nm on a microplate reader. All experiments were done in triplicate. The amounts of MDA in the treated and untreated samples were determined using the equation obtained from the standard curve of TEP. Results were expressed as nmol MDA/mg of protein (Awah & Verla, 2010).
Measurement of HNE-protein adduct
The abundance of 4-hydroxynonenal (4-HNE) protein adducts in both untreated and leaf-treated cells were measured using ELISA kits purchased from Shanghai Qayee, China. Supernatants were collected from the samples and the abundance of protein was detected against 4-HNE (QY-E05206) according to the manufacturer’s protocols. Briefly, 10µl of samples were pipetted into a pre-coated ELISA microplate. The 4-HNE-protein
adducts content was probed with an anti HNE-His antibody and was measured by an HRP-conjugated secondary antibody for detection. The plate was washed to remove unbound substances and the end product was measured at 450 nm. A known HNE-BSA standard curve was constructed to determine the concentration of 4-HNE protein adducts present in the samples.
Antioxidant enzyme activities
activities were expressed as Unit/ml where one unit is defined as the amount of enzyme needed to exhibit 50% dismutation of the superoxide radicals.
CAT assay measures the reaction of the enzyme in the presence of an optimal concentration of H2O2. The reaction produced formaldehyde, which was measured
colorimetrically with 4-amino-3-hydrazino-5-mercapto-1,2,4-triazole (Purpald) as the chromogen. Purpald specifically forms a bicyclic heterocycle with aldehydes, which upon oxidation changes from colorless to purple. Formaldehyde concentration in the cells was measured using equation obtained from the linear regression of the standard curve. CAT activities in the samples were expressed in nmol H2O2oxidized/min/ml of protein.
GPx activity was measured through a coupled reaction with glutathione reductase whereby GPx catalyzes the reduction of hydroperoxides, including H2O2by reduced
glutathione. GPx activities in the cells were initially calculated by determining the changes in absorbance per minute obtained from the standard curve. One unit of activity is defined as the amount of enzyme that caused the oxidation of 1.0 nmol of NADPH to NADP+
per minute.
Assay for reactive oxygen species (ROS)
ROS production was assessed using the method ofWang & Joseph (1999)with minor modifications. HepG2 cells were plated into black 96-well plates, seeded and treated as previously described. At the end of the treatment, the medium was removed and the cells were washed with PBS and then incubated with 100 mM dichlorofluorescein diacetate (DCF-DA) in PBS for 30 min at 37◦
C. The formation of the fluorescent-oxidized derivative of DCF-DA was monitored at emission wavelength of 530 nm and excitation wavelength of 485 nm in a fluorescence multi-detection reader (Synergy HTTM Multi-detection microplate reader; BioTek Instruments Inc., Vermont, USA). ROS production was expressed as unit of fluorescence (UF) produced by DCF-DA/mg of total protein (UF×104/mg of proteins) (Marabini et al., 2006).
Gene expression analyses in HepG2 cells treated with the methanol leaf extract ofT. indica
HepG2 cells were seeded at a density of 3.0×10⁶in a 25 cm2flask. The cells were then treated with an IC20concentration of the methanol leaf extract ofT. indicafor 24 h.
cellular RNA integrity calculated using RIN software algorithm, follows a scale of 1 to 10, with 1 being the most degraded profile and 10 being the most intact (Schroeder et al., 2006).
cDNA microarray analysis
Gene expression analysis was performed on the Affymetrix Human Gene 1.0 S.T (sense target) arrays according to the Affymetrix eukaryotic RNA labelling protocol (Affymetrix, Santa Clara, California, USA). Briefly, the tcRNA (100 ng) extracted from the untreated and theT. indicaleaf-treated HepG2 cells was first converted to single-stranded sense strand DNA (cDNA) in two cycles using the whole transcript (WT) cDNA synthesis, am-plification kit and sample clean-up module. The sense strand DNA was then fragmented, biotinylated and hybridized to the Affymetrix Human Gene 1.0 S.T array at 45◦
C for 16 h in hybridization Oven 640. After hybridization, the arrays were stained and then washed in the Affymetrix Fluidics Station 450 under standard conditions. The stained arrays were then scanned at 532 nm using an Affymetrix GeneChip Scanner 3000, and CEL files for each array were generated using the Affymetrix Gene-Chip Operating Software (GCOS).
Microarray data normalization and analyses
Partek Genomic Suite software was used to convert the CEL files into text files, thus listing all the up-regulated and down-regulated genes in response to the treatment. The gene set annotation was verified using Netaffx Analysis Center software. The gene sets were then subjected to a one-way analysis of variance (ANOVA) in the Partek Genomic software to determine significantly expressed sets of genes, which was set according to Pvalue less than 0.05(P<0.05). Significantly expressed genes were then re-filtered to include only those with fold change difference of equal to or greater than 1.5. Following the filtration of the genes list, those significant genes were subjected to Gene Ontology (GO) Enrichment tool in the Partek Genomic Suite Software for additional information and further classification on the biological functions of the genes and the genes products. Information on function of genes can be derived from the Gene Ontology database, which provides a structured annotation of genes with respect to molecular function, biological process and cellular component. Further information on GO could be retrieved from http://www.geneontology.org/. All or some selected high significantly expressed genes were then clustered and grouped in hierarchical clustering using Genesis software (Sturn, Quackenbush & Trajanoski, 2002).
Pathway interactions and biological process analyses
on the protein input were generated algorithmically by utilizing the information contained in the Ingenuity Knowledge Base. Right-tailed Fischer’s exact test was used to calculate ap value indicating the probability that each biological function assigned to the network is due to chance alone.
Validation of the microarray data using real-time RT–PCR (qRT-PCR)
Reverse transcription of tcRNA (1,000 ng) into complementary DNA (cDNA) was performed using a High Capacity RNA-to-cDNA Master Mix (Applied Biosystems, Carlsbad, California, USA) following the manufacturer’s instructions. The reaction mixture consisted of 1,000 ng tcRNA and 1 X Master Mix which contained magnesium chloride(MgCl2), deoxyribonucleotide triphosphate (dNTPs), recombinant RNase
inhibitor protein, reverse transcriptase, random primers, oligo(dT) primer and stabilizers, was prepared in a final volume of 20µl. The reaction mixture was placed in a thermal cycler
with the following parameters: 25◦
C for 5 min, 42◦
C for 30 min and 85◦
C for 5 min. The cDNA was kept at−80◦C until further analysis.
Primer pairs for selected up-regulated and down-regulated genes as well as a housekeeping gene,GADPH, are listed inTable S1. PCR amplification was performed in 0.2 ml MicroAmp®Optical 8-tube strips in a final volume of 20µl, consisted of 10µl of 2X
Fast SYBR®Green Master Mix (Applied Biosystem, Carlsbad, Calfornia, USA) containing a mixture of SYBR®Green I dye, AmpliTaq®Fast DNA Polymerase, UP (Ultra-Pure), Uracil-DNA Glycosylase (UDG), ROXTM Passive Reference dye, dNTPs and optimized buffer components, reverse and forward primers (200 nm) and cDNA (20 ng). qRT-PCR was performed with a PCR parameters consisted of 20 s ofTaqDNA Polymerase activation at 95◦C, followed by 40 cycles of denaturation at 95◦C for 3 s, primer annealing at 60◦C for 30 s. The melting curves of the real-time PCR products were analyzed from 65◦C to 95◦C. Each measurement was carried out in triplicate. Differences in gene expression, expressed as fold-change, were calculated using the 2−ΔΔCtmethod whereGAPDHwas used as the reference gene.
Detection of altered protein expression in HepG2 cells treated with the methanol leaf extract ofT. indica
Ten proteins, IFNGR1, LEAP2, SERPINE1, MX1, KNG1, MVK, FGG ANXA3, ALDH6A1 and ADH6 of which the encoding genes were aberrantly expressed in theT. indica leaf-treated cells were selected for ELISA analyses. The HepG2 cells(3×10⁶)were seeded and treated with an IC20concentration of the methanol leaf extract ofT. indicafor 24 h.
Biotech, Wuhan, China. Standard curves were constructed to determine the concentration of proteins present in the samples. All analyses were done in triplicate.
Verification of the ELISA data
To verify the ELISA results, the presence of two proteins, IFNGR1 and SERPINE1, was further assessed using Western blotting. HepG2 cells were seeded and treated as earlier described for ELISA analysis. Proteins were then extracted from cells in modified radio immunoprecipitation assay (RIPA) buffer. Briefly, the cells were washed with ice-cold PBS, trypsinized and lyzed with sufficient amount of ice-cold RIPA buffer (150 mM sodium chloride, 1% Triton X-100, 0.5% sodium deoxycholate, 0.1% sodium dodecylsulphate and 50 mM Tris–HCl at pH 8.0) containing 1% protease and phosphatase inhibitors.
Total cell lysate proteins were quantified using bicinchoninic acid (BCA) protein assay kit (Thermo Scientific, Waltham, Massachusetts, USA). Fortyµg of the extracted proteins
were separated on a 12% sodium dodecyl sulfate (SDS) polyacrylamide gel and transferred onto polyvinylidene difluoride (PVDF) membranes with 0.45µm pore size (Bio-Rad,
CA, USA) at a constant voltage of 100 V, 350 mA for 1 h at 4◦
C in a mini electrophoretic blotting system (CBS Scientific, San Diego, California, USA). The blot was then blocked overnight and developed against anti-interferon gamma receptor 1, IFNGR1 (ab61179, Abcam, UK), anti-serpin peptidase inhibitor, clade E, member 1, SERPINE1 (ab66705, Abcam, UK) using the WesternDot 625 Goat Anti-Rabbit Western Blot kit (Invitrogen, Waltham, Massachusetts, USA). Anti-β-actin and Biotin-XX-Goat were used as the reference and secondary antibody, respectively. The membranes were first incubated with biotin-XX-Goat anti-rabbit for 1 h and then washed thrice with 1X washing buffer. Following this, the membranes were incubated with Qdot 625 streptavidin nanocrystal for 1 h and after the final washing step with deionized water, the fluorescence signal was visualized at 300 nm using a gel doc system (Gel-doc 1000/2000 system; Bio-Rad, Hercules, California, USA). The image was digitally captured, densitometrically scanned, quantified and analyzed using ImageJ Software (National Institutes of Health, Bethesda, Maryland, USA). At least three independent Western blots were quantified for each experiment.
Statistical analyses
All analyses were done in triplicate. Results were expressed as means±standard deviation. The data were statistically analyzed using the SPSS statistical software for Windows, Version 21.0. (IBM Corporation, Armonk, New York, USA). An independent t-test was used for comparisons of means between groups. One-way analysis of variance (ANOVA) and Tukey’s Honestly Significant Difference test were used to compare means among groups. The level of significance was set atp<0.05.
RESULTS
Cell viability assay
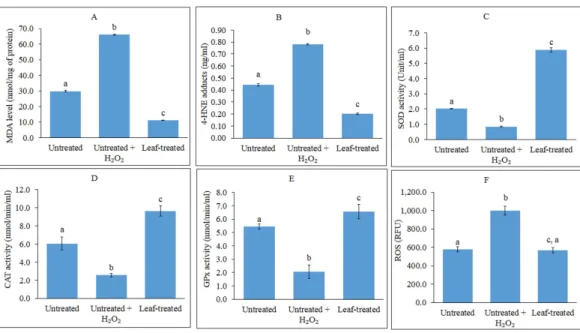
Figure 1 Analyses of lipid peroxidation, antioxidant enzymes and ROS.(A–F): Analyses of lipid peroxi-dation, antioxidant enzymes and reactive oxygen species (ROS) in untreated, untreated+H2O2-induced
and leaf-pre-treated+H2O2-induced HepG2 cells. (A–B) The effects of the leaf extract on lipid
peroxi-dation, measured as MDA levels (A) and 4-HNE protein adduct level (B) in HepG2 cells. Results for MDA levels were expressed as nmol MDA equivalents/mg of protein while 4-HNE levels were expressed as nmol 4-HNE adduct/mg of protein. MDA-malondialdehyde; 4-HNE-4-hydroxynonenal (C–E) Superoxide dismutase (C), catalase (D) and glutathione peroxidase (E) activities were determined using commercial assay kits (Cayman Chemicals). (F) ROS production in HepG2 cells was measured using fluorescence multi-detection microplate reader and the results were expressed as Relative Fluorescence Unit (RFU). Values with different lower case letters are significantly different(p<0.05).
cell viability by 50%(IC50)was found to be 93.33µg/ml. The highest concentration tested,
600.00µg/ml, reduced cell viability to 2.3%. The HepG2 cells showed more than 80%
via-bility(IC20)in response to 24.55µg/ml of the extract. The IC20concentration was
subse-quently used to treat the cells for the antioxidant and microarray gene expression analyses.
Evaluation of lipid peroxidation, antioxidant enzyme activities and ROS production in HepG2 cells treated with the methanol leaf extract ofT. indica
Lipid peroxidation
The effects of the methanol leaf extract ofT. indicain preventing lipid peroxidation in HepG2 cells were investigated. As shown inFig. 1A, induction of oxidative stress by H2O2
in the untreated HepG2 cells caused the MDA levels to increase up to 3-fold higher than the untreated control cells. A significant reduction in MDA levels was observed in pre-treated cells subjected to induction of oxidative stress. ELISA analysis showed that H2O2-induced
HepG2 cells displayed approximately 2-fold increase in levels of 4-HNE compared to untreated and uninduced cells (Fig. 1B). Pre-treatment of the cells with the leaf extract led to reduction of 4-HNE levels lower than the untreated, H2O2-induced cells, and even lower
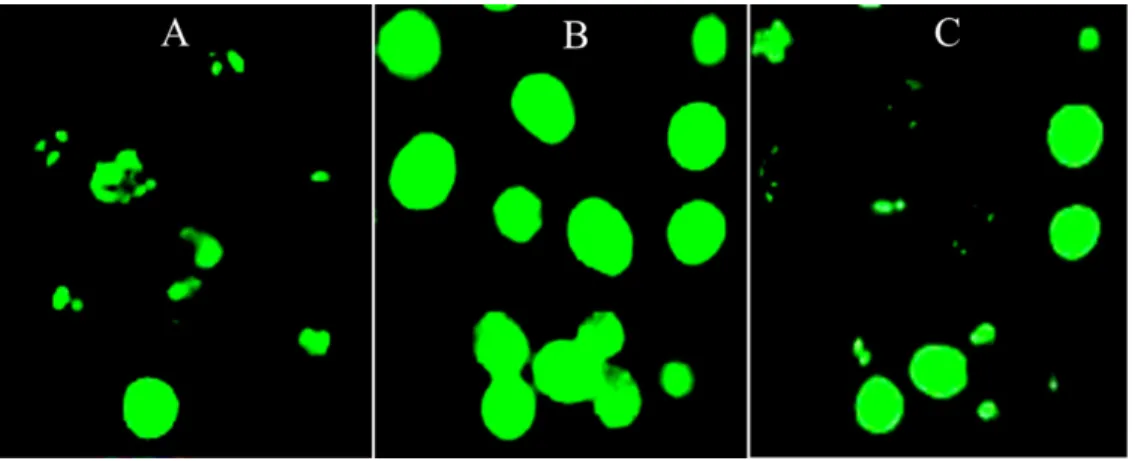
Figure 2 Image-based ROS measurement captured by fluorescence microscopy.(A–C) Image-based ROS measurement captured by fluorescence microscopy in HepG2 cells; (A) Untreated and unchallenged HepG2, (B) Untreated and H2O2-challenged HepG2 and (C) Leaf-pre-treated and H2O2-challenged
HepG2.
Antioxidant enzyme activities
The ability of the methanol leaf extract of T.indicato influence antioxidant enzyme activities were investigated by treating HepG2 cells with the IC20concentration of the
plant extract. As shown inFigs. 1C–1E, the induction of HepG2 cells with H2O2decreased
the activities of SOD, CAT and GPx. However, all the antioxidant enzyme activities were significantly enhanced in the cells following pre-treatment with the leaf extract as compared to the untreated and untreated, H2O2-induced cells.
Assessment of ROS production in HepG2 cells
The effect of the methanol leaf extract ofT. indicaon ROS production was evaluated in HepG2 cells using a cell permeable probe, DCF-DA. The fluorescent intensity is proportional to the amount of peroxides, which are produced by the cells. The higher the ROS amount, the higher the fluorescent intensity. In the present study, DCF-DA staining was applied to examine whether the leaf extract was able to inhibit ROS production in H2O2-induced HepG2 cells. The ROS activity was expressed as Relative Fluorescence Unit
(RFU) (Fig. 1F).
Image-based ROS measurement captured by fluorescence microscopy
ROS production increased significantly after HepG2 cells were challenged with 1 mM H2O2 as compared with the untreated and unchallenged cells (Fig. 1F). However,
pre-treatment of the cells with IC20concentration of the leaf extract significantly decreased
H2O2-mediated ROS formation, whereby intensity of the fluorescence was reduced to
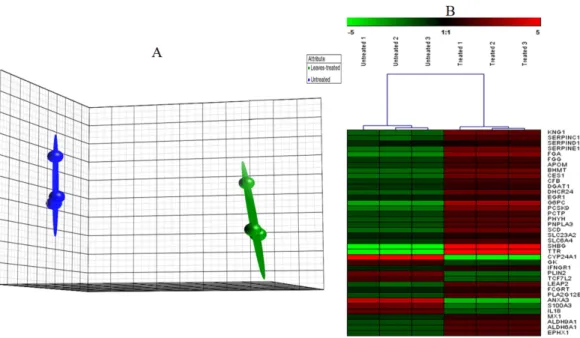
Figure 3 PCA plot.(A) A Principal Component Analysis (PCA) plot generated using Partek software of HepG2 cells grown in the presence or absence of the methanol leaf extract ofT. indica. (Data are clustered based on three biological replicates(n=3)of control and treated samples. Arrays for the untreated group are in blue and those for the treated group are in green. Each ball represents a sample. (B) Hierarchical clustering of highly significantly expressed genes that are associated to different pathways generated by Genesis software. The gene expression was regulated in response to the treatment with leaf extract on HepG2 cells. The regulation pattern was differentiated with 2 colours; green for down regulation and red for up regulation. The clustering was generated using Genesis software.
Gene expression analyses in HepG2 cells treated with the methanol leaf extract ofT. indica
cDNA microarray data analyses
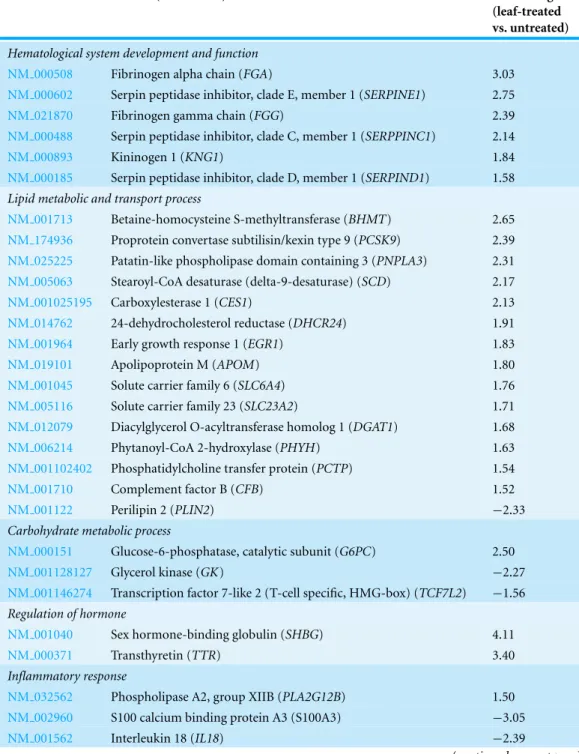
Table 1 A list of highly significant up-regulated and down-regulated genes in HepG2 cells treated with the methanol leaf extract ofT. indicagenerated using GO analyses from Partek Genomics Suite software.The data are presented with details of the GenBank accession number, biological functions, name of the gene and its respective protein and fold change difference between treated and untreated cells. Negative values indicate down-regulation of the genes.
GenBank ID Protein (Gene name) Fold change
(leaf-treated vs. untreated)
Hematological system development and function
NM 000508 Fibrinogen alpha chain (FGA) 3.03
NM 000602 Serpin peptidase inhibitor, clade E, member 1 (SERPINE1) 2.75
NM 021870 Fibrinogen gamma chain (FGG) 2.39
NM 000488 Serpin peptidase inhibitor, clade C, member 1 (SERPPINC1) 2.14
NM 000893 Kininogen 1 (KNG1) 1.84
NM 000185 Serpin peptidase inhibitor, clade D, member 1 (SERPIND1) 1.58 Lipid metabolic and transport process
NM 001713 Betaine-homocysteine S-methyltransferase (BHMT) 2.65
NM 174936 Proprotein convertase subtilisin/kexin type 9 (PCSK9) 2.39
NM 025225 Patatin-like phospholipase domain containing 3 (PNPLA3) 2.31
NM 005063 Stearoyl-CoA desaturase (delta-9-desaturase) (SCD) 2.17
NM 001025195 Carboxylesterase 1 (CES1) 2.13
NM 014762 24-dehydrocholesterol reductase (DHCR24) 1.91
NM 001964 Early growth response 1 (EGR1) 1.83
NM 019101 Apolipoprotein M (APOM) 1.80
NM 001045 Solute carrier family 6 (SLC6A4) 1.76
NM 005116 Solute carrier family 23 (SLC23A2) 1.71
NM 012079 Diacylglycerol O-acyltransferase homolog 1 (DGAT1) 1.68
NM 006214 Phytanoyl-CoA 2-hydroxylase (PHYH) 1.63
NM 001102402 Phosphatidylcholine transfer protein (PCTP) 1.54
NM 001710 Complement factor B (CFB) 1.52
NM 001122 Perilipin 2 (PLIN2) −2.33
Carbohydrate metabolic process
NM 000151 Glucose-6-phosphatase, catalytic subunit (G6PC) 2.50
NM 001128127 Glycerol kinase (GK) −2.27
NM 001146274 Transcription factor 7-like 2 (T-cell specific, HMG-box) (TCF7L2) −1.56 Regulation of hormone
NM 001040 Sex hormone-binding globulin (SHBG) 4.11
NM 000371 Transthyretin (TTR) 3.40
Inflammatory response
NM 032562 Phospholipase A2, group XIIB (PLA2G12B) 1.50
NM 002960 S100 calcium binding protein A3 (S100A3) −3.05
NM 001562 Interleukin 18 (IL18) −2.39
Table 1 (continued)
GenBank ID Protein (Gene name) Fold change
(leaf-treated vs. untreated)
Defense response to virus/bacterium
NM 052971 Liver expressed antimicrobial peptide 2 (LEAP2) 1.96
NM 002462 Myxovirus (influenza virus) resistance 1 (MX1) 1.58
NM 000416 Interferon gamma receptor 1 (IFNGR1) 1.51
NM 005139 Annexin A3 (ANXA3) −3.32
Xenobiotic metabolic process
NM 000120 Epoxide hydrolase 1 (EPHX1) 2.12
NM 005589 Aldehyde dehydrogenase 6 family, member A1 (ALDH6A1) 1.86
NM 000850 Glutathione S-transferase mu 4 (GSTM4) 1.83
NM 000696 Aldehyde dehydrogenase 9 family, member A1 (ALDH9A1) 1.67
NM 001102470 Alcohol dehydrogenase 6 (ADH6) 1.65
NM 000782 Cytochrome P450, family 24, subfamily A, polypeptide 1 (CYP24A1) −4.19
Immune response
NM 004107 Fc fragment of IgG, receptor, transporter (FCGRT) 1.62
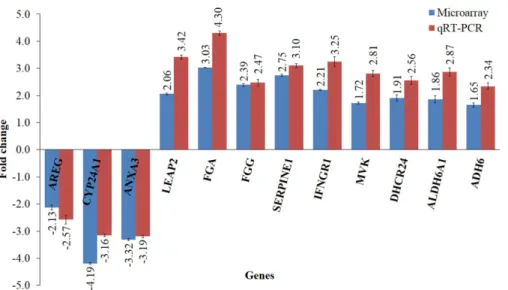
Figure 4 Validation of microarray data using qRT-PCR.The bar chart shows the gene expression patterns (presented as fold change) of selected significantly regulated genes calculated using qRT–PCR and microarray analysis. The down-regulated genes selected wereCYP24A1, ANXA3andAREG, while the up-regulated genes wereLEAP2,FGA,FGG,SERPINE1,IFNGR1, MVK,DHCR24,ALDH6A1and ADH6. All qRT-PCR data were normalized to that ofGAPDH, a housekeeping gene.
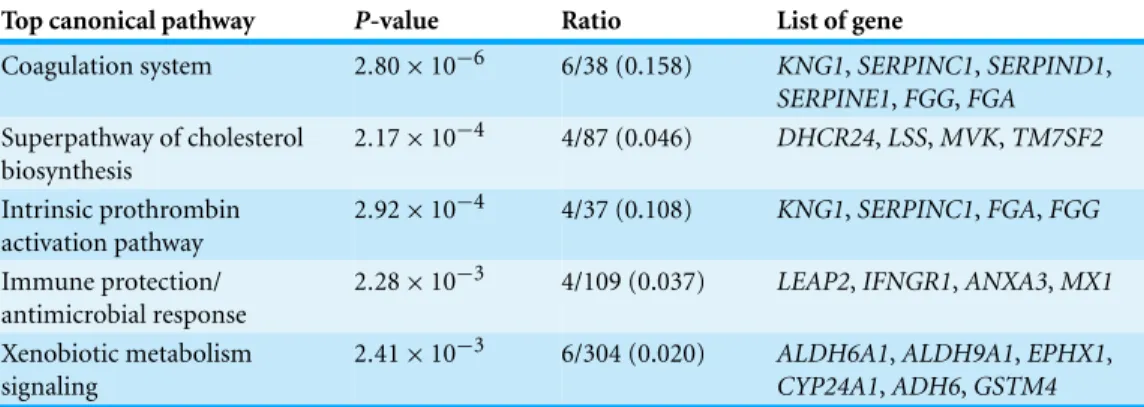
Table 2 IPA analysis.A summary of Ingenuity Pathway Analysis (IPA) showed the top networks and top predicted canonical pathways affected by the altered expression of genes in response to the treatment of the leaf extract in HepG2 cells.
ID Top networks Scorea
1 Lipid metabolism, small molecule biochemistry, hematological disease 36 2 Ophthalmic Disease, Connective Tissue Disorders, Inflammatory Disease 35 3 Digestive System Development and Function, Organ Morphology, Developmental Disorder 32 4 Carbohydrate Metabolism, Small Molecule Biochemistry, Free Radical Scavenging 24 5 Hereditary Disorder, Neurological Disease, Organismal Injury and Abnormalities 24
Top canonical pathway P-value Ratio List of gene
Coagulation system 2.80×10⁻⁶ 6/38 (0.158) KNG1,SERPINC1,SERPIND1, SERPINE1,FGG,FGA Superpathway of cholesterol
biosynthesis
2.17×10⁻⁴ 4/87 (0.046) DHCR24,LSS,MVK,TM7SF2 Intrinsic prothrombin
activation pathway
2.92×10⁻⁴ 4/37 (0.108) KNG1,SERPINC1,FGA,FGG Immune protection/
antimicrobial response
2.28×10⁻³ 4/109 (0.037) LEAP2,IFNGR1,ANXA3,MX1
Xenobiotic metabolism signaling
2.41×10⁻³ 6/304 (0.020) ALDH6A1,ALDH9A1,EPHX1,
CYP24A1,ADH6,GSTM4
Notes.
aA score of 2 or higher indicates at least 99% confidence of not being generated by random chance and higher scores
indicate a greater confidence.
Pathway interactions and biological process analyses of the significantly expressed genes
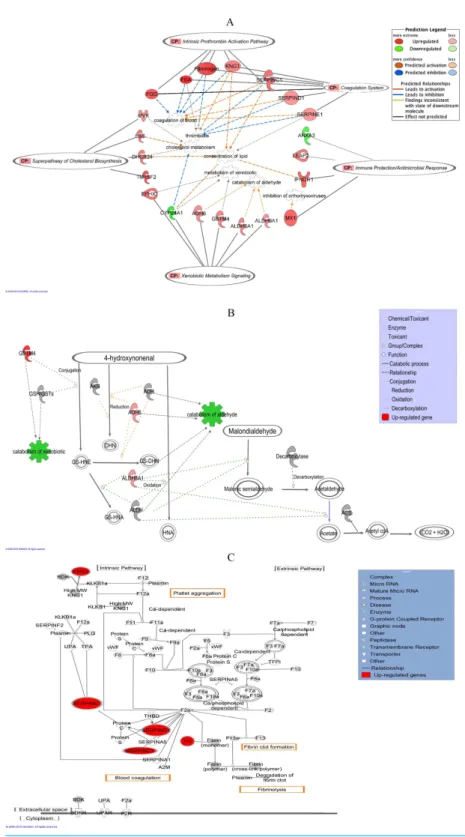
Figure 5 (...continued)
up-regulated genes while those in green represent down-regulated genes. Various shapes of the nodes represent functional class of the proteins. Edges are displayed with various labels that describe the nature of the relationship between the nodes. Name of genes with their corresponding abbreviations are as follows:ADH6, Alcohol dehydrogenase 6;ALDH6A1, Aldehyde dehydrogenase 6 family, member A1; ALDH9A1, Aldehyde dehydrogenase 9 family, member A1;ANXA3, Annexin A3;CYP24A1, Cytochrome P450, family 24, subfamily A, polypeptide 1;DHCR24, 24-dehydrocholesterol reductase;EPHX1, Epox-ide hydrolase 1;FGA, Fibrinogen alpha chain;FGG, Fibrinogen gamma chain;GSTM4, Glutathione S-transferase mu 4;IFNGR1, Interferon gamma receptor 1;KNG1, Kininogen 1;LEAP2, Liver-expressed antimicrobial peptide;LSS, Lanosterol synthase;MVK, Mevalonate kinase;MX1, Myxovirus resistance 1; SERPINC1, Serpin peptidase inhibitor, clade C (antithrombin), member 1;SERPIND1, Serpin peptidase inhibitor, clade D (heparin cofactor), member 1,SERPINE1, Serpin peptidase inhibitor, clade E (Nexin, Plasminogen activator inhibitor, type 1), member 1;TM7SF2, Transmembrane 7 superfamily member 2. (B) IPA graphical representation showing the effect of significantly regulated genes,ALDH6A1,ALDH6 andGSTM4in the detoxification process of 4-HNE and MDA. This figure demonstrates that the three genes are involved in the xenobiotic metabolism signaling pathway as on one of the top canonical pathway generated by IPA. The process is displayed graphically as nodes (genes) and edges (the biological relationships between the nodes). Nodes in red indicate up-regulated genes. Various shapes of the nodes represent functional class of the proteins. Edges are displayed with various labels that describe the nature of the relationship between the nodes. (C) IPA graphical representation of the molecular relationships betweenKNG1,SERPINE1,SERPINC1,SERPIND1and Fibrinogen that are involved in “Coagulation System”, the top predicted canonical pathway in HepG2 cells affected by the methanol leaf extract of T. indica. The network is displayed graphically as nodes (genes) and edges (the biological relationships between the nodes). Nodes in red indicate up-regulated genes. Various shapes of the nodes represent functional class of the proteins. Edges are displayed with various labels that describe the nature of the relationship between the nodes. Name of genes/proteins with their corresponding abbreviations are as follows:A2M, Alpha-2-macroglobulin;BDK, Bradykinin;BDKR, Bradykinin receptor; F2, Coagulation factor II (thrombin); F2a, Coagulation factor IIa (thrombin); F2R, Coagulation factor II receptor; F3, Co-agulation factor III (thromboplastin, tissue factor); F5a, CoCo-agulation factor V (proaccelerin, labile factor); F7, Coagulation factor VII (serum prothrombin conversion accelerator); F7a, Coagulation factor VIIa (serum prothrombin conversion accelerator); F8, Coagulation factor VIII (procoagulant component); F8a, Coagulation factor VIIIa (procoagulant component); F9, Coagulation factor IX; F9a, Coagulation factor IXa; F10, Coagulation factor X; F10a, Coagulation factor Xa; F11, Coagulation factor XI; F11a, Coagulation factor XIa; F12, Coagulation factor XII (Hageman factor); F12a, Coagulation factor XIIa (Hageman factor); F13, Coagulation factor XIII; F13a, Coagulation factor XIIIa;KLKB1a, Kallikrein B plasma 1a;PLG, Plasminogen;SERPINA1, Serpin peptidase inhibitor, clade A, member 1;SERPINA5, Serpin peptidase inhibitor, clade A, member 5;SERPINF2, Serpin peptidase inhibitor, clade F, member 2; TFPI, Tissue factor pathway inhibitor;THBD, Thrombomodulin;TPA, Tissue plasminogen activator; UPA, Urokinase plasminogen activator;UPAR, Urokinase plasminogen activator receptor; vWF, von Willebrand factor.
(P <2.17×10⁻⁴). On the other hand, both top networks, “Ophthalmic Disease, Connective Tissue Disorders, Inflammatory Disease” and “Digestive System Development and Function, Organ Morphology, Developmental Disorder” linkedLEAP2,IFNGR1, ANXA3andMX1to the fourth top canonical pathway “Immune Protection/Antimicrobial Response”(P<2.28×10⁻³). The next top network, “Carbohydrate Metabolism, Small Molecule Biochemistry, Free Radical Scavenging” connectedALDH6A1,ALDH9A1, EPHX1,CYP24A1,ADH6andGSTM4to the fifth top canonical pathway, “Xenobiotic Metabolism Signaling”(P<2.41×10⁻³).
the other hand,Fig. 5Cshows the IPA graphical representation of the interaction between SERPINC1,SERPIND1,SERPINE1,KNG1,FGGandFGAwith other interactomes in the “Coagulation System,” the top predicted canonical pathway that were affected by methanol leaf extract ofT. indica. Four of the genes,KNG1,SERPINC1,FGGandFGA, were also linked to the third top canonical pathway, “Intrinsic Prothrombin Activation Pathway.”
Detection of altered protein abundance in HepG2 cells treated with the methanol leaf extract ofT. indicausing ELISA and Western blotting
Figure 6Ashows significantly higher levels of ALDH6A1, ADH6, IFNGR1, LEAP2, SERPINE1, MX1, KNG1, MVK and FGG in the cells treated with the antioxidant-rich methanol leaf extract ofT. indicacompared to the untreated cells. On the other hand, ANXA3 level was significantly lower in the treated cells compared to those untreated. Western blot analysis showed that after normalization withβ-actin, SERPINE1 and IFNGR expression were increased by 2.02 and 2.47-fold, respectively, in the treated cells (Fig. 6B).
DISCUSSION
Different parts ofT. indicaare recognized for their various medicinal properties. We have reported earlier that the antioxidant-richT. indicafruit pulp extract was able to significantly regulate the expression of a sizable number of genes (Razali, Aziz & Junit, 2010;Lim et al., 2012) and significantly alter protein abundance (Chong et al., 2012;Chong et al., 2013) that are associated with antioxidant activities and lipid metabolisms in HepG2 cells. In addition, our group has recently reported that the leaves ofT. indicapossessed high phenolic contents and had potent antioxidant activities in scavenging free radicals in non-cellular based assays (Razali et al., 2012). Catechin, epicatechin and quercetin were detected in the antioxidant-rich leaf extract ofT. indica(Razali et al., 2012). Catechin and epicatechin isolated from cocoa showed potent antioxidant activities (Gu et al., 2006). Catechin and epicatechin detected in tea prevented oxidative stress in rats’ liver by directly altering the subcellular ROS production, glutathione metabolism and cytochrome P450 2E1 activity (Higdon & Frei, 2003;Sang et al., 2003;Singh, Shankar & Srivastava, 2011). However, nutrigenomic analyses to further evaluate the molecular mechanism associated with the medicinal and health benefits of the leaves ofT. indicain HepG2 cells have not been widely conducted and reported.
HepG2 cells were pre-treated with the antioxidant-rich methanol leaf extract of T. indica, followed by the induction of oxidative damage with H2O2. This was done to
investigate the ability of the antioxidant-rich leaf extract ofT. indicato enhance antioxidant protection in the cells, hence preventing them from oxidative damage. The cells were not exposed to H2O2prior to treatment with the plant extracts as our aim was to measure the
ability ofT. indicato prevent oxidative damage in the cells, rather than repairing damage after it has occurred.
Figure 6 ELISA analyses of selected proteins. (A) Enzyme-Linked Immunosorbent Assay (ELISA) analyses of the human IFNGR1, LEAP2, SERPINE1, ANXA3, KNG1, MX1, FGG, MVK, ALDH6A1 and ADH6 antibodies level in the untreated and leaf-treated HepG2 cells. ELISA analyses were done according to manufacturer’s protocols (Cloud-clone, Houston, Texas, USA; Cusabio Biotech, Wuhan, China). Bars not sharing the same superscript letter indicate significant difference atp<0.05 (B) Up regulation of IFNGR1 (a) and SERPINE1 (b) after treatment with IC20concentration of the leaf extract
Lipid peroxidation is known to be an important factor in the pathology of many diseases associated with oxidative stress. Interaction between ROS and unsaturated lipids especially polyunsaturated fatty acids (PUFAs) forms hydroperoxides which can then be further metabolized to produce a variety of aldehydes, including MDA (Brattin, Glende & Recknagel, 1985) and 4-HNE (Esterbauer & Cheeseman, 1990;Spickett, 2013). MDA and 4-HNE were found to be elevated in various diseases (Negre-Salvayre et al., 2008;
Reed, 2011) and are widely used as biomarkers for lipid peroxidation (Zhang et al., 2008). DCF-DA is a fluorogenic dye that measures hydroxyl, peroxyl and other ROS activity within the cell. After diffusion into the cell, DCF-DA is deacetylated by cellular esterases to a non-fluorescent compound, dichloro-dihydro fluorescein (DCFH). In the presence of peroxidase, intracellular H2O2or OH·changes DCFH to the highly fluorescent compound
DCF (Oh & Lim, 2006). H2O2is produced from microsomes and peroxisomes and also by
several physiological processes such as inflammatory respiratory burst and oxidative phos-phorylation (Valko et al., 2006;Chen et al., 2011). H2O2has often been used as a model
to investigate the mechanism of cell injury by oxidative stress (Rigoulet, Yoboue & Devin, 2011). From this study, it can be speculated that the antioxidant-rich leaf extract might also mediate protection of HepG2 cells against toxicity towards H2O2by the inhibition of
hepatic lipid peroxidation, supporting previous report byGhoneim & Eldahshan (2012). MDA (and HNE) is/are enzymatically catabolized to CO2and H2O by mitochondrial
alde-hyde dehydrogenase (ALDH), decarboxylase and acetyl CoA synthase or by cytoplasmic phosphoglucose isomerase to methyoglyoxal (MG) and subsequently to D-lactate. HNE can form protein or DNA adducts resulting in further biomolecule damages. Based on the microarray analyses, genes encoding glutathione transferase (GST), ALDH and alcohol dehydrogenase (ADH) were significantly up-regulated. All these proteins were involved in the major detoxification pathways to convert 4-HNE and MDA to less reactive chemical species and control their steady-state intracellular concentrations (Spickett, 2013). 4-HNE metabolism may lead to the formation of corresponding alcohol 1,4-dihydroxy-2-nonene (DHN), acid 4-hydroxy-2-nonenoic acid (HNA), and HNE–glutathione conjugate prod-ucts (Dalleau et al., 2013). The main catabolic reactions of 4-HNE are the formation of 4-HNE adducts with glutathione (GSH), which occurs spontaneously or can be catalyzed by GSTs. 4-HNE conjugation with GSH produces glutathionyl-HNE (GS-HNE) followed by NADH-dependent ADH catalyzed its reduction to glutathionyl-DHN (GS-DHN) and/or ALDH catalyzed oxidation to glutathionyl-HNA (GS-HNA). Secondly, 4-HNE can be reduced to DHN by aldo-keto reductases (AKRs) or ADH. Thirdly, 4-HNE can be oxidized to HNA by ALDH (Zhong & Yin, 2015). On the other hand, MDA metabolism involves its oxidation by mitochondrial ALDH followed by decarboxylation to produce acetaldehyde, which is then oxidized by ALDH to acetate and further to CO2and H2O
reduced after the leaf treatment as compared to the untreated HepG2 cells. This was in agreement with the previous analyses which demonstrated the reduced level of MDA in the treated HepG2 cells. In addition, the encoded proteins levels, ALDH6A1 and ADH6, were also increased in response to the leaf extract treatment suggesting that protection against lipid peroxidation in the liver was through an increased degradation of MDA and HNE.
SOD, GPx and CAT are three of the primary antioxidant enzymes in mammalian cells that are important in oxygen metabolizing cells. These antioxidant enzymes are regarded as the first line of defense against ROS. SODs catalyze the dismutation of superoxide anion radicals into H2O2and water, while CAT and GPx convert H2O2into water, reducing
the amounts of H2O2, hence protecting the cells against oxidative damage (McCord,
Keele & Fridovich, 1971). The plant extract was shown to increase the activities of SOD, CAT and GPx, further reducing levels of the radicals, superoxide anion and H2O2, hence
lowering peroxidative damage to lipids. However, the increase in enzyme activities was not corroborated with an increase in expression of the encoding genes suggesting that the leaf extract did not directly influence gene transcription but rather, by increasing the activity of the enzymes.
Results in this study imply that the leaf extract which is rich in phenolics including catechin and epicatechin (Razali et al., 2012) may have the ability to directly scavenge ROS and/or free radicals that are produced endogenously in the HepG2 cells. This observation may also explain the potent activity of the leaf extract in inhibiting lipid peroxidation and increasing the antioxidant enzyme activities in the previous results. In the event when MDA and HNE accumulate in cells, the leaf extract was capable to regulate the expression of the genes and consequently the proteins that are involved in the degradation of the two lipid peroxidation products, MDA and HNE, to ultimately produce CO2and H2O.
In addition to the genes encoding GST, ALDH and ADH, a total of 207 genes were significantly regulated when HepG2 cells were exposed to an IC20concentration of the
ATIII belongs to the serpin peptidase inhibitor (SERPIN) family, the largest and most diverse family of protease inhibitors (Rawlings, Tolle & Barrett, 2004). ATIII cooperates with its co-factor, heparin, to effectively regulate coagulation proteases, such as thrombin and coagulation factors, Xa, IXa, XIa, and XIIa, (Siddiqi, Tepler & Fantini, 1997) thus, prevents the activation of clotting proteinases in blood except at the site of a vascular injury (Olson et al., 2010). Deficiencies in ATIII correlated with an increased risk of thrombosis (Siddiqi, Tepler & Fantini, 1997) and CVD (Brouwer et al., 2009). Certain polyphenolic antioxidants namely quercetin (standard quercetin or extracted from plants) showed anticoagulant activities by enhancing ATIII levels (Mozzicafreddo et al., 2006;Hsieh et al., 2007). The leaf extract ofT. indicahave been reported to contain quercetin (Razali et al., 2012), suggesting its role in enhancing the expression of theSERPINCIgene, which may subsequently affect the ATIII synthesis and secretion.
ROS on the other hand can mediate intravascular thrombus formation by interfering with mechanisms that normally inhibit activation of the coagulation pathway, thus promoting the pro-thrombic cascade (Gorog & Kovacs, 1995). Lipid peroxides for instance, can increase the amount of thrombin produced and can slow down the rate of thrombin decay (Salvemini & Cuzzocrea, 2002). Hence, the ability of the leaf extract ofT. indicato inhibit lipid peroxidation and prevent ROS generation, together with its high antioxidant activities may be beneficial in providing protection against the development of thrombus.
SERPIND1encodes for another anticoagulant, heparin cofactor II (HCII). HCII potently inhibits thrombin action by forming a bimolecular complex with dermatan sulfate or heparin proteoglycans under the endothelial layer in mammalians (Tollefsen, Pestka & Monafo, 1983). HCII shares a 30% amino acid sequence homology to that of ATIII (Baglin et al., 2002). Unlike ATIII, HCII exclusively inhibits thrombin and does not inhibit other proteases that are involved in coagulation or fibrinolysis (He et al., 2002). HCII interacts with dermatan sulfate in the vessel wall after disruption of the endothelium and this interaction regulates thrombus formation thus maintaining blood flow after injury to the arterial endothelium (He et al., 2002). Defects inSERPIND1, leading to HCII deficiency are the cause of thrombophilia, a haemostatic disorder characterized by a tendency to recurrent thrombosis, causing a hypercoagulation state (Tollefsen, Pestka & Monafo, 1983). Quercetin, isolated fromFlaveria bidentis, was reported to enhance HCII levels (Guglielmone et al., 2002). Quercetin, which was also found in high amount in the leaf extract ofT. indica(Razali et al., 2012), may be responsible for the reported anticoagulation property of the extract (Mozzicafreddo et al., 2006;Guglielmone et al., 2002) by regulating the expression of bothSERPINCIandSERPIND1.
In addition toSERPINCIandSERPIND1, the expression ofSERPINE1, KNG1, FGA andFGGgenes of which the encoded proteins are involved in coagulation cascade, were also significantly up-regulated in HepG2 cells in response to the methanol leaf extract of T. indica. PAI-1 also shares a 30% amino acid sequence homology to that of ATIII. HMWK, upon binding with prekallikrein, initiates the intrinsic pathway of the coagulation cascade and through a series of events, modulates fibrin clot structure.
molecules act during both cellular and fluid phases of coagulation. In the cellular phase, it facilitates the aggregation of platelets via binding of glycoprotein IIb/IIIa receptors on platelet surfaces (Mosesson, 2005). In the fluid phase, it is cleaved by thrombin to produce fibrin monomers, which polymerize to form the basis of the clot thus, provide the structural network required for effective clot formation (Tanaka, Key & Levy, 2009). Fibrinogen also functioned as an acute phase reactant,in vivoto help modulate the inflammatory cellular reactions (Levy et al., 2012).
The fibrin clot formation from fibrinogen is dissolved by plasmin. Plasmin is proteolytically released from plasminogen by tissue plasminogen activator (tPA) (Kjalke et al., 2001). The activity of tPA is selectively inhibited by PAI-1 (Stringer et al., 1994). PAI-1 binds to polymerized fibrin within the thrombus, followed by inhibition of tPA-mediated fibrinolysis (Loskutoff& Samad, 1998). The absence of PAI-1 in humans leads to life-long bleeding problems presumably resulting from the development of hyper fibrinolysis (Loskutoff& Quigley, 2000). Therefore, PAI-1 is the primary physiological inhibitor of plasminogen activationin vivo, and elevations in plasma PAI-1 appear to promote normal fibrin clearance mechanisms and promote thrombosis (Loskutoff& Samad, 1998). PAI-1 is encoded bySERPINE1which expression was up-regulated in response to the methanol leaf extract ofT. indicatreatment in this study. Previous studies reported that a green tea polyphenol, epigallocatechin-3-gallate, suppressed the expression of tPA, of which, was selectively inhibited by PAI-1 (Maeda-Yamamoto et al., 2003;Ramos, 2008). It is speculated that epicatechin detected in the leaf extract might be involved in regulating theSERPINE1expression, thus may possibly inhibit tPA expression. Hence, the presence of both epicatechin and quercetin might possibly contribute towards the anticoagulant properties of the methanol leaf extract ofT. indica. Four genes,KNG1,SERPINC1,FGG andFGA, were also associated to the “Intrinsic Prothrombin Activation Pathway” further suggesting that the leaf extract was capable in regulating the coagulation cascade probably involving the intrinsic prothrombin activation pathway.
of patients’ mortality (Franchini, 2005). Therefore, the ideal clinical anticoagulant would reliably and predictably inhibit thrombin without substantially increasing the risk of bleeding. A recent study revealed that tamarind leaves did not cause significant haemolysis in human red blood cells (Escalona-Arranz et al., 2014). In the present study, the antioxidant-rich leaf extract ofT. indicaappeared to target various genes including those in intrinsic prothrombin activation pathway that could contribute towards the regulation of the coagulation cascade and thus provides an alternative approach to the classical anticoagulants. However, further in-depthin vitroandin vivoanalyses are required to verify the findings as well as to ensure its safety and efficacy.
The methanol leaf extract ofT. indica also appeared to affect the “Superpathway of Cholesterol Biosynthesis” by regulating the expression ofDHCR24,LSS,MVKand TM7SF2genes. Validation using qRT-PCR also showed a consistent alteration ofDHCR24 andMVK. Oxidative stress leads to the production of ROS which can attack lipid membrane constituents such as unsaturated phospholipids, glycolipids, and cholesterol, resulting in cellular dysfunction and cell death (Girotti, 1998). Studies have reported that plasma membrane compartments rich in cholesterol may participate in signal transduction pathways activated upon oxidative stress, and thus enhance pro survival pathways, while cholesterol depletion appears to increase apoptosis in the oxidative stress-induced cells (Yang, Oo & Rizzo, 2006). During oxidative stress, the expression of genes involved in lipid and cholesterol homeostasis, was shown to be activated by caspase cleavage (Yokoyama et al., 1993). It has been reported that increased cholesterol content in cells concomitant to enhanced antioxidant capacity, made them less susceptible to oxidative stress (Kolanjiappan, Ramachandran & Manoharan, 2003). These observations have led to the hypothesis that cholesterol is required as protection to the cells during oxidative damage to maintain plasma membrane integrity (Di Stasi et al., 2005).
MVKencodes for mevalonate kinase which phosphorylates mevalonate to mevalonate 5-phosphate in the cholesterol biosynthetic pathway. Apart from cholesterol as the end-product, the pathway is also responsible in synthesising several non-sterol isoprenes such as ubiquinone-10 or also known as coenzyme Q10 (CoQ10) (Goldstein & Brown, 1990). Studies have reported the ability of CoQ10 to act as hydrophilic antioxidants and to protect biological membrane against lipid peroxidation (Ernster & Forsmark-Andree, 1993). In fact, ubiquinol-10 was reported to be more efficient in preventing peroxidative damage to LDL than the well-known antioxidants lycopene, beta-carotene, or alpha-tocopherol (Stocker, Bowry & Frei, 1991). The up-regulation ofMVKin this study could have led to the synthesis of lipid-soluble CoQ10 that might have contributed to the lipid peroxidation inhibitory effect of the antioxidant-rich leaf extract ofT. indica.
func-tions, including directed mobility and capping of membrane proteins, receptor-mediated signalling, entry and exit of pathogens and membrane trafficking (Simons & Toomre, 2000). DHCR24 has been reported to act as antioxidants via two mechanisms; the first through a cholesterol-dependent manner (Kuehnle et al., 2008), possibly involving pro survival factors such as Akt and the second through direct scavenging of H2O2(Lu et al.,
2008). DHCR24 was originally known as Seladin-1 gene (Selective Alzheimer’s Disease Indicator-1) as its expression was initially discovered to be down-regulated in regions of the brain vulnerable to Alzheimer’s disease (AD) (Iivonen et al., 2002). Amyloid-β(Aβ) peptide accumulation in the central nervous system underlies the pathological process in AD. Pharmacological enhancement of DHCR24 activity was reported to be protective against Aβtoxicity and oxidative stress-induced apoptosis in AD brain (Greeve et al., 2000).
Lanosterol synthase (LSS) catalyzes the cyclization of (S)-2,3-oxidosqualene to form lanosterol during sterol biosynthesis (Ausubel et al., 1999). Oxidative stress has been reported to increase the level of lanosterol in mitochondria and several other intracellular compartments of macrophages, suggesting that this sterol metabolite may be part of a global cellular response to stress (Andreyev et al., 2010).
More recently, defects in regulation of sterol metabolism has also been implicated in Parkinson’s disease (PD).Lim et al. (2012)reported that lanosterol showed neuroprotective effect in dopaminergic neurons in various models of PD. From this study, it is speculated that the leaf extract ofT. indicamay provide antioxidative protection against ROS-induced oxidative damage that can lead to AD and PD for instance, by regulating the expression ofDHCR24,MVKandLSSgenes of the cholesterol biosynthesis superpathway. Studies reported the neuroprotective effects of citrus (Hwang, Shih & Yen, 2012) and blackcurrant (Veps¨al¨ainen et al., 2013) flavonoids against Aβ neurotoxicity by up-regulating the expression of genes involved in cholesterol metabolic pathway includingDHCR24(Hwang, Shih & Yen, 2012). Amongst the flavonoids are quercetin and myricetin. Hence, quercetin together with the other flavonoids detected in the leaf extract might possibly work by a similar mechanism.
Interferon-γ (IFN-γ) is a key mediator of the host immune response, and the IFN-γ receptor 1 subunit that was encoded byIFNGR1is essential for IFN-γ binding and signalling (Bach, Aguet & Schreiber, 1997). IFN-γ induces the expression of various cytokines and chemokines during the course of viral infection, including HBV and HCV (Barber, 2001), and thus induces the virus clearance by cellular innate responses to eliminate viruses (Korachi et al., 2013).
LEAP2codes for liver-expressed antimicrobial peptide-2 (LEAP-2), which significantly shares structural characteristics with antimicrobial peptides such as defensins and LEAP-1/hepcidin. LEAP-2 is the second blood-derived peptide that is expressed predominantly in the liver and exhibits antimicrobial activity. As the first blood-derived antimicrobial peptide from the liver, LEAP-1/hepcidin (Krause et al., 2003;Park et al., 2001) has been reported to be involved in iron homeostasis (Nicolas et al., 2001;Pigeon et al., 2001). These important physiological functions might be possible for LEAP-2 as well. A previous study has shown that LEAP-2 displayed dose-dependent antimicrobial activity against numerous Gram-positive bacteria and yeasts namelyS. cerevisiaeandB. subtilis(Krause et al., 2003). In fact, a study byHoward et al. (2010)elucidated a role for this peptide in protecting HepG2 cells from injury and/or stress.
Myxovirus resistance protein (MX) encoded byMX1plays a major role in IFN-induced host defense. MX, once induced by IFN-αandβ, blocks viral replication cycle at an early stage thus provided an early antiviral innate immunity (Haller, Frese & Kochs, 1998). Human MX demonstrates a wide antiviral spectrum of activities against orthomyxo viruses including influenza viruses, rhabdoviruses, Bunyaviridae and paramyxoviride (Frese et al., 1996;Tumpey et al., 2007). Numerous experiments have also indicated that recovery from virus infection in humans requires a functional MX defense system (Staeheli et al., 1986;Moritoh et al., 2009).
Annexins are a family of proteins that binds to phospholipids and membranes in a calcium-dependent manner and may link calcium signalling to membrane functions (Larsson et al., 1997).ANXA3also exhibited important roles in tumor development, metastasis and drug resistance (Wu et al., 2013) and showed up-regulated expression in many active cancers (Hayes & Moss, 2004;Mussunoor & Murray, 2008). Furthermore, it has been shown thatANXA3interacted with molecules of the S100 family of calcium binding molecules (Gerke & Moss, 2002). Members of this family are suggested to play an important role in psoriasis pathogenesis and showed up-regulated expression in psoriatic lesional skin, thus suggesting its pathogenic role in this disease (Koczan et al., 2005).
Metabolism Signaling (ALDH6A1, ADH6). Western blot analysis showed consistent pattern of expression of the SERPINE1 and IFNGR1 was detected hence validating the ELISA and microarray data.
CONCLUSION
The antioxidant-rich methanol leaf extract ofT. indicaextract showed protective effects in HepG2 cells by inhibiting lipid peroxidation, enhancing the antioxidant enzyme activities and suppressing the ROS production. The present study implies the potential of this plant as an alternative source of a natural antioxidant agent and the promising therapeutic potential of the leaves ofT. indica. Inhibition of lipid peroxidation involved alteration in the expression of genes and the encoded proteins which are responsible for the degradation of MDA and HNE. The antioxidant-rich methanol leaf extract ofT. indicaextract also directly targeted the expression of genes and the encoded proteins that are involved in the coagulation system and antimicrobial response hence providing molecular evidence associated to the medicinal properties of the leaf extract.
ACKNOWLEDGEMENTS
We would like to thank Siah Eng Tian and Teng Loong Hung from Research Instruments Malaysia for their technical expertise.
ADDITIONAL INFORMATION AND DECLARATIONS
Funding
This research project was funded by research grants (PV116-2012A and H-20001-00-E000009-B29000) from University of Malaya, Kuala Lumpur, Malaysia and FP015-2013B from the Ministry of Education, Malaysia. The funders had no role in study design, data collection and analysis, decision to publish, or preparation of the manuscript.
Grant Disclosures
The following grant information was disclosed by the authors: University of Malaya: PV116-2012A, H-20001-00-E000009-B29000. Ministry of Education, Malaysia: FP015-2013B.
Competing Interests
The authors declare there are no competing interests.
Author Contributions
• Nurhanani Razali performed the experiments, analyzed the data, wrote the paper, prepared figures and/or tables, reviewed drafts of the paper.
• Azlina Abdul Aziz and Sarni Mat Junit conceived and designed the experiments, analyzed the data, contributed reagents/materials/analysis tools, wrote the paper, reviewed drafts of the paper.
Microarray Data Deposition
The following information was supplied regarding the deposition of microarray data: GEO-NCBI:http://www.ncbi.nlm.nih.gov/geo/query/acc.cgi?acc=GSE71606.
Supplemental Information
Supplemental information for this article can be found online athttp://dx.doi.org/ 10.7717/peerj.1292#supplemental-information.
REFERENCES
Andreyev AY, Fahy E, Guan Z, Kelly S, Li X, McDonald JG, Milne S, Myers D, Park H, Ryan A, Thompson BM, Wang E, Zhao Y, Brown HA, Merrill AH, Raetz CR, Russell DW, Subramaniam S, Dennis EA. 2010.Subcellular organelle lipidomics in TLR-4-activated macrophages.Journal of Lipid Research51(9):2785–2797DOI 10.1194/jlr.M008748.
Asase A, Oteng-Yeboah AA, Odamtten GT, Simmonds MS. 2005. Ethnobotanical study of some Ghanaian anti-malarial plants.Journal of Ethnopharmacology99(2):273–279 DOI 10.1016/j.jep.2005.02.020.
Ausubel FM, Brent R, Kingston RE, Moore DD, Seidman JG, Smith JA, Struhl K. 1999.Short protocols in molecular biology: a compendium of methods from current protocols in molecular biology. New York: John Wiley and Sons.
Awah MF, Verla WA. 2010. Antioxidant activity, nitric oxide scavenging activity and phenolic contents ofOcimum gratissimumleaf extract.Journal of Medicinal Plants Research
4(24):2479–2487.
Bach EA, Aguet M, Schreiber RD. 1997.The IFN gamma receptor: a paradigm for cytokine receptor signaling.Annual Review of Immunology15:563–591
DOI 10.1146/annurev.immunol.15.1.563.
Baglin TP, Carrell RW, Church FC, Esmon CT, Huntington JA. 2002.Crystal structures of native and thrombin-complexed heparin cofactor II reveal a multistep allosteric mechanism.Proceedings of the National Academy of Sciences of the United States of America
99(17):11079–11084DOI 10.1073/pnas.162232399.
Barber GN. 2001.Host defense, viruses and apoptosis.Cell Death and Differentiation8(2):113–126 DOI 10.1038/sj.cdd.4400823.
Bhadoriya SS, Ganeshpurkar A, Narwaria J, Rai G, Jain AP. 2011.Tamarindus indica: extent of explored potential.Pharmacognosy Reviews5(9):73–81DOI 10.4103/0973-7847.79102.
Bolliger D, Gorlinger K, Tanaka KA. 2010.Pathophysiology and treatment of coagulopathy in massive hemorrhage and hemodilution. Anesthesiology 113(5):1205–1219
DOI 10.1097/ALN.0b013e3181f22b5a.
Brattin WJ, Glende Jr EA, Recknagel RO. 1985. Pathological mechanisms in carbon tetrachloride hepatotoxicity.Journal of Free Radicals in Biology & Medicine1(1):27–38 DOI 10.1016/0748-5514(85)90026-1.
Brouwer JL, Lijfering WM, Ten Kate MK, Kluin-Nelemans HC, Veeger NJ, Van der Meer J. 2009.
High long-term absolute risk of recurrent venous thromboembolism in patients with hereditary deficiencies of protein S, protein C or antithrombin.Thrombosis and Haemostasis101(1):93–99 DOI 10.1160/TH08-06-0364.
Chong URW, Abdul-Rahman PS, Abdul-Aziz A, Hashim OH, Junit SM. 2012.Tamarindus indica extract alters release of alpha enolase, apolipoprotein AI, transthyretin and Rab GDP dissociation inhibitor beta from HepG2 cells.PLoS ONE 7(6):E39476 DOI 10.1371/journal.pone.0039476.
Chong UR, Abdul-Rahman PS, Abdul-Aziz A, Hashim OH, Mat-Junit S. 2013.Effects of Tamarindus indica fruit pulp extract on abundance of HepG2 cell lysate proteins and their possible consequential impact on metabolism and inflammation.BioMed Research International
2013(459017):1–9DOI 10.1155/2013/459017.
Covas MI, Nyyssonen K, Poulsen HE, Kaikkonen J, Zunft HJ, Kiesewetter H, Gaddi A, De la Torre R, Mursu J, Baumler H, Nascetti S, Salonen JT, Fito M, Virtanen J, Marrugat J, Group ES. 2006.The effect of polyphenols in olive oil on heart disease risk factors: a randomized trial.Annals of Internal Medicine145(5):333–341
DOI 10.7326/0003-4819-145-5-200609050-00006.
Crameri A, Biondi E, Kuehnle K, Lutjohann D, Thelen KM, Perga S, Dotti CG, Nitsch RM, Ledesma MD, Mohajeri MH. 2006.The role of seladin-1/DHCR24 in cholesterol biosynthesis, APP processing and Abeta generation in vivo.EMBO Journal25(2):432–443 DOI 10.1038/sj.emboj.7600938.
Dalleau S, Baradat M, Gu´eraud F, Huc L. 2013.Cell death and diseases related to oxidative stress: 4-hydroxynonenal (HNE) in the balance.Cell Death and Differentiation20(12):1615–1630 DOI 10.1038/cdd.2013.138.
Denizot F, Lang R. 1986.Rapid colorimetric assay for cell growth and survival. Modifications to the tetrazolium dye procedure giving improved sensitivity and reliability.Journal of Immunological Methods89(2):271–277DOI 10.1016/0022-1759(86)90368-6.
Di Stasi D, Vallacchi V, Campi V, Ranzani T, Daniotti M, Chiodini E, Fiorentini S, Greeve I, Prinetti A, Rivoltini L, Pierotti MA, Rodolfo M. 2005.DHCR24 gene expression is upregulated in melanoma metastases and associated to resistance to oxidative stress-induced apoptosis.
International Journal of Cancer115(2):224–230DOI 10.1002/ijc.20885.
El Siddig K, Ebert G, Luedders P. 1999. Tamarind (Tamarindus indica) a review on a multipurpose tree with promising future in the Sudan.Angewandte Botanik73:202–205.
Ernster L, Forsmark-Andree P. 1993.Ubiquinol: an endogenous antioxidant in aerobic organisms.The Clinical Investigator71(8 Suppl):S60–S65DOI 10.1007/BF00226842.
Escalona-Arranz JC, Garcia-Diaz J, Perez-Ros´es R, De la Vega J, Rodr´ıguez-Amado J,
Morris-Quevedo HJ. 2014.Effect ofTamarindus indicaL. leaves’ fluid extract on human blood cells.Natural Product Research28(18):1485–1488DOI 10.1080/14786419.2014.911296.
Esterbauer H, Cheeseman KH. 1990. Determination of aldehydic lipid peroxidation products: malonaldehyde and 4-hydroxynonenal.Methods in Enzymology 186:407–421 DOI 10.1016/0076-6879(90)86134-H.
Esterbauer H, Schaur RJ, Zollner H. 1991.Chemistry and biochemistry of 4-hydroxynonenal, malonaldehyde and related aldehydes.Free Radical Biology and Medicine11(1):81–128 DOI 10.1016/0891-5849(91)90192-6.
Franchini M. 2005.Heparin-induced thrombocytopenia: an update.Thrombosis Journal
3(1):14–18DOI 10.1186/1477-9560-3-14.
Frese M, Kochs G, Feldmann H, Hertkorn C, Haller O. 1996.Inhibition of bunyaviruses, phleboviruses, and hantaviruses by human MxA protein.Journal of Virology70(2):915–923.
Gerke V, Moss SE. 2002.Annexins: from structure to function. Physiological Reviews