www.adv-radio-sci.net/7/55/2009/
© Author(s) 2009. This work is distributed under the Creative Commons Attribution 3.0 License.
Radio Science
Cooperative multi-user detection and ranging based on
pseudo-random codes
C. Morhart and E. M. Biebl
Fachgebiet H¨ochstfrequenztechnik, Technische Universit¨at M¨unchen, Munich, Germany
Abstract. We present an improved approach for a Round
Trip Time of Flight distance measurement system. The sys-tem is intended for the usage in a cooperative localisation system for automotive applications. Therefore, it is designed to address a large number of communication partners per measurement cycle. By using coded signals in a time di-vison multiple access order, we can detect a large number of pedestrian sensors with just one car sensor. We achieve this by using very short transmit bursts in combination with a real time correlation algorithm. Futhermore, the correla-tion approach offers real time data, concerning the time of arrival, that can serve as a trigger impulse for other comu-nication systems. The distance accuracy of the correlation result was further increased by adding a fourier interpolation filter. The system performance was checked with a prototype at 2.4 GHz. We reached a distance measurement accuracy of 12 cm at a range up to 450 m.
1 Introduction
There is a growing market for advanced driver assistance in modern automotive technology. Systems like Lane Change Support or Active Cruise Control are already fully integrated in today’s car production. They allow the driver to extend his view or to adapt the car speed on the current traffic situ-ation. These systems use sensors with radar, lidar or vision-based technology which offer a good positioning information in line of sight scenarios. For security applications with the goal to protect vulnerable road users the above named tech-nologies provide insufficient results. It is very hard for them to detect objects when there is no line of sight with partially or fully hidden pedestrians.
To solve this problem an approach with cooperative sen-sor technology was presented (Rasshofer et al., 2007). The
Correspondence to:C. Morhart ([email protected])
pedestrian is equipped with an active sensor which responds to the transmitted signal of the car. This ensures that commu-nication occurs even in situations when the sensor is visually hidden and also disables failure detection of non-pedestrian objects. The disadvantage of this approach is the fact that every person needs to wear an active sensor. In a future ap-plication an attachment in a cell phone or in a wrist watch would be thinkable.
The position of the pedestrian is then determined by the distance and angle information relative to the car. In our ear-lier work (Morhart and Biebl, 2008) we presented a distance measurement sensor to fullfill this task. This sensor was ca-pable of detecting a huge number of targets in every mea-surement cycle. This is possible by using very short trans-mit signals in a time slot method. The range of this sys-tem was 250 m at an accuracy of 1.2 m. This precision is not sufficient for successful tracking of a pedestrian in a city environment. Therefore we present an improved approach with a new transmission scheme in combination with an in-terpolation technique. A prototype of this system was able to achieve a 10 times smaller accuracy of 12 cm at an overall detection range of 450 m.
2 General principle
2.1 Round Trip Time of Flight
Autonomous distance measurement between two objects mostly uses the Round-Trip Time-of-Flight (RTOF) princi-ple. For our application, it corresponds to the time for the signal from the car to the pedestrian and vice versa. Ad-ditionally, we add a fixed waiting timeTw on the side of the
pedestrian to eliminate the influence of reflections and to dis-tinguish the answers from different pedestrian sensors. The distance1scan then be computed by the totally elapsed time
Tp:
1s=Tp−Tw
Car
T1 T2 T3
T11T12 T1n WT21T22 T2n W
W
W R11R12 R1n R21R22 R2n
R1 R2 R3
Ts Tw
Tclock
Tcycle
time Pedestrian
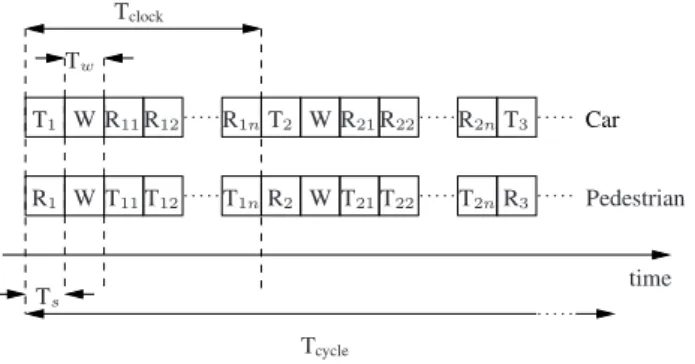
Fig. 1.Time slot order in one transmission cycle.
1sis the distance,Tpthe elapsed time,Twthe waiting time
andc0the speed of light.
In a real application one has to take care to limit the max-imum passed time as it can only be determined by a limited accuracy due to clock errors. For example with a crystal os-zillator with a clock error of 10 parts per million (ppm) one gets a maximum time deviation of 1 ns at a waiting time of 100 µs. This clock error leads to a maximum distance uncer-tainty1εof 15 cm:
1ε= c0
2 Tp·10 ppm (2)
That means if you use that crystal and you want a precision in the range of 15 cm per measurement cycle, the passed time should not exceed 100 µs. One can improve this error by averaging over several measurement cycles, but this would decrease the system speed and also the number of adressable pedestrian sensors.
For our distance measurement system we followed a dif-ferent approach. We used very short transmit pulses in com-bination with fast processing times. This made it possible that the maximum passed time is still in a region where the crystal inaccuracy may be neglected.
2.2 Time division multiple access
One of the main requirements for a cooperative localization system in an automotive environment is a multi-user ability. It should be possible to address with each measurement cycle a huge number of pedestrians. One solution to achieve this is to order car and pedestrian sensor systems in time slots (Fig. 1).
The car system initiates a measurement cycle by sending an pn-coded data burst with length Ts at the time slotT1. At
the same time all pedestrian systems are in receiving mode and listen in their slotR1. Following, a waiting time Tw
is added on both sides to exclude reflections on scattering objects. In the next time slotsT11 toT1n consecutively all
pedestrian systems answer to the car systems in a fixed mul-tiple of the waiting timeTw. In that way the car system can
subtract each individual waiting time as a multiple ofn·Tw.
To avoid the influence of clock errors the car system has to refresh the data burst after a timeTclock. This time has to be
chosen in accordance with the crystal precision and the max-imum needed accuracy. By refreshing the data burst one may avoid that a longer waiting time causes a loss of noticeable distance precision.
2.3 Correlation
The core element of the proposed distance measurement sys-tem is the correlation algorithm. It is a time domain measure-ment principle which could be easy implemeasure-mented on most RF modulation and demodulation hardware, e.g. WLAN transceivers. It needs a more complex digital hardware to compute the correlation algorithm, but this can be achieved with modern microprocessors.
In detail, the correlation is computed in digital form as the sum of:
ϕ[n] =X
N
c[N]s[n+N]. (3)
ϕis the correlation result,c[n]the correlation code, ands[n] the received input signal. The equation above can be carried out as a matrix vector product or implemented in real time system as a FIR-Filter.
Another advantage of a correlation is the masking of the measurement signal. That’s useful in two ways: On the one side the measurement signal can be coded so that only system sensors can read out the signal and furthermore define the distance. On the other side signals that don’t belong to the measurement system can be suppressed by the correlation algorithm as it is unlikely that they ressemble the distance code.
Another advantage of this method is the insensibility to ADC jitter. The sampled input datas[n]can be described by
s[n] =s(nT +1T[n]). (4)
T is the cycle duration of the ADC Clock and1T[n]is the variation of this time by clock jitter. By assuming a normally distributed clock jitter, the correlation is the average over the jitter error. This leads to an improvement in the distance un-certainty.
Figure 2 shows this result. We simulated the influence of the codelength on the standard deviation of the distance error by assumption of a jitter of σ1T=0.1T. The result shows
that even with a correlation of small codelength the distance error can be drastically reduced.
2.4 Transmission scheme
d
is
ta
n
ce
er
ro
r
in
m
codelength in bit
0 50 100 150 200 250 300
0 0.05 0.1 0.15 0.2 0.25
Fig. 2.Max. distance error caused by jitter in relation to the code-length.
sensors should only react on car signals and car sensors should only listen to pedestrian signals.
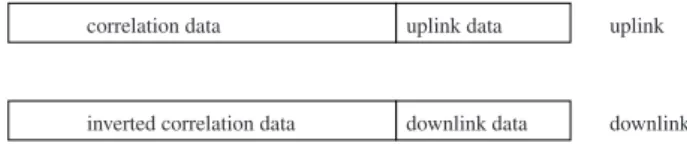
Figure 3 shows our solution approach. The car system ini-tiates a measurement cycle by sending a data burst containing the correlation code plus additional transmit data. To distin-guish between different car systems this code can be partly or totally varied. The pedestrian system knows that code and gets the time of arrival by correlating the incoming signal. To avoid discretisation errors and to get a simpler detection hardware, the pedestrian sensor does not generate a new cor-relation code but sends the inverted car code back. The ad-vantage of this is that the sensor does not have to define the exact time-of-arrival. It has only to delay and invert the re-ceived signal. In contrast to the first advance (Morhart and Biebl, 2008) this method does not generate sampling errors on the pedestrian side and leads to higher system accuracy.
2.5 Interpolation
With the correlation result we get a high quality sensor re-sponse which is almost free of jitter and has a big difference between main and side lobes. Unfortunately, the pure corre-lation result has a relatively coarse distance resolution as it is limited by the sampling rate. To increase this resolution we used a interpolation approach.
Interpolation can be carried out as a polynomial interpo-lation or as a fourier interpointerpo-lation (Kronm¨uller, 1991). A polynomial term can be easily processed but leads to big interpolation errors as the algorithm performs best with flat functions. A better solution is to use a fourier interpolation. Assuming that the sampling theorem is fulfilled every sig-nal form can be reconstructed. The interpolation can be car-ried out with a lowpass filter either as a multiplication in fre-quency or as a convolution in time domain. We used a time domain approach with a low latency FIR-Filter to get an as fast as possible implementation.
uplink
downlink uplink data
downlink data correlation data
inverted correlation data
Fig. 3.Transmission scheme in up- and downlink.
FPGA ADC DAC
VCO1
VCO2
VGA PA
LNA AGC
DET FGA
Fig. 4.Schematic capture of sensor architecture.
3 Implementation
To demonstrate the functionality of our approach we built a prototype at 2.4 GHz. This frequency is suboptimal in terms of detecting hidden persons (Fackelmeier et al., 2008), as lower frequencies have better diffraction characteristics. On the other side the ISM band at 2.4 GHz is the first band avail-able with sufficient bandwidth.
We designed the hardware of both sensors, the car and the pedestrian system symmetrically, although the pedestrian sensor needs less processing power. Figure 4 shows the basic elements of one sensor.
We used analog amplitude modulation to get an as simple as possible transmitter and receiver design. In a later devel-opment stage it is also possible to use more complex modu-lation schemes as the system principle is independent on the signal modulation.
3.1 Transmitter
The analog modulation on the transmitter side is generated with a variable gain amplifier (VGA). The amplification fac-tor is controlled by the output of the digital analog con-verter (DAC). This has the advandtage that we can generate a very broadband linear modulation. The output signal is then mixed by a local oscillator into the 2.4 GHz ISM Band. The frequencies of the two oscillator (VCO1, VCO2) have to be
chosen in such a way that
fRF =fVCO1+fVCO2. (5)
distance [m]
co
rr
el
at
io
n
re
su
lt
correlation data WLAN interference
-100 -50 0 50 100 -5
0 5 10 15 20
Fig. 5.correlation result of sensor data and WLAN interference.
3.2 Receiver
We used a full-wave envelope detector for the AM demodula-tion stage. This has two requirements on the IF stage, namely a tight filtering and an Automatic Gain Control (AGC). The filtering is necessary as the envelope detector is not fre-quency selective and therefore interference of out-of-channel communication services like digital television or GSM has to be suppressed. For the optimal performance of the detector stage the envelope demodulator has to be driven in its linear range. Thus it is essential to use adaptive preamplification in the AGC amplifier. In accordance to the desired distance range we achieved a dynamic from−80 dBm to−30 dBm at a maximum control time of 1 µs.
3.3 CPU-Unit
For the digital processing of the correlation algorithm we used a Virtex 4 FPGA. The use of a FPGA has the advan-tage of parallelisation. This makes it possible to carry out the correlation algorithm in real time at a clock rate of 125 MHz. It would also be possible to use a DSP or single core CPU, but this would need a more complex detection software.
For the interface to the analog front end we used an Ana-log to Digital Converter (ADC) and a Digital to AnaAna-log Con-verter (DAC) likewise with a clock rate of 125 MHz. The DAC and ADC rate has to be chosen in accordance with the data rate to fullfill the sampling theorem. We met this re-quirement by chosing a bit duration of 16 ns. The overall code length of one correlation burst is 256 bit. That means in combination with the AGC control time we get a minimum signal duration of 5 µs.
The pure correlation result on the car sensor at this sam-pling rate has a distance resolution of 1.2 m. This value is not sufficient for a automotive security application. But with the implementation of an interpolation filter we could improve it to 12 cm.
distance [m]
co
rr
el
at
io
n
re
su
lt
correlator output 10x interpolated
-3 -2 -1 0 1 2 3 -5
0 5 10 15 20
Fig. 6. comparison betweeen raw and interpolated correlation re-sults.
4 Measurement results
4.1 Correlation
With the correlation approach we fullfil two goals. On the one hand we suppress channel interference from other com-munication systems like WLAN, Bluetooth and so on. On the other hand we use it to define the time of arrival with the correlation maximum. Interference is a problem in the free accessible ISM bands as a lot of long range services use those frequencies. The ability to distinguish between different sig-nals is therefore a big issue. Figure 5 shows the difference in the correlation result of a WLAN signal and the regular correlation data. One can easily separate the two signals by their maximum values.
But for an exact position determination this data with 1.2 m resolution is still too coarse. We improved the accu-racy by implementing an additional interpolation filter. Fig-ure 6 shows the raw correlation output and the interpolated one. With the currently used 10 times interpolation filter we get a positioning resolution of 12 cm.
4.2 Free space measurement
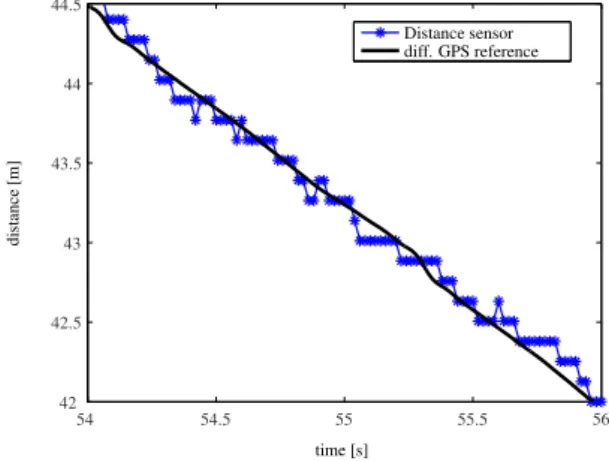
For the characterisation of the RTOF sensor a test scenario with a moving pedestrian and a fixed car position was used. The pedestrian moved with an approximate speed of 1 m/s straight in the direction of the car. We started at a distance of 100 m and moved directly in front of the car sensor at a distance of 2 m. As reference we used a differential GPS sys-tem (Vogel, 2007) with an accuracy down to 2 cm. Figure 7 shows an extract of the distance values of both systems.
time [s]
d
is
ta
n
ce
[m
]
Distance sensor diff. GPS reference
54 54.5 55 55.5 56 42
42.5 43 43.5 44 44.5
Fig. 7.Distance values in the sector from 44.5 m to 42 m.
The difference between the reference and the distance sen-sor is shown in the histogram Fig. 8. The error is normally distributed with a standard deviation of approximately 8 cm.
5 Conclusions
We presented an improved version of a distance measure-ment system for the employmeasure-ment in automotive applications. We used very short transmit pulses and real time correlation to avoid time consuming synchronisation methods. By em-ploying an additional interpolation procedure in combination with an improved transmission scheme we reached a 10 times better distance resolution.
We proved our approach by means of a prototype system at 2.4 GHz. A distance resolution of 12 cm by an overall range of 450 m was achieved. In a free space measurement cam-paign the distance error could be determined to 8 cm. Further measurements should be done to test the system performance in applications with hidden targets.
error [m]
m
ea
su
re
m
en
t
p
o
in
ts
-0.2 -0.1 0 0.1 0.2 0
50 100 150
Fig. 8.Histogram of the distance error in reference to a differential GPS System.
References
Fackelmeier, A., Morhart, C., and Biebl, E. M.: Evaluation of Diffraction Effects for Identifying Hidden Targets, in: German Microwave Conference, 291–294, 2008.
Kronm¨uller, H.: Digitale Signalverarbeitung, Springer Verlag, 1991.
Morhart, C. and Biebl, E. M.: Ein kooperatives code-basiertes Ab-standsmesssystem f¨ur eine große Anzahl simultaner Nutzer, Fre-quenz Journal of RF-Engineering and Telecommunications, 62, 175–179, 2008.
Rasshofer, R., Schwarz, D., Biebl, E. M., Morhart, C., Scherf, O., Zecha, S., Gr¨unert, R., and Fr¨uhauf, H.: Pedestrian Protection Systems using Cooperative Sensor Technology, Proceedings of the 11th International Forum on Advanced Microsystems for Au-tomotive Applications (AMAA’07), 135–145, 2007.