ISSN 0976-2612, Online ISSN 2278–599X, Vol-7, Special Issue-Number5-July, 2016, pp176-186
http://www.bipublication.com
Research Article
Test case reduction by using fuzzy clustering
with new measure similarity
Seydeh maryam Alikosari1 and Vahid RAFE1
1-Department of computer engineering, Malayer Branch, Islamic Azad University, Malayer, Iran.
([email protected])1, ([email protected])2
ABSTRACT
Software testing is a process which is used for determining the accuracy, completeness and quality of advanced computer software. Software tests via a set of inputs named test case. Test case is set of operations which are implemented in order to consider one of the special features or application software. In the designing test case, redundant test cases are created without any utilization that it is very costly and time-consuming for test unit. Our purpose in this article is to reduce time spend on testing by reducing the number of test cases with fuzzy clustering algorithm which has new measure distance similarity. Because may have more efficient and accurate results. Fuzzy clustering helps test cases that have similar feature to classify, so in this case we can avoid spending time on unnecessary test cases.In addition for more efficient fcm clustering we used new measure similarity which combines from two measures that had less objective function compare toEuclidean and for more evaluate we use it in k means and fcm clustering and in the end we compare it with three measures(Euclidean, Manhattan, Minkowski) which has less objective function compare to Euclidean.
Keywords: reducing the test case, software testing, fuzzy clustering, Cyclomatic complexity,Standard deviation, measure similarity
1. INTRODUCTION
Software testing is an important and compression process that determines quality of computer software. It is process of executing a program with the goal of finding errors. Since quality is not absolute, test can never find the accuracy of desired computer software. Software testing is a part of software development process that is the most expensive activities[1] . Each software development organization is interested to test the software completely. According to Rothermel et al, 20000 lines of code requires seven weeks to implement any test case and the cost will be thousands of dollars .In the other words, a test optimization ensures wise utilization of the resources. According to the definition of IEEE standard, test cases is series of inputs, execution and the desired results. A test suite is a combination of test cases [2]. The quality of the tests can be measured through the four following
testing by fcm clustering that have new measure .The rest of this article is organized as follows. Section 2 provides the related work Section 3 presents background Section 4 describes proposed methodology Section 5 describe Evaluation and result analysis and finally conclusion and future work.
2. Related works
Test case Reduction or (TCR) was researched in 1995-2006. This shows that many researchers are willing to delete the unnecessary test cases. Many approaches have been proposed for doing so, such as Offutt, Rothermel, McMaster, and Sampth. These techniques aim for deleting or minimizing the size of the test case, while they maintain the ability of detecting the errors. In general, we have two techniques for reduction: Preprocessing and post processing. Preprocessing is a process that reduces the test cases after producing them. Generally, this operation takes place before regression testing phase. The purpose of the regression testing is to ensure that the changes do not pose any new defect or error in the software. Post processing is a process that deletes the unnecessary tests after conducting the first regression testing this technique can also reduce the test proportional to the case, but it appears that it decreases the ability of detecting the errors. However, Jefferson Offutt and Rothermel have proved that these techniques of test case reduction are so beneficial. These advantages are: A) consumption of less time in implementation of test case particularly at the stage of regression testing, B) considerable reduction of the time and cost of the results, C) effectively organizing the test data pertinent to the test case[4] . The greedy algorithm [5, 6] also deletes the redundant test cases frequently. This algorithm will stop when it covers the series of all of the extracted requirements. In Chen and Lou algorithm[7] all of the important test cases are chosen, and then the greedy algorithm is applied on the rest of the test cases. Jeffrey and Gupta[8] produced a representing series to reduce the test set using the optional redundancy. Harold, Gupta and Sophia [9] found a representative test case for any subseries and they include a series of representatives.
Also, in some articles genetic algorithm [10, 11] is used to reduce the test cases.
3 .Background
This article deals with fuzzy clustering to reduce the time of test on unnecessary test cases which use new measure similarity. Before dealing with the proposed methodology, it’s better to be familiar with some concepts and terms concerning software testing and clustering. 3.1 Software testing
Software testing is one of the most important and expensive software development life cycles. The integration testing of software testing resulted from putting the different components together in order to examine the efficiency of the integrated software of the different components. There are two strategies in software testing: black box strategy: it’s like a black box that you can’t see the inside which means that we examine the program with this presumption that there’s no information of codes or interior design. White box strategy: in this method the system is compared to a glass box and it is easily possible to see the content and the way of functioning. Generally, the examinations of the white box is on a line by line basis as well as based on investigation of all of the branches in the code, all the loops in the program etc. [3, 12]. In this article we will use white box strategy.
3.2 Test case
Test case is set of different inputs related to software. So, test can compare to database which its table can include program inputs. The best test case can find software errors. Thus, test case output is an error or lag that it means program confirmation. Test case length effects on results obtained from tests. These samples can find errors hardly. Their disadvantages can be cited as follows: calculation cost and manual interpretation. But, test case reduction can help to solve this problem partially. Test set is limited set of N samples [3].
3.3 Path covrage
According to a set of test requirements TR and a measureC cover;a set of test cover C if and only if every member of the TR at least with one test case (from those test set) will be
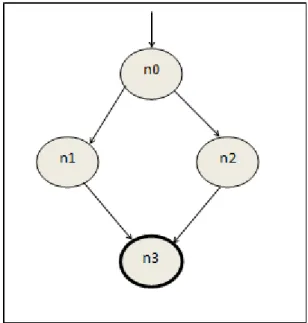
requirements will be cover (or at least take a lot of time cost). Sotest setshouldcovermore test requirements.The most common test covarage is path covarage that means is the all possible paths in the program have been implemented or not?for checking all paths we have to first design program graph,after that we can have DD-path of program then throgh DD-path we can achive indepent path. For example we have: If X>Y then n1 else n2end: so garphof this line going to be:
Fig 1: graph code
So Prime Paths is:{[n0, n1, n3], [n0, n2, n3]} And path (t1) = [n0, n1, n3] , path (t2) = [n0, n2, n3] [13]. As you can see we can have indepented path.So by checking all paths and condition we can find where the error is. 3.4 Cyclomatic complexity
Cyclomatic complexity provides the quantitative measure of logic complexity. This measurement provides the number of the independent paths in the basic series. For each of the instructions, even the both sides of the conditions ensure to be implemented at least once. In this article, Cyclomatic complexity comprises the initial number of the clustering of the issue. We could avoid using this method, but this issue causes spending much time on finding the right number of the center of the clusters [3].
3.5 Fuzzy clustering
In the classical clustering, each of the input case belongs to only one of the clusters and can’t belong to two cluster or more. In the other
words, the clusters do not overlap. Now consider a situation in which the similar extent of a sample is the same as two or more clusters. In the classical clustering and the fuzzy clustering, we should decide that to which cluster the sample belongs. The main difference between the classical clustering and the fuzzy clustering is that a sample can belong to more than one cluster[3].
3.6 Fuzzy c-mean clustering
In this algorithm, just like the classical c-mean clustering, the number of the clusters is determined in advance. The objective function defined for this algorithm is:
In the above formula, m is a real number (bigger than 1) which is considered 2 most of the time. Xk sample k and Vithe representative or the center of cluster i. Uik the extent of belonging for sample i in cluster k. ||*|| the extent of similarity of the sample with the center of the cluster; and we can use any measure similarity which implies the similarity of the sample and the cluster center. We can define a U matrix which consists of C rows and N columns and its elements can take any number from 0 to 1. If all of the elements of U matrix are from 0 to 1, then the algorithm will be the classical c-mean clustering. Though the elements of U matrix can take any measure from 0 to 1, and the sum of the elements in any column must be equal to 1:
This means that the sum of each sample’s belonging to cluster C must be 1. Using the above condition as well as minimizing the objective function we will have:
4 The proposed methodology
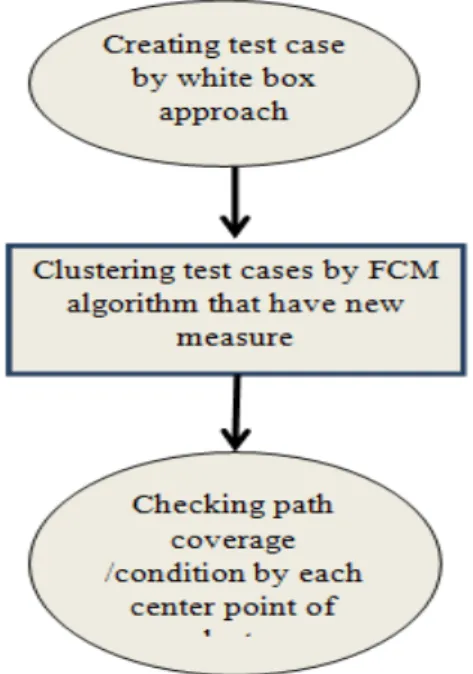
The general idea of our approach is based on white box;we canby redcucing test cases redcue the time cost in software testing. In the unit test take a lot of time to check all paths for finding errors by test cases especially for multi-input. So we clustered all test cases and we took central point for checking path coverage /condition.In this way in short time we can achieve coverage that we follow. For clustring test cases we used fuzzy clustering which use new measure. Our approach framework is shown below:
Fig 2: framwork of methodology
1. Creating test case by manual or automatic tools
2. Finding Cyclomatic complexity in order to initial selection of clusters.
3. Performing fuzzy clustering(c-mean) in test case and creating central point C. Here, point C is the number of clusters. 4. Checking central points: if these points aren't covered all independent paths, the number C
should be one unit more than other units until to achieve the good coverage. This coverage can create via deviance from central point criteria. Befor we performe FCM on a sample, we define our algorithm with new measure then we will go to the next step.
4.1 FCM clustring with new mearue
In this algorithm we little bit changed the measure distance to improve objective function. Our distance measur combine of two measures (Euclidean distance and Manhattan distance). We define two weight between [0.1] (w1, w2) and plus that sum of two weight should be one. Each weight multiply with their measure and in the end we take weighted average of both.The measure similarity defined as follow:
+
/ (w1+w2)
As you can seeW1 define for Euclidean distance and W2 for Manhattan distance and should w1+w2=1. In this way we can use both distance and we have balance by weighted average. This measure helps the objective function minimized. Ifwe minimized the objactive function some how we speed up the time of testing. And we can find the error sooner. By changing the distance measure objective function also going to change so our objective function andthe membership of each point will be:
4.2 An example of the proposed algorithm Right now we define our approach with sample that we considered;the desired example is determination of the roots of the quadratic equationThe inputs are three variables from the positive numbers, for example A, B, C and interval numbers [0 .. 100], and the output can be one of the followings: real roots, equal roots, imaginary roots.As previously we mentioned, thenumber of clustring should be pre-specified, which can be here equal to the Cyclomatic complexity of program so in the first step we have to know the Cyclomatic complexity and the independent paths of program. As you can see in below, all lines are numbered to design control-flow graph.
(5)
Seydeh maryam Alikosari, et al. 180
Then we can generate another graph called DD path1 out of the control-flow graph.DD path of code figure 3 illustrated in figure 4:
1
Direction to direction
Now we can calculate the Cyclomatic Complexity by this method:
V (G) = e – n + 2 (Where “e” are edges & “n” are nodes)V (G) = 24– 19+ 2 = 5 + 2 = 7
So the Cyclomatic Complexity our code is 7,so ( 1) int m ain ( )
( 2) {
( 3) int a, b, c, d, boolean = 0; ( 4) double D;
(5) printf ( “nt Enter ` a' coefficient : "); ( 6 ) scan f ( " % d " , & a) ;
( 7 ) pr in t f ( " n t En t er ` b ' co efficien t : “ ) ; ( 8 ) scan f ( " % &d " , & b ) ;
( 9 ) pr in t f ( “ n t En t er ` c' coefficien t : “ ) ; ( 1 0 ) scan f, ( " % d ” , & c) ;
( 1 1 ) If ((a > =0) && (a < =100) && (b > = 0) & (b < =100) && (c > =0) && (c < =100)) { ( 1 1 ) if ( ( a > = 0 ) && ( a < = 1 0 0 ) && ( b > = 0 ) && ( b < = 1 0 0 ) && ( c > = 0 ) && ( c < = 1 0 0 ) ) {
( 1 2 ) boo lean = 1 ; ( 1 3 ) if ( a = = 0 ) { ( 1 4 ) boo lean = - 1 ; ( 1 5 ) }
( 1 6 ) }
( 1 7 ) if ( b oolean = = 1 ) { ( 1 8 ) d = b * b – 4 * a * c; ( 1 9 ) if ( d = = 0 ) {
( 2 0 ) pr in t f ( " r oot s ar e eq u al an d ar e r 1 = r 2 = % f - b / ( 2 * float ) &) ) ;
( 2 1 ) }
( 2 2 ) else if ( d > 0 ) { ( 2 3 ) D = sq r t ( d ) ;
( 2 4 ) p r in t f ( " r oot s ar e r eal an d ar e r 1= % f an d r 2 = % f; ( - b - D) / ( 2 * a) ,
( - b + D) / ( 2 * a) ) ; ( 2 5 ) }
( 2 6 ) else {
( 2 7 ) D = sq r t ( - d) / ( 2 * a) ;
( 2 8 ) p r in t f ( " r oot s ar e im ag in ar y " ) ; ( 2 9 ) }
( 3 0 ) }
( 3 1 ) else if ( b oolean = = - 1 ) {
( 32) pr int f ( " Not a quadr at ic
( 33) } ( 3 4 ) else { ( 3 5 ) p r in t f
( " I n v alid in p u t r ang e . . . ) ;
( 3 6 ) }
( 3 7 ) g et ch ( ) : r etur n 0; ( 39) }
Fig 3: the code of quadratic equation
Seydeh maryam Alikosari, et al. 181
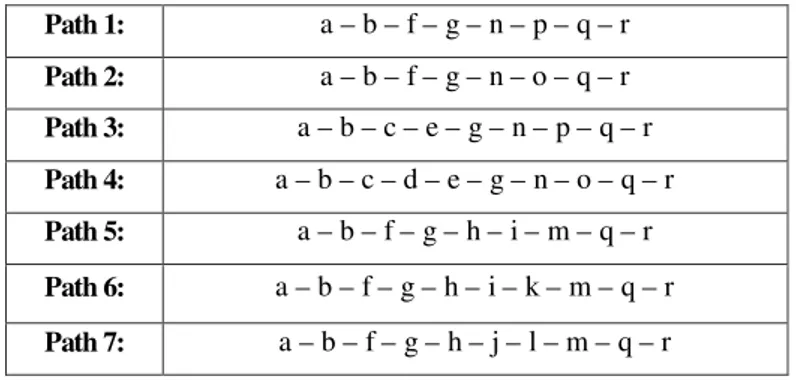
number seven is going to be initial number of clusters. In addition our coverage in this program is path covarage, so we need the independent paths, then we generate independent paths out of the DD-path as you can see illustrated in table 1, after that we created test case manually and we wrote algorithm FCM with new measure in MATLAB software and we perform it on test cases which they are our data set.After performing the first step we reach to the central seven points.Each of them can cover one of independent path so we willexamine seven test cases.
Table 1: independent paths of quadratic equation
As we said we will examine the obtained central points in that how many independent paths and conditions they cover. In the first steps our sample had this output that illustrated in table 2.
Table2: Conditional statements
Maybe in first step they don’t represent an appropriate coverage. In that case, we will continue the process again with one more cluster until we reach to the appropriate coverage.
We have to balance objective function with number ofclusters. So in each process we calculate the standard deviation of sum of central points.By this approach we reduced the time wasted in testing unnecessary test cases.
This method can apply in problems which have several inputs and a lot of conditions.As the number of clusters increases the number of test cases to be tested increases and also there is improvement in coverage.
Path 1: a – b – f – g – n – p – q – r
Path 2: a – b – f – g – n – o – q – r
Path 3: a – b – c – e – g – n – p – q – r
Path 4: a – b – c – d – e – g – n – o – q – r
Path 5: a – b – f – g – h – i – m – q – r
Path 6: a – b – f – g – h – i – k – m – q – r
Path 7: a – b – f – g – h – j – l – m – q – r
Conditional Statements cluster
If ((a > =0) && (a < =100) && (b > = 0) && (b < =100) && (c > =0) && (c < =100)) //
boolean == 1
C1
if (a==0) // Not a quadratic equation C2
If (boolean==1) && (d==0) // roots are equal C3
If (boolean==1) &&(d>0) // roots are real C4
If (boolean==1) && (d<0) // roots are imaginary C5
If ((a > =0) && (a < =100) && (b > = 0) && (b < =100) && (c > =0) && (c < =100)) //
boolean == 1
C6
Seydeh maryam Alikosari, et al. 182
5 Evaluation and result analysis
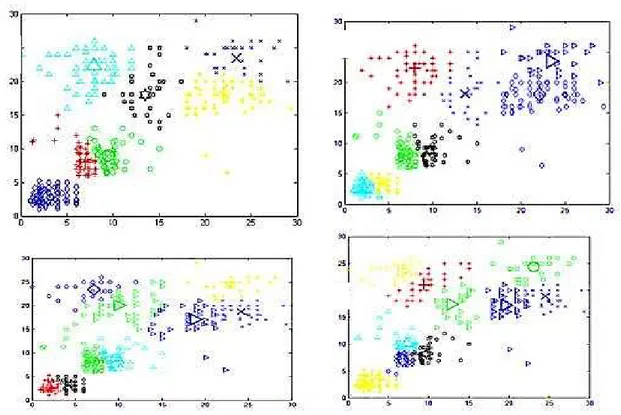
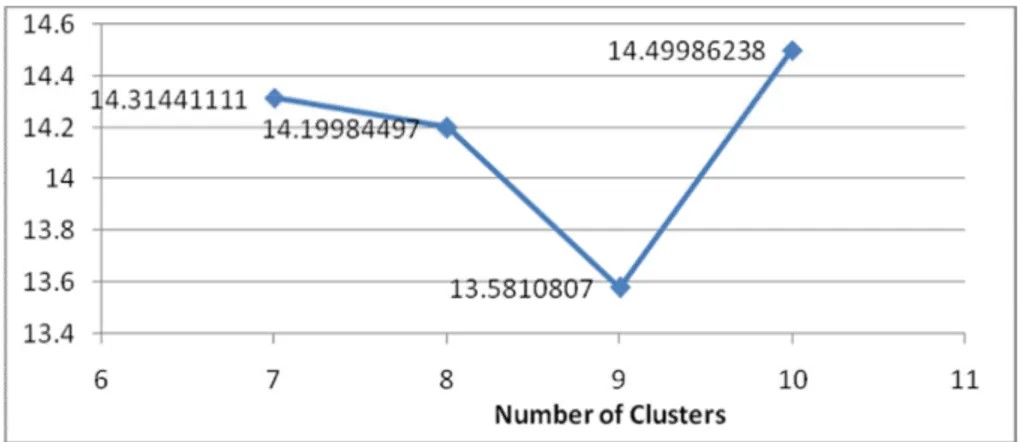
In order to evaluate the proposed approach, we perfomed the FCM clustering on test cases and in each process we had standard deviation of sum of central points.As you can see in fig 5 in our sample, this has been done four times which means the 7, 8, 9 and 10 clusters have been given to FCM with new measure.By increaeing clusters we will have good coverge too.
In these four times we exanimated central points and we wrote the standard deviation of sum of central points, you can see the result in table 3 and fig 6.
In fcm with new measure we obtained a lower objective function in cluster 9. We found suitable coverage in this cluster and plus that we don’t need for appropriate coverage examine the whole test cases; with this method we can reduced the time wasted in testing unnecessary test cases. For each reduction experiment, researcher can estimate the percentage size reduction by this formula[2]:
100 × (1 – Size Reduced / SizeFull) And and percentage fault detection reduction is:
100 × (1- Faults Detected Reduced / Faults Detected Full)
Table 3: comparison of distance measure centers
Standard Deviation of centroids
No .of clusters FCM New measure
7 14.31441111
8 14.19984497
9 13.5810807
10 14.49986238
Fig 5:Plot of clusters with their centers for 7, 8, 9, 10 numbers of
a) b)
Seydeh maryam Alikosari, et al. 183
Fig 6: comparison of distance measure centers The average of running of testing going to be:
Test case generation + cyclomatic complexity calculation + cluster generation + select cluster + testing of the software with the new test suite.
In addition new measure can use in other field too, like kmeans and FCM clustering. We did the pervious method by Euclidean measure that has been suggested by Kumar and Bhatia [3],but, calculations have shown that algorithm FCM with new measure similarity can shows less standard deviation than FCM with Euclidean measure. The difference of both standard deviation illustrated in fig 7 and table 4.
Table4: comparison of distance measure centers
And for further evaluation we applied this measure in kmeans and FCM on data sets wine and iris with three clusters which we download these two data set from site UCIMachine Learning Repository 1, and we
1
mlr.cs.umass.edu/ml/datasets.html
Standard Deviation of centroids
No .of clusters FCM Euclidean measure New measure
7 14.3256984 14.31441111
8 14.95049075 14.19984497
9 13.98487539 13.5810807
10 14.58071421 14.49986238
Fig 7: Standard Deviation of centroids
12.5 13 13.5 14 14.5 15 15.5
7 8 9 1 0
N o .of clusters fcm
Standard Deviation of centroids
Euclidean measur e
Seydeh maryam Alikosari, et al. 184
evaluate the result with three measures similarity such as Manhattan, Euclidean and Minkowski. Table 5 and fig 8 illustrated Standard Deviation of centroids kmeans algorithm. In this algorithm the results of four measures were too close. But as you can see lowest measure in both data sets is new measure.
Table 5: comparison of distance measure centers
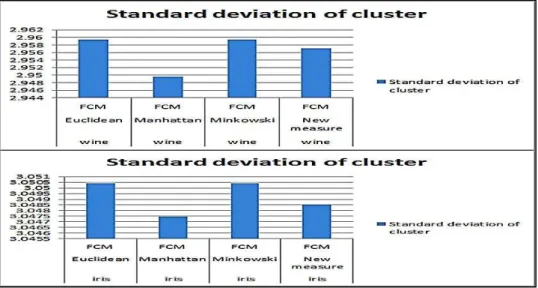
We did the same process in FCM algorithm too but it wasn’t the same result, Table 6and fig 9shows the result of standard deviation of central point. Here the results were close too but measure Manhattan perform better than other in fact new measure have second palace in this table in both data sets iris and wine data sets.
Table 6: comparison of distance measure centers
Data set Measure similarity Algorithm that used Standard deviation of cluster
iris Euclidean kmeans 3.033035957
iris Manhattan kmeans 3.036123459
iris Minkowski kmeans 3.033035957
iris New measure kmeans 3.023812457
wine Euclidean kmeans 2.883143477
wine Manhattan kmeans 2.873463323
wine Minkowski kmeans 2.888472279
wine New measure kmeans 2.869314002
Data set Measure similarity Algorithm that used Standard deviation of cluster
iris Euclidean FCM 3.050422738
iris Manhattan FCM 3.047467625
iris Minkowski FCM 3.050422733
iris New measure FCM 3.048518124
wine Euclidean FCM 2.959430639
wine Manhattan FCM 2.949603791
wine Minkowski FCM 2.959430599
wine New measure FCM 2.957047703
Seydeh maryam Alikosari, et al. 185
6 Conclusion and Future Work
In this paper, we tried reduced the time wasted in testing unnecessary test cases. As you viewed we used FCM clustring with new mearue. Because
has more flexibility than other
clustering.Weselects the number of initial clusters through Cyclomatic complexity progrm. But it can be other method; we can find it in future. And we considered path coverage for our sample that's why we designed the DD-path and independent path of our sample then we implement our method in Matlab software. This method in field of software testing my helpe, they don’t need tospend much time on executing thousands of test cases.
Then wedid the same process with Euclidean measure, which shown new mesure could do it in less objective function then for further evaluation we applied new measure in kmeans and FCM on data sets iris and wine with three clusters.However effectiveness of new measure was close to these three distance similarities (Euclidean, Manhattan, Minkowski) but it could illustrate less objective functioncompare to Euclidean in both algorithms.In the world Industry one second it means a lot so this different result my show nothing but in some cases may help. In future we try to improve new measure to perform better in k means and FCM clustering and show lower
objective function compare to the other measures too.
REFERENCES
1. C.P.Indumathi, B. Galeebathullah, O. Pandithurai, "Analysis of Test Case Coverage Using Data Mining Technique," IEEE Computer Society, 2010.
2. I. u. R. Saif ur Rehman Khan, Saif Ur Rehman Malik, "The Impact of Test Case Reduction and Prioritization on Software Testing Effectiveness," International Conference on Emerging Technologies, 2009.
3. G. K. P. K. Bhatia, "Software testing optimization through test suite reduction using fuzzy clustering," springer, 2013.
4. J. D. Siripong Roongruangsuwan "TEST CASE REDUCTION METHODS BY USING CBR," Autonomous System Research Laboratory Faculty of Science and Technology Assumption University, Thailand, 2010. 5. M. H. S. Yoo, "Regression Testing
Minimisation, Selection and Prioritisation : A
Survey," SOFTWARE TESTING,
VERIFICATION AND RELIABILITY, 2007. 6. V. CHVATAL, "A GREEDY HEURISTIC
FOR THE SET-COVERING PROBLEM,"
MATHEMATICS OF OPERATIONS RESEARCH, vol. 4, August 1979.
Seydeh maryam Alikosari, et al. 186
7. M. F. L. T.Y. Chen, "A new heuristic for test suite reduction," Information and Software Technology 40 (1998) 347-354, 1997.
8. N. G. Dennis Jeffrey "Improving Fault Detection Capability by Selectively Retaining Test Cases during Test Suite Reduction," IEEE Computer Society, 2007.
9. R. G. M. J. HARROLD, and M. L. SOFFA, "A Methodology for Controlling the Size of a Test Suite," ACM Tran.a.tmns on Software Engmeenng and MeLhadolo, vol. 2, 1993. 10.B.-k. S. Xue-ying MA, Zhen-feng
HE,Cheng-qing YE, "A Genetic Algorithm for Test-Suite Reduction," Springer Berlin Heidelberg, 2005. 11.J.-c. L. Yi-kun ZHANG, Ying-an CUI, Xin-hong HEI, Ming-hui ZHANG, "An Improved Quantum Genetic Algorithm for Test Suite Reduction," 978-1-4244-8728-8/11/$26.00 ©2011 IEEE, 2011.
12.C.P.Indumathi,
B.Galeebathullah,O.Pandithurai, "Analysis of Test Case Coverage Using Data Mining Technique," IEEE Computer Society, 2010. 13.I. u. R. Saif ur Rehman Khan, Saif Ur Rehman
Malik, "The Impact of Test Case Reduction and Prioritization on Software Testing Effectiveness," International Conference on Emerging Technologies, 2009.
14.G. K. P. K. Bhatia, "Software testing optimization through test suite reduction using fuzzy clustering," springer, 2013.
15.J. D. Siripong Roongruangsuwan "TEST CASE REDUCTION METHODS BY USING CBR," Autonomous System Research Laboratory Faculty of Science and Technology Assumption University, Thailand, 2010. 16.M. H. S. Yoo, "Regression Testing
Minimisation, Selection and Prioritisation : A
Survey," SOFTWARE TESTING,
VERIFICATION AND RELIABILITY, 2007. 17.V. CHVATAL, "A GREEDY HEURISTIC
FOR THE SET-COVERING PROBLEM,"
MATHEMATICS OF OPERATIONS RESEARCH, vol. 4, August 1979.
18.M. F. L. T.Y. Chen, "A new heuristic for test suite reduction," Information and Software Technology 40 (1998) 347-354, 1997.
19.N. G. Dennis Jeffrey "Improving Fault Detection Capability by Selectively Retaining Test Cases during Test Suite Reduction," IEEE Computer Society, 2007.
20.R. G. M. J. HARROLD, and M. L. SOFFA, "A Methodology for Controlling the Size of a Test Suite," ACM Tran.a.tmns on Software Engmeenng and MeLhadolo, vol. 2, 1993. 21.B.-k. S. Xue-ying MA, Zhen-feng
HE,Cheng-qing YE, "A Genetic Algorithm for Test-Suite Reduction," Springer Berlin Heidelberg, 2005. 22.J.-c. L. Yi-kun ZHANG, Ying-an CUI, Xin-hong HEI, Ming-hui ZHANG, "An Improved Quantum Genetic Algorithm for Test Suite Reduction," 978-1-4244-8728-8/11/$26.00 ©2011 IEEE, 2011.
23.S. N. a. J. Dondeti, "BLACK BOX AND WHITE BOX TESTING TECHNIQUES –A LITERATURE REVIEW," International Journal of Embedded Systems and Applications, vol. 2, June 2012.