RESEARCH ARTICLE
LATS2 Positively Regulates Polycomb
Repressive Complex 2
Kosuke Torigata1, Okuzaki Daisuke1,3, Satomi Mukai1, Akira Hatanaka2, Fumiharu Ohka2, Daisuke Motooka4, Shota Nakamura4, Yasuyuki Ohkawa5, Norikazu Yabuta1,
Yutaka Kondo2, Hiroshi Nojima1,3*
1Department of Molecular Genetics, Research Institute for Microbial Diseases, Osaka University, Suita City, Osaka, Japan,2Department of Epigenomics, Nagoya City University Graduate School of Medical Sciences, Nagoya City, Aichi, Japan,3DNA-chip Development Center for Infectious Diseases, Research Institute for Microbial Diseases, Osaka University, Suita City, Osaka, Japan,4Department of Infection Metagenomics, Genome Information Research Center, Research Institute for Microbial Diseases, Osaka University, Suita City, Osaka, Japan,5Department of Advanced Medical Initiatives, Graduate School of Medical Sciences, Kyushu University, Fukuoka City, Fukuoka, Japan
Abstract
LATS2, a pivotal Ser/Thr kinase of the Hippo pathway, plays important roles in many biolog-ical processes. LATS2 also function in Hippo-independent pathway, including mitosis, DNA damage response and epithelial to mesenchymal transition. However, the physiological rel-evance and molecular basis of these LATS2 functions remain obscure. To understand novel functions of LATS2, we constructed aLATS2knockout HeLa-S3 cell line using TAL-effector nuclease (TALEN). Integrated omics profiling of this cell line revealed thatLATS2
knockout caused genome-wide downregulation of Polycomb repressive complex 2 (PRC2) and H3K27me3. Cell-cycle analysis revealed that downregulation of PRC2 was not due to cell cycle aberrations caused byLATS2knockout. Not LATS1, a homolog of LATS2, but
LATS2 bound PRC2 on chromatin and phosphorylated it. LATS2 positively regulates his-tone methyltransferase activity of PRC2 and their expression at both the mRNA and protein levels. Our findings reveal a novel signal upstream of PRC2, and provide insight into the crucial role of LATS2 in coordinating the epigenome through regulation of PRC2.
Introduction
Large tumor suppressor 2 (LATS2), a pivotal Ser/Thr kinase of the Hippo signaling pathway, plays important roles in many biological processes, including normal development and tumori-genesis [1]. In canonical Hippo signaling, LATS2 and its homolog LATS1 phosphorylate YAP1 and WWTR1 (also known as YAP and TAZ, respectively), transcription coactivators involved in cell proliferation. Phosphorylation inhibits the function of these proteins by promoting their cytoplasmic retention and degradation, thereby governing contact inhibition, and dysregula-tion of this process is related to tumor progression. LATS2 also funcdysregula-tions as a hub for many other tumor-suppressive signaling pathways, such as the tetraploidy checkpoint [2], G1/S
a11111
OPEN ACCESS
Citation:Torigata K, Daisuke O, Mukai S, Hatanaka A, Ohka F, Motooka D, et al. (2016) LATS2 Positively Regulates Polycomb Repressive Complex 2. PLoS ONE 11(7): e0158562. doi:10.1371/journal. pone.0158562
Editor:Jason Glenn Knott, Michigan State University, UNITED STATES
Received:April 18, 2016
Accepted:June 19, 2016
Published:July 19, 2016
Copyright:© 2016 Torigata et al. This is an open access article distributed under the terms of the
Creative Commons Attribution License, which permits unrestricted use, distribution, and reproduction in any medium, provided the original author and source are credited.
Data Availability Statement:All relevant data are within the paper and its Supporting Information files. The gene and miRNA expression raw data and sequencing raw data have been submitted to the NCBI Gene Expression Omnibus database under accession number GSE63538.
localization depending on its phosphorylation state during the cell cycle; it also localizes to the nucleus [7,8]. The nuclear LATS2 performs both kinase-dependent and -independent func-tions in collaboration with a wide range of transcriptional regulators, including TP53, SNAI1, AR, and CTNNB1/BCL9 [9–12], and thereby contributes to regulation of pluripotency and maintenance of the dedifferentiated state [13,14]. However, the physiological relevance of these LATS2 functions to non-canonical Hippo signaling remains poorly understood.
Polycomb repressive complex 2 (PRC2) catalyzes di- and tri-methylation of histone H3 at lysine 27 (H3K27me2/3) and forms Polycomb domains involved in gene silencing [15–18]. PRC2 is composed of three core components, EZH2, EED, and SUZ12, along with accessory factors including RbAp46/48 and AEBP2. PRC2-mediated gene silencing plays an important role in maintenance of stemness and normal development [19,20], and PRC2 is dysregulated in several types of cancers [21]. Thus, PRC2 and its epigenetic signatures represent promising therapeutic targets for tumors with specific mutations or alterations [22,23]. In order to develop more precise tumor treatments, it is essential to elucidate the pertinent upstream sig-nals and their spatiotemporal regulation at the molecular level. Indeed, recent studies uncov-ered several aspects of the post-translational regulation of PRC2 components and the molecules with which they collaborate, including non-coding RNAs.
In this study, we generatedLATS2knockout (KO) HeLa-S3 cells to elucidate a novel LATS2 function using TALEN-mediated genome editing. Genome-wide profiles using transcriptome and epigenome analysis ofLATS2KO cells revealed thatLATS2KO caused a deleterious effect on global H3K27me3 integrity. Here, we show a novel functional link between LATS2 and PRC2.
Results
TALEN-mediated knockout of
LATS2
gene in HeLa-S3 cells
To explore the cellular functions and/or signals that potentially fluctuate in LATS2 dependent fashion, we establishedLATS2knockout (KO) HeLa-S3 strains by inducing TALEN-mediated double-strand breaks, followed by successive generation of frameshift mutations by non-homologous end joining [24]. Transient expression of TALENs targeting theLATS2gene locus (Forward: hg19_chr13:21,620,130–21,620,148; Reverse: hg19_chr13:21,620,095–21,620,113) resulted in successful knockout ofLATS2(genomic:Fig1A, protein level:Fig1B). Expression analysis ofCTGF(1.6-fold increase uponLATS2KO), a downstream target gene of the Hippo pathway that should negatively correlate with LATS2 kinase activity, confirmed downregula-tion of intrinsic LATS2 expression (Fig1C). To confirm the dependency of the overall expres-sion profile on LATS2 and exclude the possibility of obvious off-target effects of the TALEN system, we calculated the correlation between differentially expressed genes (DEGs) inLATS2 KO HeLa-S3 cells and siRNA-mediated LATS2-knockdown cells. Although we used different analytical platforms (RNA-sequencing (RNA-seq) forLATS2KO cells, microarray for the knockdown study) (summarized inFig1D), a significant portion of DEGs (15%; 118 of 769 genes) overlapped and positively correlated (p = 6.1E-25, Fisher’s exact test) between the two types of cells (Fig1E; DEGs are listed inS1andS2Tables). Some DEGs detected in both cell types were also validated by RT-qPCR analysis (Fig1F). Following these validation, we sub-jected thisLATS2KO HeLa-S3 cell line to further analysis.
LATS2
KO causes downregulation of H3K27me3
Next, we sought to identify the gene signatures associated withLATS2KO. Using RNA-seq data, we performed gene set enrichment analysis (GSEA) [25] to extract cellular functions asso-ciated with LATS2 from‘C2 cgp gene sets collection’. This collection includes gene sets Competing Interests:The authors have declared
representing expression signatures of genetic and chemical perturbations in many previous omics-based studies.LATS2KO cells were positively correlated with high expression of epige-netically silenced genes, especially H3K27me3-marked genes (p-value<0.001) (Fig2A; top 25
gene sets are listed inS3Table). To confirm the impact ofLATS2KO on the level of H3K27me, we performed immunofluorescence imaging. Consistent with the positive correlation of LATS2 with H3K27me3 in GSEA,LATS2KO decreased the H3K27me3 level (Fig2B). To more precisely determine the impact of LATS2 on epigenetic landscapes, we next performed high-throughput sequencing of ChIP-enriched DNA (ChIP-seq) for H3K27me3 marks. Con-sistent with the results shown inFig 2A and 2B, H3K27me3 levels were reduced at target loci (HOXAlocus as a representative;Fig2C), as well as at promoter regions, on a genome-wide scale (aggregated for all transcription start sites [TSSs];Fig2D). In order to validate the results above, we examined H3K27me3 levels at known PRC2 target loci, i.e., genes that have the H3K27me3 mark and are bound by SUZ12 and EED on their promoters in human embryonic stem cells [26]. Although the magnitude of fluctuations determined by ChIP-qPCR varied, we observed an overall trend toward downregulation of H3K27me3 levels at these loci (Fig2E). These results suggest that LATS2 exerts a positive effect on PRC2 function, and that deletion of LATS2 therefore causes genome-wide downregulation of H3K27me3.
LATS2
affects H3K27me3 genome-wide in a kinase-dependent fashion
The aggregate plots inFig 2Dsuggested an existence of unidentified genes fluctuated strongly uponLATS2KO. To investigate the chromatin state in more detail, we divided the genes into three groups depending on their H3K27me3 status: 1) H3K27me3-overlap, genes possessing peaks that were called by the MACS software [27] within +/- 5 kb of each TSS in both wild type andLATS2KO cells (1546 genes); 2) H3K27me3-loss, genes possessing peaks only in wild type cells (2380 genes), and 3) H3K27me3-gain, genes possessing peaks only inLATS2KO cells (1035 genes) (Fig3A, upper panel). The aggregate analysis for each module revealed that the H3K27me3-gain module maintained the same level of H3K27me3 between wild type and LATS2KO cells (Fig3A, lower panels). This observation suggests thatLATS2KO has mostly inhibitory effects on H3K27me3 maintenance, and that sensitivity to this effect varies across the genome. To examine the LATS2 dependency of transcriptome changes accompanied by epigenetic changes, we performed GSEA on the H3K27me3-loss module, the module most sen-sitive toLATS2KO (the genes are listed inS4Table). Genes in this module were significantly upregulated uponLATS2KO (p-value<0.001) (Fig3B). To examine the potential functional Fig 1. Construction ofLATS2KO HeLa-S3 cells.(A) Genomic sequences of the wild typeLATS2locus (hg19) and theLATS2KO mutations generated in HeLa-S3 cells. The TALEN-targeted regions of the genome were amplified by genomic PCR, the PCR products were sub-cloned, and each clone was subjected to Sanger sequencing. (B) Confirmation ofLATS2KO by western blotting. The anti-LATS2 polyclonal
antibody used recognizes the N-termini of both LATS2 and LATS1. Arrow represents LATS2 signals.
‘*LATS1’indicates LATS1 signals. (C) Gene expression analysis ofCTGF, which is under the control of YAP/ TAZ, showing perturbation of the intrinsic Hippo signal. RT-qPCR was performed in two independent experiments, and mRNA levels were normalized toACTB; Error bars show standard deviation (SD). (D) Left: Scatter plot of RNA-seq data comparingLATS2KO and wild type HeLa-S3 cells. DEGs (2-fold, p-value
<0.05) are highlighted in black dots. Right: Scatter plot of microarray data comparing LATS2 knockdown and control siRNA HeLa-S3 cells. DEGs (1.4-fold, probes expressing in both samples [i.e.,
‘wellAboveBG-FLAG’is TRUE] are highlighted in black dots. (E) Significant overlap of DEGs inLATS2KO
HeLa-S3 cells and HeLa-S3 cells treated with siRNA targeting LATS2. DEGs inLATS2KO and siLATS2 HeLa-S3 cells were subjected to NextBio analysis. Venn diagrams show the number of common and unique genes in both sets. Bar plots show the significance of overlap in each direction. (F) Gene expression analysis for a series of DEGs inLATS2KO HeLa-S3 cells and LATS2 knockdown HeLa-S3 cells. RT-qPCR was
performed in two independent experiments, and the levels of each transcript were normalized toACTB; Error bars show SD.
relevance of this module, we next calculated the enrichment of gene ontology (GO) terms using‘Canonical pathways’in the NextBio statistical platform [28] for genes in the
H3K27me3-loss module. Indeed, the H3K27me3-loss module exhibited significant enrichment in GO terms related to neural functions (Fig3C). This intriguing enrichment might reflect the specific function of this module in these contexts or tissues (discussed in more detail inS1
File). We next performed an add-back rescue experiment by constructing cell lines in which LATS2 was stably expressed (Fig3D). GSEA of RNA-seq data of the rescuedLATS2KO cells revealed that cells expressing wild type LATS2 (WT), but not a kinase-dead form of LATS2 (KD), re-repressed the genes in the H3K27me3-loss module (WT: enrichment score = -0.583, KD: enrichment score = 0.344, p-value<0.001) (Fig3Eand3F). This observation supports
the idea that LATS2 depletion causes downregulation of PRC2 and H3K27me3 signatures, and that this phenotype is dependent on LATS2 kinase activity.
LATS2
knockout causes downregulation of PRC2 at both the mRNA and
protein levels
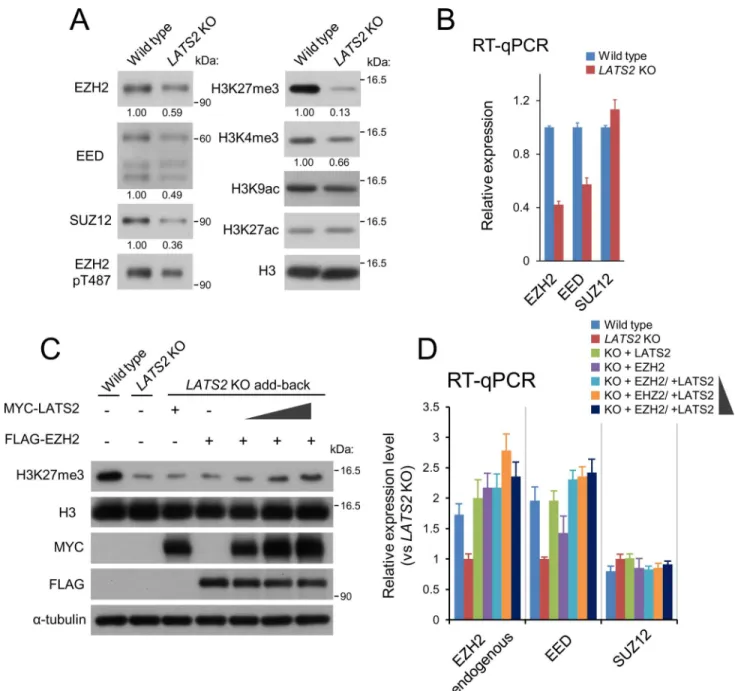
Next, to determine howLATS2knockout causes genome-wide downregulation of H3K27me3, we characterized the state of PRC2 inLATS2-KO HeLa-S3 cells. Immunoblotting of the solubi-lized chromatin fraction revealed that the levels of three core components of PRC2 (EZH2, SUZ12, and EED) were reduced inLATS2-KO cells (Fig4A). Consistent with the ChIP-seq analysis, immunoblotting of whole chromatin revealed a significant reduction in H3K27me3 (13% of wild-type level) (Fig4A). RT-qPCR revealed that PRC2 was also downregulated at a transcriptional level; specifically, expression of EZH2 (42% of the wild-type level) and EED (57%), but not SUZ12, was reduced uponLATS2knockout (Fig4B). Moreover, to confirm the effects of LATS2 and EZH2 on genome-wide H3K27me3 level and the transcription level of PRC2, we performed another add-back rescue experiment. Transient add-back of LATS2 and/ or EZH2 revealed that co-overexpression of LATS2 and EZH2 restored the reduction of H3K27me3 inLATS2-KO cells in a LATS2 dose–dependent fashion, although transient over-expression of LATS2 or EZH2 alone exerted no effect on global H3K27me3 level (Fig4C). It should also be noted that overexpression of LATS2 or EZH2 increased endogenous transcrip-tion of EZH2 and EED (Fig4D). These results suggest that a threshold amount of EZH2 is required to restore the global H3K27me3 level.
Down-regulation of PRC2 in LATS2 KO cells is not due to cell cycle
aberrations
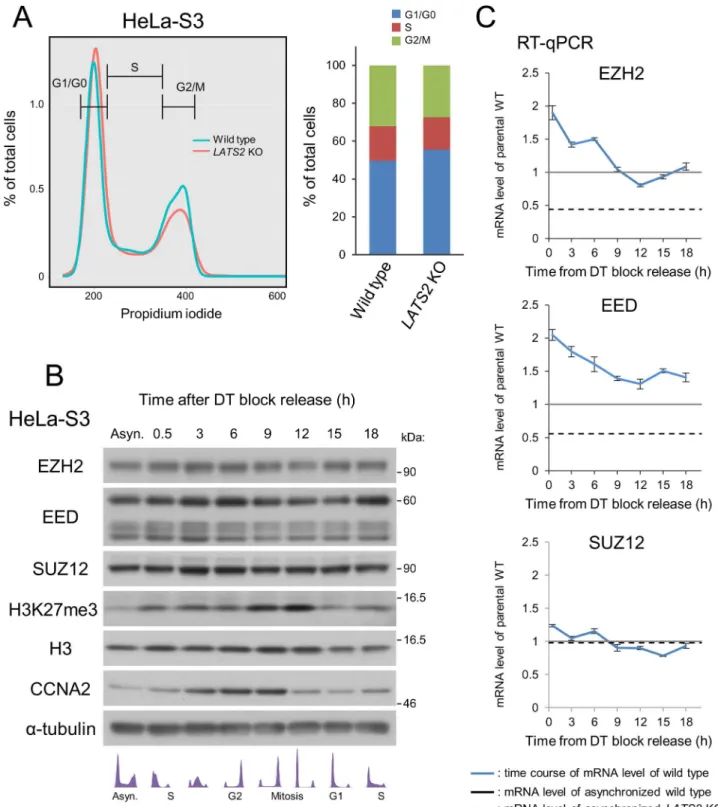
Although LATS2 is a mitotic kinase involved in the G1/S and tetraploidy checkpoints [2,3], downregulation of PRC2 was not a result of cell-cycle retention due toLATS2knockout, as flow cytometry analysis revealed no significant difference in cell-cycle progression between asynchronous wild type andLATS2-KO cells (Fig5A).
Fig 2. Dysregulation of H3K27me3 regulation uponLATS2KO.(A) GSEA ofLATS2KO HeLa-S3 cells for gene sets related to H3K27me targets. Genes are ranked by fold change in a RNA-seq experiment (KO vs. wild type). A positive enrichment score indicates higher expression afterLATS2KO. (B) Immunofluorescence showing reduction of global H3K27me3 inLATS2KO HeLa-S3 cells relative to the wild type. RNAPII and nuclei
were counterstained. Bar indicates 50μm. (C) Snapshots of ChIP-seq traces for H3K27me3 in the wild type HeLa-S3 (green) andLATS2KO cells (red). TheHOXAgene cluster is depicted as a representative locus showing a reduction of H3K27me3 followingLATS2KO. (D) Aggregate plots of H3K27me3 ChIP-seq signals centered at TSSs of all RefSeq genes in wild type HeLa-S3 (green) andLATS2-KO cells (red). (E) ChIP-qPCR analysis for H3K27me3 on a series of known PRC2 target loci. All ChIP experiments were performed at least twice independently; error bars show SD.
Furthermore, in wild type HeLa-S3 cells, PRC2 expression was not reduced at either the protein or mRNA level during time-course monitoring, though the level of H3K27me3 oscil-lates during the cell cycle, possibly reflecting an increase in the chromatin content per cell fol-lowed by DNA replication. (Fig5Band5C). These observations suggest that down-regulation of PRC2 and H3K27me3 upon LATS2 knockout is not due to cell-cycle aberrations caused by LATS2 depletion. One possible explanation of the molecular mechanisms underlying tran-scriptional regulation of EZH2 and EED is that other epigenetic mechanisms are perturbed by PRC2 dysfunction uponLATS2KO. Indeed, we detected moderate genome-wide reduction of H3K4me3 (Fig A inS1File). Consistent with the RT-qPCR results inFig 4B, further analysis revealed a trend toward downregulation of H3K4me3 atEZH2andEED, but not theSUZ12 locus, inLATS2KO cells (Fig A inS1File).
LATS2 kinase affects histone methyltransferase activity of PRC2
Inhibition of histone methyltransferase (HMTase) activity of EZH2 by small molecules such as 3-deazaneplanocin A not only reduces the catalytic ability of this protein, but also downregu-lates its transcription via negative-feedback mechanisms [29], suggesting downregulation of HMTase activity uponLATS2KO. Indeed, the significant reduction in H3K27me3 level could not be explained by reduction of PRC2 expression alone. ChIP-qPCR analysis of EZH2 revealed that the magnitude of reduction in the occupancy of EZH2 at PRC2 target loci (ana-lyzed inFig 2E) was relatively moderate (Fig6A). To determine whether HMTase activity was also affected inLATS2KO cells, we performedin vitroHMTase assays using recombinant H3.1 and endogenous immunoprecipitated EZH2 from each sample. The results revealed a decrease in methyltransferase activity inLATS2KO cells (60% of wild-type activity; normalized to the amount of EZH2 protein in each tube) (Fig6B). Furtherin vitroHMTase assays using the add-back cell lines revealed that HMT activity was affected by LATS2 kinase activity (2.3-fold higher in the WT than in the KD mutant) (Fig6C). These results suggest that HMTase activity of EZH2 is positively regulated by LATS2 kinase.
LATS2 associates with PRC2 and phosphorylates it on chromatin
The data presented above suggest that LATS2 somehow affects PRC2 function. One simple explanatory model is that LATS2 phosphorylates PRC2 on chromatin, thereby supporting or specializing its function. Indeed, previous studies suggested that EZH2 undergoes several post-translational modifications including phosphorylation. To investigate this possibility, we first validated whether LATS2 localizes on chromatin. Immunoblotting analysis of the chromatin-bound fraction revealed that LATS2, but not LATS1, was present in the chromatin fraction of HeLa-S3 and MDA-MB231 cells (Fig7A, Fig B inS1File), consistent with a previous study showing that LATS2, but not LATS1, binds to chromatin along with effectors of Wnt signalingFig 3. ChIP-seq profiling for LATS2-dependent H3K27me3 targets.(A) Top: Venn diagram showing the overlap of genes with H3K27me3 peaks within±5 kb of the TSS in wild type (blue) andLATS2KO HeLa-S3 cells (black). Bottom: Aggregate plots of H3K27me3 ChIP-seq signals centered at TSSs of RefSeq genes for each module of wild type (solid line) andLATS2KO HeLa-S3 cells (dashed line). (B) GSEA ofLATS2KO HeLa-S3 cells, for genes withLATS2KO–responsive H3K27me3 marks in their promoters. Genes are ranked by fold change, derived from the RNA-seq experiment (KO vs. wild type). A positive enrichment score indicates increased expression after
LATS2KO. (C) GO enrichment analysis of canonical pathways for LATS2-dependent H3K27me3 targets. The x-axis represents statistical significance. The y-axis represents gene sets belonging to 'canonical pathways' from MSigDB (Broad Institute). (D) Western blotting of whole cell lysate of rescuedLATS2KO HeLa-S3 cells. Phosphorylated YAP was blotted as an indicator of LATS2 kinase activity. EV, empty
vector. WT, kinase active. KD, kinase-inactive mutant. (E) GSEA of rescuedLATS2KO HeLa-S3 cells, for genes withLATS2-KO–
responsive H3K27me3 marks in their promoters. Left: cells rescued by kinase active (WT) LATS2. Right: cells rescued by kinase-inactive (KD) LATS2. Genes are ranked by fold change, derived from the RNA-seq experiment (LATS2 add-back vs. empty vector). A positive enrichment score indicates increased expression upon LATS2 add-back.
[12]. This result also suggests that LATS2 exerts some functions on chromatin that are distinct from those of LATS1. To determine whether LATS2 associates with PRC2, we immunoprecipi-tated LATS2 and PRC2 core components. Because the absolute level of endogenous LATS2 on chromatin is very low relative to that of PRC2, we performed the immunoprecipitation
Fig 4.LATS2KO downregulates PRC2 at both the protein and mRNA levels.(A) Polycomb components and major histone marks followingLATS2KO. The chromatin-bound fraction was subjected to western blotting. (B) Gene expression analysis for the core components of PRC2: EZH2, EED, and SUZ12. RT-qPCR was performed in two independent experiments, and transcript levels were normalized against
ACTB; Error bars show SD. (D) Western blotting of rescuedLATS2KO cells by transient overexpression of MYC-tagged LATS2 and/or FLAG-tagged EZH2. The synergetic effects and the dose dependency of LATS2 were evaluated by increasing amounts of LATS2. (E) Gene expression analysis for the core components of PRC2 in the same setup in (D). The expression level of endogenous EZH2 was quantified by using primers targeted 3’UTR region of mRNA. RT-qPCR was performed in two independent experiments, and transcript levels were normalized againstACTB; Error bars show SD.
doi:10.1371/journal.pone.0158562.g004
Fig 5. Downregulation of PRC2 uponLATS2KO is not due to cell cycle aberrations.(A) No differences in the cell cycle were observed in HeLa-S3 cells upon KO. Cell-cycle analysis by FACS showing that growing, asynchronousLATS2KO HeLa-S3 cells do not exhibit retention at any stage of the cell cycle. (B) Western blotting of PRC2 components and the H3K27me3 mark in wild type HeLa-S3 cells throughout the cell cycle.α-tubulin and H3 were used as loading controls, and CCNA2 was used as a cell-cycle indicator. A portion of the cells was analyzed by FACS, and is depicted in the bottom panel. (C) RT-qPCR analysis of PRC2 components in wild type HeLa-S3 cells. Black line and dotted line indicate the expression level of each gene in asynchronous wild type andLATS2KO HeLa-S3 cells, respectively. The expression levels of EZH2 and EED oscillate during the cell cycle but do not reach the level attained inLATS2KO cells. Each transcript
level was normalized againstACTB; Error bars show SD.
experiment in HeLa-S3 cells overexpressing FLAG-tagged LATS2. We detected an association between FLAG-tagged LATS2 and endogenous EZH2 (Fig7B).
To determine whether LATS2 can phosphorylate PRC2, we performedin vitrokinase assays using a Phos-tag–based technique. EZH2 and SUZ12 exhibited a phosphorylation-dependent motility shift in the presence of LATS2, but not LATS1 (Fig7Cand7D). Based on the immu-noprecipitation results, we performed further analyses of EZH2. To determine whether phos-phorylation of EZH2 is affected in a kinase-dependent fashion in living cells, we performed an in vivokinase assay using add-back cells overexpressing FLAG-tagged EZH2. We detected a motility shift in add-back cells expressing WT LATS2 but not KD LATS2 (Fig7E). In the cellu-lar Phos-tag analysis, the shifted band was broad and smeared (Fig7E), suggesting that LATS2 may phosphorylate EZH2 on multiple sitesin vivo. Based on these findings, we conclude that LATS2 associates with PRC2 on chromatin and phosphorylates it to regulate its functions (Fig
7F).
An insight of biological functions of LATS2
–
PRC2 axis in normal
development and tumorigenesis
Finally, we attempted to examine whether the LATS2–responsible PRC2 signal in HeLa-S3, i.e., H3K27me3-loss module, was fluctuated in specific cells and/or tissues. Although genes in this module were derived from analysis of HeLa-S3, a cervical cancer cell line, we found a series of functional correlation of this module with neural differentiation processes (Figs C–E inS1
File). Indeed, further analysis of glioblastoma multiforme (GBM), the most common and most aggressive malignant primary brain tumor, supports the possibility of LATS2 for tumorigenesis through PRC2 (Figs F and G inS1File). Consistent with these observations, we previously reported thatLats2-null mice exhibit developmental defects in the central nervous system [30]. Furthermore, our microarray analysis ofLats2KO mouse embryonic fibroblasts also showed upregulation of genes under control of PRC2 (Figs H–J inS1File).
Discussion
Many studies have shown that PRC2 and other epigenetic coordinators play fundamental roles in stemness maintenance, development, and tumorigenesis [19,20]. These discoveries were made possible in large part by advances in high-throughput sequencing technologies. Accord-ingly, massive epigenome datasets from many cell types were generated by global projects such as the ENCODE consortium [31]. Despite the increased availability of public datasets, these data primarily consist of‘snapshot’images of specific targets and cell lines. On the other hand, due to the challenges of characterizing the multiple key components of each complex and searching for novel accessory components [32–37], the upstream signals and downstream
Fig 6. LATS2 affects HMTase activity of PRC2 in kinase dependent fashion.(A) ChIP-qPCR analysis for EZH2 in a series of known PRC2 targets assessed inFig 2E. The MYT1 locus and GAPDH locus are positive and negative control regions for EZH2, respectively. All ChIP experiments were performed at least twice independently; error bars show SD. (B)In vitroHMTase assay with immunoprecipiated EZH2 ofLATS2KO
cells. Endogenous PRC2 was purified by immunoprecipitation of active chromatin fraction of each cell line. The background H3K27me3-level was validated in no-substrate setup. The amount of EZH2 protein in IP-input was titrated beforehand, the equivalent EZH2 between samples was used for HMTase reaction. Each H3K27me3 level was normalized by the signal of immunoprecipitated EZH2. (C)In vitroHMTase assay with
immunoprecipiated EZH2 of each add-back cell line. Endogenous PRC2 was purified by immunoprecipitation of active chromatin fraction of each add-back cell line. The background H3K27me3-level was validated in no-substrate setup (Negative control; Neg. Ctrl.), and HMTase activity of each add-back cell line was evaluated by western blotting (HMTase reaction; HMT rxs.). EV, empty vector. WT, kinase active. KD, kinase-inactive mutant. Each H3K27me3 level was normalized by the signal of immunoprecipitated EZH2.
specificity of these factors remain poorly understood at a molecular level. Based on many stud-ies of epigenomic profiles, including analyses of DNA methylation patterns, histone modifica-tion states, and higher-order chromatin conformamodifica-tion, it is clear that many human diseases, including cancers, are associated with changes in the epigenetic landscape. Indeed, novel drugs have been developed to inhibit the enzymes that regulate the epigenetic machinery [38–42]. However, the epigenetic signatures targeted by these drugs differ across cell types and tissues. To overcome this problem, current drugs target known somatic mutations of epigenetic regula-tors in order to ensure specificity. In light of this situation, it is clear that understanding the upstream signals of epigenetic regulators will be necessary to achieve more effective and accu-rate clinical applications.
In this study, we showed that LATS2, a pivotal Ser/Thr kinase of the Hippo signaling path-way, is a novel upstream regulator of PRC2 (illustrated inFig7F). The association ofLats kinase with Polycomb genes was first identified inDrosophila: a mutant ofWts, the Drosophila homolog of Lats1/2, phenocopies the effect of Polycomb group (PcG) mutants on dendrite neuron maintenance [43], but no further precise characterization was performed. Thus, our findings in this study expand the role of LATS2 in epigenetic coordination fromDrosophilato higher organisms. Indeed the preliminary analyses of LATS2-dependent H3K27me3 module which was obtained by ChIP-seq ofLATS2KO HeLa-S3 cells and cancer genomics data from TCGA (The Cancer Genome Atlas) cohorts, suggest the possibility of LATS2–PRC2 axis in mammalian nervous system including tumorigenesis (Discussed in detail inS1File). An essen-tial function of LATS2 in this tissue is also indicated by observations in knockout mice:Lats2 -null mice exhibit embryonic lethality due to developmental defects in the central nervous sys-tem [30]. The molecular basis of this intriguing insight should be addressed in detail in the future. Downregulation of PRC2 components was observed at both the protein and mRNA lev-els inLATS2KO HeLa-S3 cells. Although the HMTase activity of PRC2 was affected by LATS2 kinase (Fig6Band6C), the molecular mechanisms underlying transcriptional regulation of EZH2 and EED remain obscure (Fig 4Band4D). ChIP-seq analysis for H3K4me3-mark sug-gests that active histone modification was also reduced uponLATS2KO (Fig A inS1File). The next challenge is to elucidate the crosstalk of these epigenetic mechanisms (H3K27me3 and H3K4me3 etc.) dependent on LATS2 kinase.
Conclusions
In summary, our genome-wide analysis ofLATS2KO HeLa-S3 cells reveals a novel functional link between LATS2 and PRC2 to maintain H3K27me3 integrity. LATS2 associates with PRC2 on chromatin and phosphorylates it. LATS2 kinase affects HMTase ability of PRC2 and also downregulates their expression at both the protein and transcription level. Taken together, our results suggest a novel role of LATS2 in maintenance of appropriate epigenetic integrity.
Fig 7. LATS2 associates with PRC2 and phosphorylates EZH2 on chromatin.(A) Western blotting of LATS2 inLATS2KO HeLa-S3 cells. Arrow represents LATS2 signals.‘*LATS1’indicates LATS1 signals. (B) Co-immunoprecipitation of
endogenous PRC2 with FLAG-tagged LATS2 from transiently transfected HeLa-S3 cells. Input represents 10% of the total solubilized chromatin fraction used for each immunoprecipitation. Right, anti-FLAG precipitates immunoblotted to detect FLAG-tagged proteins and endogenous PRC2. EV, empty vector. WT, kinase active. KD, kinase-dead mutant. The asterisk represents non-specific signals. (C) Phos-tag–basedin vitrokinase assay demonstrating that LATS2 can phosphorylate PRC2.
Recombinant PRC2 complex was incubated with recombinant LATS2 in the presence of ATP. Phosphorylation of PRC2 components was assessed by western blotting in the presence of Phos-tag. The asterisks indicate phosphorylation-dependent motility shifts. Phosphatase treatment demonstrated that the motility shift was dependent upon phosphorylation. (D) Phos-tag–
basedin vitrokinase assay including recombinant LATS1 kinase. (E) Phos-tag–based western blotting of add-back cells overexpressing FLAG-tagged EZH2. The dagger (†) indicates the phosphorylation-dependent motility shift. The arrow indicates LATS2 signals.‘*LATS1’indicates LATS1 signals. EV, empty vector. WT, kinase active. KD, kinase-dead mutant. (F) Model of the LATS2 signal that supports PRC2 functions.
Materials and Methods
Cell culture
Lats2-deficient MEFs were described in our previous study [30]. MEFs, HeLa-S3, MCF7, and MDA-MB231 cells were cultured in DMEM containing 10% FBS and antibiotics (streptomycin and penicillin) at 37°C in a 5% CO2/95% air atmosphere. Cells were seeded the day before drug treatment.
Generation of TALEN-mediated LATS2-knockout HeLa-S3 cell line
The ORFs for TALEN targeting the human LATS2 locus (Forward: hg19_chr13:21,620,130–21,620,148, and Reverse: hg19_chr13:21,620,095–21,620,113) were synthesized by GeneArt (Life Technologies, Danvers, MA, USA). The Bowtie software was used to confirm that the tar-get sites were unique in the human genome (hg19). The coding region of this entry clone was sub-cloned into an expression vector, pDEST26 (Life Technologies, Danvers, MA, USA), using the Gateway technology. The two resultant expression constructs were transfected into HeLa-S3 cells using Lipofectamine 2000 (Life Technologies, Danvers, MA, USA). Clones derived from single cells were expanded as candidate knockout cell lines. Successful knockout of LATS2 was validated by endonuclease assay, Sanger sequencing of the target locus, and immu-noblotting analysis. The primer sets used are provided in theS7 Table.
Generation of add-back rescued cell lines derived from
LATS2
KO
HeLa-S3 cells
Expression constructs encoding theLATS2wild type (WT) or kinase-dead (KD) (K698M) mutant were transfected intoLATS2-KO HeLa-S3 cells using Lipofectamine 2000 (Life Tech-nologies, Carlsbad, CA, USA). After 2 weeks of selection with 800μg/ml G418 (Nacalai Tesque,
Kyoto, Japan), clones derived from single cells were expanded as candidate add-back clones. Stable expression of the exogenousLATS2genes was validated by western blotting analysis.
Plasmids
3xFLAG and 6xMYC-tagged human LATS2 wild type (WT) and kinase-dead (KD, K698M) were described in our previous studies [5,6]. pcDNA3.1-human LATS2 WT and KD plasmids for generation of stable expressing cell lines were constructed by subcloning each ORF into pcDNA3.1+AscI, a modified version of pcDNA3.1(+). cDNA of human EZH2 was PCR ampli-fied from HEK293T cDNA pool and ligated into theAscI andNotI sites of p3Flag+AscI, a modified version of p3xFLAG-CMV-7.1. All PCR amplified sequences were confirmed by Sanger DNA sequencing.
Antibodies
The antibodies used for western blotting, co-immunoprecipitation and ChIP experiments in this study are provided inS9 Tablein detail.
Western blotting
membranes were blocked in 5% nonfat milk or BSA in TBS-T at room temperature for 1 h with gentle shaking. The membranes were then immunoblotted with specific primary antibod-ies and horseradish peroxidase–conjugated secondary antibodies (Cell Signaling Technology, Danvers, MA, USA), and then visualized with Western Lightning Plus-ECL (PerkinElmer, Waltham, MA, USA). The ratios of the band intensities were determined with the ImageJ soft-ware using X-ray films with non-saturated signals for the samples being compared.
Chromatin fractionation and co-immunoprecipitation
Preparation of the chromatin-associated protein fractionation was performed as described pre-viously [44]. Briefly, cells were harvested and lysed for 45 min on a rotator at 4°C in buffer A (50 mM Tris-HCl [pH 7.5], 1 mM DTT, and 0.5% Triton X-100, supplemented with 1× prote-ase inhibitor cocktail containing no EDTA [Sigma-Aldrich, St. Louis, MO, USA]). After centri-fugation at 1800 g at 4°C for 10 min, pellets were washed twice with buffer A, resuspended in buffer B (50 mM Tris-HCl [pH 8.0] and 1.5 mM CaCl2), and finally treated with 30 units of micrococcal nuclease (Takara Bio, Shiga, Japan) for 35 min at 37°C under mild agitation. Solu-bilized proteins were clarified by two rounds of centrifugation at 5000 g at 4°C for 2 min. Before immunoprecipitation, the chromatin fraction was adjusted to a final concentration of 150 mM sodium chloride and 0.5% Triton X-100. Equal amounts of solubilized chromatin were incubated with the appropriate primary antibody at 4°C overnight, followed by addition of 30μl of Dynabeads M-280 Sheep Anti-Mouse/Rabbit IgG (Life Technologies, Carlsbad, CA,
USA) pre-blocked with 5% BSA in IP buffer. The beads were washed four times with Tris-buff-ered saline (TBS) containing 0.1% Triton X-100 and 0.25% NP-40. Finally, purified proteins were eluted in Laemmli buffer and subjected to western blotting.
In vitro
kinase assay
Recombinant EZH2/EED/SUZ12/RbAp48/AEBP2 complex (BPS Bioscience, San Diego, CA, USA) (700 ng) was incubated with 100 ng of recombinant LATS2 or LATS1 kinases (Carna Biosciences, Hyogo, Japan) at 30°C for 30 min with kinase reaction buffer (5 mM MOPS--NaOH [pH 7.2], 5 mM magnesium chloride, 1 mM EGTA, 0.4 mM EDTA, 5 mM glycerol 2-phosphate, 50μM DTT, and 50μM ATP). For protein phosphatase (PPase) assay, 200 U of λ-PPase (New England Biolabs, Ipswich, MA, USA) was added to the kinase reaction tube.
Each reaction was carried out in a 25μl volume. The reaction was stopped by addition of 4×
Laemmli sample buffer. Proteins were separated by SDS-PAGE in gels containing 50μM
Phos-tag acrylamide (WAKO, Osaka, Japan) and subjected to western blotting.
In vivo
kinase assay
To verify the effects of LATS2 kinase activity on the phosphorylation state of EZH2 in cells, FLAG-tagged human EZH2 was transiently overexpressed in each add-back cell line using Lipofectamine (Life Technologies, Carlsbad, CA, USA) and PLUS reagents (Life Technologies, Carlsbad, CA, USA). Whole-cell lysates were generated 48 h after transfection. Proteins were separated by SDS-PAGE in gels containing 50μM Phos-tag acrylamide (WAKO, Osaka,
Japan) and subjected to western blotting as described above.
In vitro
histone methyltransferase assay
chromatin were incubated with 2μg of anti-EZH2 antibody (Active Motif, Carlsbad, CA, USA)
and 20μl of Dynabeads M-280 Sheep Anti-Mouse IgG (Life Technologies, Carlsbad, CA, USA)
at 4°C for 4 h. The beads were washed two times with ChIP buffer (10 mM Tris-HCl [pH 8.0], 200 mM KCl, 1 mM CaCl2, and 0.5% NP-40), two times with Wash buffer (10 mM Tris-HCl [pH 8.0], 500 mM KCl, 1 mM CaCl2, and 0.5% NP-40), and once with HMTase buffer (20 mM phosphate buffer [pH 7.4] and 0.05% Tween-20). The immunoprecipitated protein was incu-bated at 30°C for 3 h in 30μl of HMTase buffer containing 1μg of recombinant histone H3.1
protein (New England Biolabs, Ipswich, MA, USA) as substrate and 40μM
S-adenosylmethio-nine (SAM) (New England Biolabs, Ipswich, MA, USA) as the methyl donor. The reaction was stopped by addition of 10μL of 4× Laemmli sample buffer. Proteins were separated by
SDS-PAGE and subjected to western blotting. Each western blotting signal was quantified using the ImageJ software as described above, and the H3K27me3 level was normalized to the immunoprecipitated EZH2 protein signal.
Rescue of LATS2-KO by transient expression of LATS2 and/or EZH2
MYC-tagged LATS2 and/or FLAG-tagged EZH2 were transiently overexpressed in LATS2-KO HeLa-S3 cells using Lipofectamine (Life Technologies, Carlsbad, CA, USA) and PLUS reagents (Life Technologies, Carlsbad, CA, USA). To evaluate the synergetic effects and the dose depen-dency of LATS2, the amount of co-transfected LATS2-plasmid was continuously increased up to the amount used for LATS2 transfection alone. Whole-cell lysates were generated 48 h after transfection and analyzed by western blotting.Cell-cycle analysis
HeLa-S3 cells were synchronized by the double thymidine-block method and collected at vari-ous time points. A portion of the cells was fixed by incubating cells in cold 70% (w/v) ethanol at 4°C for 30 min with brief vortexing. The fixed cells were washed with PBS (-), treated with a propidium iodide solution containing RNase A, and sorted on a FACSCalibur flow cytometer (Becton Dickinson, Franklin Lakes, NJ, USA) using the CellQuest software. Total RNA and whole protein lysates were extracted from the remaining cells using QIAzol Lysis Reagent (Qia-gen, Hilden, Germany) and the RNeasy Mini Kit (Qia(Qia-gen, Hilden, Germany). Each sample was subjected to RT-qPCR analysis and western blotting.
RT-qPCR
To quantitate expression of each gene, total RNA was extracted from cell cultures by direct lysis of cells on dishes using the QIAzol Lysis Reagent (Qiagen, Hilden, Germany), followed by RNA purification using RNeasy Mini Kits (Qiagen, Hilden, Germany). cDNAs were synthe-sized using the High-Capacity cDNA Reverse Transcription Kit (Life Technologies, Danvers, MA, USA). Quantitative PCR analysis was performed on a 7900HT Fast Real-Time PCR Sys-tem (Applied BiosysSys-tems), using SYBR Premix Ex Taq II (Tli RNase H Plus) and Premix Ex Taq™(Perfect Real Time) (Takara Bio, Shiga, Japan) for the SYBR Green method and TaqMan assays, respectively. Detailed sequences of the primer sets and the Assay IDs of the TaqMan assays used in this study are provided in theS7andS8Tables.
Microarray analysis
Microarray analyses for coding genes and microRNAs were performed as single-color or two-color hybridizations using Agilent Whole Human/Mouse Genome Oligonucleotide
Agilent Feature Extraction software (v. 10.5.1) was used to assess spot quality and extract fea-ture intensity statistics. The Subio Platform and Subio Basic Plug-in (v1.18) (Subio, Kagoshima, Japan) were used to calculate fold changes between samples. Briefly, to obtain the list of high-confidence expressing genes upon LATS2 knockdown, the spots with wellAboveBG-FLAG = TRUE in each sample group (i.e., probes that were distinguishable from the local background signal across samples) were selected. In addition, a minimum fold change of 1.4 was required for inclusion in the final list of differentially expressed genes. For LATS2-KO MEFs, a fold change2.0 and p<0.05 (t-test) was required for differentially expressed genes. The
microar-ray data were deposited in the Gene Expression Omnibus (www.ncbi.nlm.nih.gov/geo) under accession number GSE63538.
Library preparation and RNA-sequencing
Poly(A)+ RNA was isolated with Nucleo-Trap mRNA kit (Macherey-Nagel, Düren, Germany) and double strand cDNA synthesis was carried out using the double-stranded cDNA using SuperScript double-Stranded cDNA synthesis kit (Invitrogen, Carlsbad, CA, USA) according to manufacturer's instructions. Each double-stranded cDNA (120 ng) was sheared to ~400 bp fragments using an S220 ultrasonicator (Covaris, Woburn, MA, USA) with the following parameter settings: peak incident power, 140 W; duty factor, 10%; cycles per burst, 200; and treatment time, 55 seconds. The resulting DNA fragments were purified using 0.7× volume Agencourt AMPureXP beads (Beckman Coulter, Brea, CA, USA). Illumina libraries were pre-pared using the KAPA Library Preparation Kit (Kapa Biosystems, Wilmington, MA, USA) and TruSeq adaptors (Illumina, San Diego, CA, USA). Paired-end sequencing (151 bp × 2) of each sample was performed on a HiSeq2500 (Illumina, San Diego, CA, USA).
RNA-seq data analysis
Raw images were processed using Real Time Analysis ver. 1.17.21 (Illumina, San Diego, CA, USA), and conversion to fastq file format was performed using CASAVA ver. 1.8.2 (Illumina, San Diego, CA, USA). Btrim (http://graphics.med.yale.edu/trim/readme) was used to trim low-quality regions of raw reads. The trimmed reads were mapped onto the reference human genome (hg19) using TopHat ver. 2.0.11 [46] in combination with Bowtie ver. 2.2.2 [47] and SAMtools ver. 0.1.19 [48]. Gene expression was quantitated with Cufflinks ver. 2.2.1 [49].
ChIP-qPCR
(Life Technologies, Carlsbad, CA, USA) pre-blocked with 5% BSA in sonication buffer. The beads were washed twice each with sonication buffer, high-salt wash buffer (sonication buffer containing 500 mM sodium chloride), LiCl wash buffer (20 mM Tris [pH 8.0], 1 mM EDTA, 250 mM LiCl, 0.5% [w/v] Nonidet P-40, and 0.5% [w/v] sodium deoxycholate), and TE buffer (10 mM Tris [pH 8.0] and 1 mM EDTA). Immunoprecipitates were incubated at 65°C in elu-tion buffer (50 mM Tris-HCl [pH 8.0], 10 mM EDTA, and 1% [w/v] sodium dodecyl sulfate) for 30 min, and then treated with 2μg of Proteinase K (Sigma-Aldrich, St. Louis, MO, USA)
overnight for de-crosslinking. Eluate was purified using the ChIP DNA Purification Kit (Active Motif, Carlsbad, CA, USA). For quantitation, ChIP DNA and input genomic DNA were sub-jected to qPCR on a 7900HT Fast Real-Time PCR System (Applied Biosystems, Waltham, MA, USA), using SYBR Premix Ex Taq II (Tli RNase H Plus) and Premix Ex Taq™(Perfect Real Time) (Takara Bio, Shiga, Japan). Detailed sequences of the primer sets used are provided in theS7 Table.
ChIP-sequencing
ChIP DNA and input DNA ends were repaired using T4 DNA polymerase, Klenow enzyme, and T4 polynucleotide kinase (PNK) (New England Biolabs, Ipswich, MA, USA), followed by treatment with Klenow exo- to add an A base to the 3’-end. After ligation of the Genomic Adaptor Oligo Mix (Illumina, San Diego, CA, USA) using TaKaRa Ligation Mix (Takara Bio, Shiga, Japan), the adaptor-ligated DNA fragments were amplified with Paired-End Sample Prep Oligo primers (Illumina, San Diego, CA, USA) for 18 cycles. The amplified library was separated on a 2.0% agarose gel, and the samples were purified using the QIAquick MinElute kit (Qiagen, Hilden, Germany) after each preparation step. The purified library was used for cluster generation and sequencing analysis on a HiSeq 2000 (Illumina, San Diego, CA, USA). The raw Illumina sequencing data are available from the Gene Expression Omnibus (www. ncbi.nlm.nih.gov/geo) under accession number GSE63538.
ChIP-seq data analysis
Sequence reads for H3K27me3, H3K4me3, and input were aligned to the human genome (hg19) using the Bowtie software (parameter: -v 3–m 1) [50]. The MACS software (ver. 1.4.1) was used for peak detection of each histone mark [27]. The parameters for MACS were‘—
nomodel—extsize 146—broad—to-large—pvalue 1e-3’, and the other parameters were the software defaults. Genes were called in association with a given chromatin mark only when peaks were called within ± 5 kb of the TSS. To calculate normalized depth around TSSs of all RefSeq genes, and to perform GO analysis of the called genes, the Homer software was used with the default settings [51]. P-values were corrected by the FDR (q-value) correction by R for multiple comparisons. To visualize normalized ChIP profiles in genome browser, BigWig files were generated using our custom scripts and visualized using the IGV software from the Broad Institute [51,52]
Immunofluorescence imaging
Exponentially growing HeLa-S3 cells were plated on coverslips and fixed for 15 min at room temperature in 4% formaldehyde in PBS, 0.1% Triton X-100 in PBS(-), and 0.05% Tween-20 in PBS. Fixed cells were rinsed three times in 1× PBS for 5 min each. To visualize H3K27me3 and RNAPII, cells were blocked in blocking buffer (1× PBS, 5% normal serum, and 0.3% Triton X-100) for 60 min, incubated with anti-H3K27me3 (Cell Signaling Technologies, Danvers, MA, USA) and anti-RNA polymerase II clone STD4H8 (Millipore, Billerica, MA, USA) antibodies,
conjugated anti-rabbit/mouse IgG in 1× PBS containing 1% BSA and 0.3% Triton X-100. DNA was stained using Hoechst 33258 (Sigma-Aldrich, St. Louis, MO, USA), and cells were observed on a FluoView FV10i microscope (Olympus, Tokyo, Japan).
Statistical analysis by NextBio
For meta-analysis and exploration of massive preprocessed omics data (reported in previous studies) that exhibited significant correlation with our own data, each processed omics dataset was uploaded into the NextBio enterprise software (Illumina, San Diego, CA, USA), and the statistical significance of the relationships was evaluated as reported previously [28]. For Canonical pathway enrichment analysis, p-values were subjected to FDR (q-value) correction in the R statistical computing environment.
GSEA
To determine whether gene sets of interest were statistically enriched among up- and downre-gulated genes, we analyzed our non-redundant list of genes using GSEA 2.0 for pre-ranked lists [25]. The gene sets used in this study (e.g.‘C2 cgp collection’) were obtained from the Broad Molecular Signatures Database (MSigDB).
Promoter classification
To classify human coding genes by the CG status of their promoters, human coding gene IDs were obtained from Ensembl database. Genes>3 kb in length, with no other genes within 500
bp of their TSSs, were used for the promoter analysis. A BED format file of the filtered genes' promoters (from˗1200 bp to +300 bp relative to the TSS) was generated, and each promoter region was divided into 500 bp sliding windows (5 bp offset), and the CpG ratio and CG% were calculated using Bedtools [53]. Next, each promoter was classified into one of three types according to the criteria described in previous studies [54]. The resultant lists of genes were uploaded into the NextBio platform and subjected to successive statistical analyses. For statisti-cal analysis of RNA-seq data, fold changes were statisti-calculated for each actively transcribed gene, and then the Wilcoxon rank-sum test was performed to evaluate statistical significance.
Analysis of TCGA data
To visualize expression patterns of LATS1 and LATS2 genes in many types of human cancers, PANCAN normalized RNA-seq data from the TCGA project were downloaded from the Can-cer Browser website. CanCan-cer datasets with at least one normal solid tissue sample were visual-ized as box-and-whisker plots. For analysis of glioblastoma multiforme (GBM) samples, level 3 preprocessed expression data from Agilent 244K custom gene expression G4502A_07_2 microarrays of 483 clinical samples, along with the corresponding clinical data, were down-loaded from the TCGA Data Portal. Data were visualized as box-and-whisker plots for each sample group, and the Wilcoxon rank-sum test was performed to evaluate statistical signifi-cance; Kaplan–Meier survival analysis followed by a log-rank test was performed using the
‘survival’package in R. For GSEA analysis of the aggregated expression profile based on LATS2 expression level, a non-redundant list of genes was generated based on the mean fold change, and then GSEA for pre-ranked lists was performed as described above.
Ingenuity Pathways Analysis
the three microarray experiments were subjected to IPA software with default setting, then sig-nificance of the canonical pathways related to differentiation processes were visualized in heat-maps according to calculated z-value.
Supporting Information
S1 File. Supporting Information.
(PDF)
S1 Table. Differentially expressed genes inLATS2KO HeLa-S3 cells. (XLSX)
S2 Table. Differentially expressed genes in HeLa-S3 cells upon LATS2 knockdown.
(XLSX)
S3 Table. Top 25 gene sets positively enriched inLATS2KO HeLa-S3 cells (XLSX)
S4 Table. LATS2-dependent H3K27me3 targets inLATS2KO HeLa-S3 cells. (XLSX)
S5 Table. Differentially expressed genes inLats2KO MEFs. (XLSX)
S6 Table. Differentially Expressed Genes of MEFs in a Hippo-inactive state.
(XLSX)
S7 Table. Primer sequences used in this study.
(XLSX)
S8 Table. TaqMan probes used in this study.
(XLSX)
S9 Table. Antibodies used in this study.
(XLSX)
Acknowledgments
We thank Dr. Patrick Hughes (Bioedit) for critically reading the manuscript. We also thank Dr. C. Oneyama, Dr. H. Fujii, and Dr. T. Fujita for valuable technical advice and discussions. This work was supported by the Ministry of Education, Culture, Sports, Science, and Technol-ogy of Japan (Scientific Research B 23370086 [to HN], Scientific Research C 22570185 [to NY], and Research Fellowships for Young Scientists 255951 [to KT]), and by Project MEET, Osaka University Graduate School of Medicine (to DO).
Author Contributions
Conceived and designed the experiments: KT DO HN. Analyzed the data: DO. Wrote the paper: KT DO. Performed DNA microarray analysis: DO. Performed initial experiments using MEFs: SM NY. Performed RNA-sequencing: DM SN. Performed ChIP-sequencing: YO. Con-ducted bioinformatics analyses: KT AH FO. Guided the project and discussed results of the
References
1. Visser S, Yang X. LATS tumor suppressor: a new governor of cellular homeostasis. Cell Cycle. 2010; 9 (19):3892–903. PMID:20935475.
2. Aylon Y, Michael D, Shmueli A, Yabuta N, Nojima H, Oren M. A positive feedback loop between the p53 and Lats2 tumor suppressors prevents tetraploidization. Genes Dev. 2006; 20(19):2687–700. doi: 10.1101/gad.1447006PMID:17015431; PubMed Central PMCID: PMCPMC1578695.
3. Li Y, Pei J, Xia H, Ke H, Wang H, Tao W. Lats2, a putative tumor suppressor, inhibits G1/S transition. Oncogene. 2003; 22(28):4398–405. doi:10.1038/sj.onc.1206603PMID:12853976.
4. Reuven N, Adler J, Meltser V, Shaul Y. The Hippo pathway kinase Lats2 prevents DNA damage-induced apoptosis through inhibition of the tyrosine kinase c-Abl. Cell Death Differ. 2013; 20(10):1330–
40. doi:10.1038/cdd.2013.83PMID:23852372; PubMed Central PMCID: PMCPMC3770326. 5. Suzuki H, Yabuta N, Okada N, Torigata K, Aylon Y, Oren M, et al. Lats2 phosphorylates p21/CDKN1A
after UV irradiation and regulates apoptosis. J Cell Sci. 2013; 126(Pt 19):4358–68. doi:10.1242/jcs. 125815PMID:23886938.
6. Okada N, Yabuta N, Suzuki H, Aylon Y, Oren M, Nojima H. A novel Chk1/2-Lats2-14-3-3 signaling path-way regulates P-body formation in response to UV damage. J Cell Sci. 2011; 124(Pt 1):57–67. doi:10. 1242/jcs.072918PMID:21118956.
7. Yabuta N, Mukai S, Okada N, Aylon Y, Nojima H. The tumor suppressor Lats2 is pivotal in Aurora A and Aurora B signaling during mitosis. Cell Cycle. 2011; 10(16):2724–36. PMID:21822051.
8. Yabuta N, Fujii T, Copeland NG, Gilbert DJ, Jenkins NA, Nishiguchi H, et al. Structure, expression, and chromosome mapping of LATS2, a mammalian homologue of the Drosophila tumor suppressor gene lats/warts. Genomics. 2000; 63(2):263–70. doi:10.1006/geno.1999.6065PMID:10673337. 9. Aylon Y, Ofir-Rosenfeld Y, Yabuta N, Lapi E, Nojima H, Lu X, et al. The Lats2 tumor suppressor
aug-ments p53-mediated apoptosis by promoting the nuclear proapoptotic function of ASPP1. Genes Dev. 2010; 24(21):2420–9. doi:10.1101/gad.1954410PMID:21041410; PubMed Central PMCID: PMCPMC2964752.
10. Zhang K, Rodriguez-Aznar E, Yabuta N, Owen RJ, Mingot JM, Nojima H, et al. Lats2 kinase potentiates Snail1 activity by promoting nuclear retention upon phosphorylation. EMBO J. 2012; 31(1):29–43. doi: 10.1038/emboj.2011.357PMID:21952048; PubMed Central PMCID: PMCPMC3252572.
11. Powzaniuk M, McElwee-Witmer S, Vogel RL, Hayami T, Rutledge SJ, Chen F, et al. The LATS2/KPM tumor suppressor is a negative regulator of the androgen receptor. Mol Endocrinol. 2004; 18(8):2011–
23. doi:10.1210/me.2004-0065PMID:15131260.
12. Li J, Chen X, Ding X, Cheng Y, Zhao B, Lai ZC, et al. LATS2 suppresses oncogenic Wnt signaling by disruptingβ-catenin/BCL9 interaction. Cell Rep. 2013; 5(6):1650–63. doi:10.1016/j.celrep.2013.11. 037PMID:24360964; PubMed Central PMCID: PMCPMC3897473.
13. Qin H, Blaschke K, Wei G, Ohi Y, Blouin L, Qi Z, et al. Transcriptional analysis of pluripotency reveals the Hippo pathway as a barrier to reprogramming. Hum Mol Genet. 2012; 21(9):2054–67. doi:10.1093/ hmg/dds023PMID:22286172; PubMed Central PMCID: PMCPMC3315209.
14. Aylon Y, Sarver A, Tovy A, Ainbinder E, Oren M. Lats2 is critical for the pluripotency and proper differ-entiation of stem cells. Cell Death Differ. 2014; 21(4):624–33. doi:10.1038/cdd.2013.188PMID: 24413153; PubMed Central PMCID: PMCPMC3950325.
15. Cao R, Wang L, Wang H, Xia L, Erdjument-Bromage H, Tempst P, et al. Role of histone H3 lysine 27 methylation in Polycomb-group silencing. Science. 2002; 298(5595):1039–43. doi:10.1126/science. 1076997PMID:12351676.
16. Czermin B, Melfi R, McCabe D, Seitz V, Imhof A, Pirrotta V. Drosophila enhancer of Zeste/ESC com-plexes have a histone H3 methyltransferase activity that marks chromosomal Polycomb sites. Cell. 2002; 111(2):185–96. PMID:12408863.
17. Kuzmichev A, Nishioka K, Erdjument-Bromage H, Tempst P, Reinberg D. Histone methyltransferase activity associated with a human multiprotein complex containing the Enhancer of Zeste protein. Genes Dev. 2002; 16(22):2893–905. doi:10.1101/gad.1035902PMID:12435631; PubMed Central PMCID: PMCPMC187479.
18. Müller J, Hart CM, Francis NJ, Vargas ML, Sengupta A, Wild B, et al. Histone methyltransferase activity of a Drosophila Polycomb group repressor complex. Cell. 2002; 111(2):197–208. PMID:12408864. 19. Schuettengruber B, Cavalli G. Recruitment of polycomb group complexes and their role in the dynamic
regulation of cell fate choice. Development. 2009; 136(21):3531–42. doi:10.1242/dev.033902PMID: 19820181.
20. Margueron R, Reinberg D. The Polycomb complex PRC2 and its mark in life. Nature. 2011; 469 (7330):343–9. doi:10.1038/nature09784PMID:21248841; PubMed Central PMCID:
21. Bracken AP, Helin K. Polycomb group proteins: navigators of lineage pathways led astray in cancer. Nat Rev Cancer. 2009; 9(11):773–84. doi:10.1038/nrc2736PMID:19851313.
22. Helin K, Dhanak D. Chromatin proteins and modifications as drug targets. Nature. 2013; 502 (7472):480–8. doi:10.1038/nature12751PMID:24153301.
23. Kondo Y. Targeting histone methyltransferase EZH2 as cancer treatment. J Biochem. 2014. doi:10. 1093/jb/mvu054PMID:25179367.
24. Christian M, Cermak T, Doyle EL, Schmidt C, Zhang F, Hummel A, et al. Targeting DNA double-strand breaks with TAL effector nucleases. Genetics. 2010; 186(2):757–61. doi:10.1534/genetics.110. 120717PMID:20660643; PubMed Central PMCID: PMCPMC2942870.
25. Subramanian A, Tamayo P, Mootha VK, Mukherjee S, Ebert BL, Gillette MA, et al. Gene set enrichment analysis: a knowledge-based approach for interpreting genome-wide expression profiles. Proc Natl Acad Sci U S A. 2005; 102(43):15545–50. doi:10.1073/pnas.0506580102PMID:16199517; PubMed Central PMCID: PMCPMC1239896.
26. Ben-Porath I, Thomson MW, Carey VJ, Ge R, Bell GW, Regev A, et al. An embryonic stem cell-like gene expression signature in poorly differentiated aggressive human tumors. Nat Genet. 2008; 40 (5):499–507. doi:10.1038/ng.127PMID:18443585; PubMed Central PMCID: PMCPMC2912221. 27. Feng J, Liu T, Qin B, Zhang Y, Liu XS. Identifying ChIP-seq enrichment using MACS. Nat Protoc. 2012;
7(9):1728–40. doi:10.1038/nprot.2012.101PMID:22936215; PubMed Central PMCID: PMCPMC3868217.
28. Kupershmidt I, Su QJ, Grewal A, Sundaresh S, Halperin I, Flynn J, et al. Ontology-based meta-analysis of global collections of high-throughput public data. PLoS One. 2010; 5(9). doi:10.1371/journal.pone. 0013066PMID:20927376; PubMed Central PMCID: PMCPMC2947508.
29. Tan J, Yang X, Zhuang L, Jiang X, Chen W, Lee PL, et al. Pharmacologic disruption of Polycomb-repressive complex 2-mediated gene repression selectively induces apoptosis in cancer cells. Genes Dev. 2007; 21(9):1050–63. doi:10.1101/gad.1524107PMID:17437993; PubMed Central PMCID: PMCPMC1855231.
30. Yabuta N, Okada N, Ito A, Hosomi T, Nishihara S, Sasayama Y, et al. Lats2 is an essential mitotic regu-lator required for the coordination of cell division. J Biol Chem. 2007; 282(26):19259–71. doi:10.1074/ jbc.M608562200PMID:17478426.
31. Bernstein BE, Birney E, Dunham I, Green ED, Gunter C, et al. An integrated encyclopedia of DNA ele-ments in the human genome. Nature. 2012; 489(7414):57–74. doi:10.1038/nature11247PMID: 22955616; PubMed Central PMCID: PMCPMC3439153.
32. Wei Y, Chen YH, Li LY, Lang J, Yeh SP, Shi B, et al. CDK1-dependent phosphorylation of EZH2 sup-presses methylation of H3K27 and promotes osteogenic differentiation of human mesenchymal stem cells. Nat Cell Biol. 2011; 13(1):87–94. doi:10.1038/ncb2139PMID:21131960; PubMed Central PMCID: PMCPMC3076036.
33. Zeng X, Chen S, Huang H. Phosphorylation of EZH2 by CDK1 and CDK2: a possible regulatory mecha-nism of transmission of the H3K27me3 epigenetic mark through cell divisions. Cell Cycle. 2011; 10 (4):579–83. PMID:21278485; PubMed Central PMCID: PMCPMC3174000.
34. Kaneko S, Li G, Son J, Xu CF, Margueron R, Neubert TA, et al. Phosphorylation of the PRC2 compo-nent Ezh2 is cell cycle-regulated and up-regulates its binding to ncRNA. Genes Dev. 2010; 24 (23):2615–20. doi:10.1101/gad.1983810PMID:21123648; PubMed Central PMCID: PMCPMC2994035.
35. Kaneko S, Bonasio R, Saldaña-Meyer R, Yoshida T, Son J, Nishino K, et al. Interactions between
JARID2 and noncoding RNAs regulate PRC2 recruitment to chromatin. Mol Cell. 2014; 53(2):290–300. doi:10.1016/j.molcel.2013.11.012PMID:24374312; PubMed Central PMCID: PMCPMC4026005. 36. Cifuentes-Rojas C, Hernandez AJ, Sarma K, Lee JT. Regulatory interactions between RNA and
poly-comb repressive complex 2. Mol Cell. 2014; 55(2):171–85. doi:10.1016/j.molcel.2014.05.009PMID: 24882207; PubMed Central PMCID: PMCPMC4107928.
37. Zhao J, Ohsumi TK, Kung JT, Ogawa Y, Grau DJ, Sarma K, et al. Genome-wide identification of poly-comb-associated RNAs by RIP-seq. Mol Cell. 2010; 40(6):939–53. doi:10.1016/j.molcel.2010.12.011 PMID:21172659; PubMed Central PMCID: PMCPMC3021903.
38. Knutson SK, Kawano S, Minoshima Y, Warholic NM, Huang KC, Xiao Y, et al. Selective inhibition of EZH2 by EPZ-6438 leads to potent antitumor activity in EZH2-mutant non-Hodgkin lymphoma. Mol Cancer Ther. 2014; 13(4):842–54. doi:10.1158/1535-7163.MCT-13-0773PMID:24563539. 39. Knutson SK, Wigle TJ, Warholic NM, Sneeringer CJ, Allain CJ, Klaus CR, et al. A selective inhibitor of
EZH2 blocks H3K27 methylation and kills mutant lymphoma cells. Nat Chem Biol. 2012; 8(11):890–6. doi:10.1038/nchembio.1084PMID:23023262.
40. McCabe MT, Ott HM, Ganji G, Korenchuk S, Thompson C, Van Aller GS, et al. EZH2 inhibition as a therapeutic strategy for lymphoma with EZH2-activating mutations. Nature. 2012; 492(7427):108–12. doi:10.1038/nature11606PMID:23051747.
41. Qi W, Chan H, Teng L, Li L, Chuai S, Zhang R, et al. Selective inhibition of Ezh2 by a small molecule inhibitor blocks tumor cells proliferation. Proc Natl Acad Sci U S A. 2012; 109(52):21360–5. doi:10. 1073/pnas.1210371110PMID:23236167; PubMed Central PMCID: PMCPMC3535655.
42. Kim W, Bird GH, Neff T, Guo G, Kerenyi MA, Walensky LD, et al. Targeted disruption of the EZH2-EED complex inhibits EZH2-dependent cancer. Nat Chem Biol. 2013; 9(10):643–50. doi:10.1038/ nchembio.1331PMID:23974116; PubMed Central PMCID: PMCPMC3778130.
43. Parrish JZ, Emoto K, Jan LY, Jan YN. Polycomb genes interact with the tumor suppressor genes hippo and warts in the maintenance of Drosophila sensory neuron dendrites. Genes Dev. 2007; 21(8):956–
72. doi:10.1101/gad.1514507PMID:17437999; PubMed Central PMCID: PMCPMC1847713. 44. Boulay G, Rosnoblet C, Guérardel C, Angrand PO, Leprince D. Functional characterization of human
Polycomb-like 3 isoforms identifies them as components of distinct EZH2 protein complexes. Biochem J. 2011; 434(2):333–42. doi:10.1042/BJ20100944PMID:21143197.
45. Funato Y, Terabayashi T, Sakamoto R, Okuzaki D, Ichise H, Nojima H, et al. Nucleoredoxin sustains Wnt/β-catenin signaling by retaining a pool of inactive dishevelled protein. Curr Biol. 2010; 20 (21):1945–52. doi:10.1016/j.cub.2010.09.065PMID:20970343.
46. Kim D, Pertea G, Trapnell C, Pimentel H, Kelley R, Salzberg SL. TopHat2: accurate alignment of tran-scriptomes in the presence of insertions, deletions and gene fusions. Genome Biol. 2013; 14(4):R36. doi:10.1186/gb-2013-14-4-r36PMID:23618408; PubMed Central PMCID: PMCPMC4053844. 47. Langmead B, Salzberg SL. Fast gapped-read alignment with Bowtie 2. Nat Methods. 2012; 9(4):357–9.
doi:10.1038/nmeth.1923PMID:22388286; PubMed Central PMCID: PMCPMC3322381.
48. Li H, Handsaker B, Wysoker A, Fennell T, Ruan J, Homer N, et al. The Sequence Alignment/Map for-mat and SAMtools. Bioinforfor-matics. 2009; 25(16):2078–9. doi:10.1093/bioinformatics/btp352PMID: 19505943; PubMed Central PMCID: PMCPMC2723002.
49. Trapnell C, Williams BA, Pertea G, Mortazavi A, Kwan G, van Baren MJ, et al. Transcript assembly and quantification by RNA-Seq reveals unannotated transcripts and isoform switching during cell differenti-ation. Nat Biotechnol. 2010; 28(5):511–5. doi:10.1038/nbt.1621PMID:20436464; PubMed Central PMCID: PMCPMC3146043.
50. Langmead B, Trapnell C, Pop M, Salzberg SL. Ultrafast and memory-efficient alignment of short DNA sequences to the human genome. Genome Biol. 2009; 10(3):R25. doi:10.1186/gb-2009-10-3-r25 PMID:19261174; PubMed Central PMCID: PMCPMC2690996.
51. Heinz S, Benner C, Spann N, Bertolino E, Lin YC, Laslo P, et al. Simple combinations of lineage-deter-mining transcription factors prime cis-regulatory elements required for macrophage and B cell identities. Mol Cell. 2010; 38(4):576–89. doi:10.1016/j.molcel.2010.05.004PMID:20513432; PubMed Central PMCID: PMCPMC2898526.
52. Thorvaldsdóttir H, Robinson JT, Mesirov JP. Integrative Genomics Viewer (IGV): high-performance genomics data visualization and exploration. Brief Bioinform. 2013; 14(2):178–92. doi:10.1093/bib/ bbs017PMID:22517427; PubMed Central PMCID: PMCPMC3603213.
53. Quinlan AR, Hall IM. BEDTools: a flexible suite of utilities for comparing genomic features. Bioinformat-ics. 2010; 26(6):841–2. doi:10.1093/bioinformatics/btq033PMID:20110278; PubMed Central PMCID: PMCPMC2832824.