Chronic Protein Restriction in Mice Impacts
Placental Function and Maternal Body
Weight before Fetal Growth
Paula N. Gonzalez1,2☯, Malgorzata Gasperowicz3☯, Jimena Barbeito-Andrés1,2, Natasha Klenin4, James C. Cross3,4
*, Benedikt Hallgrímsson5 *
1Instituto de Genética Veterinaria, CCT-CONICET, La Plata, Argentina,2de Ciencias Naturales y Museo, UNLP, La Plata, Argentina,3Department of Comparative Biology and Experimental Medicine, Faculty of Veterinary Medicine, and the Alberta Children’s Hospital Research Institute, University of Calgary, Calgary, Alberta, Canada,4Department Biochemistry & Molecular Biology, University of Calgary, Calgary, Alberta, Canada,5Department of Cell Biology and Anatomy, Alberta Children’s Hospital Research Institute, and McCaig Institute for Bone and Joint Health. University of Calgary, Calgary, Alberta, Canada
☯These authors contributed equally to this work. *[email protected](BH);[email protected](JC)
Abstract
Mechanisms of resource allocation are essential for maternal and fetal survival, particularly when the availability of nutrients is limited. We investigated the responses of feto-placental development to maternal chronic protein malnutrition to test the hypothesis that maternal low protein diet produces differential growth restriction of placental and fetal tissues, and adaptive changes in the placenta that may mitigate impacts on fetal growth. C57BL/6J female mice were fed either a low-protein diet (6% protein) or control isocaloric diet (20% protein). On embryonic days E10.5, 17.5 and 18.5 tissue samples were prepared for mor-phometric, histological and quantitative RT-PCR analyses, which included markers of tro-phoblast cell subtypes. Potential endocrine adaptations were assessed by the expression of Prolactin-related hormone genes. In the low protein group, placenta weight was signifi-cantly lower at E10.5, followed by reduction of maternal weight at E17.5, while the fetuses became significantly lighter no earlier than at E18.5. Fetal head at E18.5 in the low protein group, though smaller than controls, was larger than expected for body size. The relative size and shape of the cranial vault and the flexion of the cranial base was affected by E17.5 and more severely by E18.5. The junctional zone, a placenta layer rich in endocrine and energy storing glycogen cells, was smaller in low protein placentas as well as the expres-sion ofPcdh12, a marker of glycogen trophoblast cells. Placental hormone genePrl3a1
was altered in response to low protein diet: expression was elevated at E17.5 when fetuses were still growing normally, but dropped sharply by E18.5 in parallel with the slowing of fetal growth. This model suggests that nutrients are preferentially allocated to sustain fetal and brain growth and suggests the placenta as a nutrient sensor in early gestation with a role in mitigating impacts of poor maternal nutrition on fetal growth.
OPEN ACCESS
Citation:Gonzalez PN, Gasperowicz M, Barbeito-Andrés J, Klenin N, Cross JC, Hallgrímsson B (2016) Chronic Protein Restriction in Mice Impacts Placental Function and Maternal Body Weight before Fetal Growth. PLoS ONE 11(3): e0152227. doi:10.1371/ journal.pone.0152227
Editor:Ana Claudia Zenclussen, Medical Faculty, Otto-von-Guericke University Magdeburg, Medical Faculty, GERMANY
Received:September 9, 2015
Accepted:March 10, 2016
Published:March 28, 2016
Copyright:© 2016 Gonzalez et al. This is an open access article distributed under the terms of the
Creative Commons Attribution License, which permits unrestricted use, distribution, and reproduction in any medium, provided the original author and source are credited.
Data Availability Statement:All relevant data are available via Dryad (DOI:10.5061/dryad.n9j60).
Funding:This work was supported by the Canadian Institutes of Health Research 37776 to JC, National Institute of Health 1R01DE021708 and
Introduction
In humans, as in all eutherians, prenatal growth relies on the nutrient supply and gas exchange mediated by the placenta. The inadequate availability of nutrients and/or oxygen for the fetus due to environmental factors such as maternal malnutrition or deficient blood flow caused by placental insufficiency, frequently results in intrauterine growth restriction (IUGR) [1–3]. Although the resulting smaller size has been considered a relatively beneficial adjustment and an adaptive response under stressful conditions [4], IUGR is associated with higher rates of perinatal morbidity and mortality, as well as long term consequences such as obesity, cardio-vascular disease or type II diabetes in human populations [5]. Consequently, there is great interest in understanding which changes occur in feto-placental development under stressful conditions and their adaptive role in sustaining fetal growth as well as the demand of energy for the growth and maintenance of the placenta [6,7]. Animal models provide a valuable tool to gain insight into these questions and have been extensively used to evaluate the effect of dif-ferent perturbations on prenatal development [8,9]. Experiments in rodents support the hypothesis that maternal malnutrition does not affect each fetal tissue to the same extent. In humans as well as in animal models, brain weight and neurocranial size of neonates and adults are usually less affected by nutrient restriction than body weight and facial size, which suggest an adaptive“brain sparing”effect [10–13]. However, direct tests of in utero trade off between tissues are deficient and the available studies in humans usually measure overall fetal and pla-cental weight only [14].
Experimental studies in rats and mice show that isocaloric low protein diets and reduced energy intake throughout gestation induce changes in placental weight and morphology [15– 21]. These effects are highly variable depending on the IUGR model and the gestational age analyzed. Accordingly, it is observed that protein restriction during pregnancy can induce sig-nificant reduction in fetal and/or placental weight already at mid-gestation, or only by the very end of pregnancy [15,16,22–25]. Despite the intensive research in this area, most studies have focused on the effect of short term malnutrition, and thus, the effects of chronic malnutrition -i.e., starting before and continuing throughout gestation- which more closely resembles human conditions of poor nutrition, remain largely unexplored.
Of the three main compartments in the mouse placenta—maternal decidua, junctional zone and labyrinth—the labyrinth layer is the most studied due to its essential role in feto-maternal exchange of gases and nutrients [26,27], while the junctional zone is still relatively poorly understood. Glycogen trophoblast cells, which are ubiquitous in the junctional zone, accumu-late glucose and store it in the form of glycogen, which suggests a potential role of the junc-tional zone as an energy storing layer that may play an adaptive role [28–31]. In addition, trophoblast giant cells, spongiotrophoblast and glycogen trophoblast cells within the junctional zone express many hormones which in mice include 22 related to Prolactin [32–35], some of which are implicated as drivers of changes in maternal metabolism during pregnancy. The human placenta also produces several metabolic hormones and ones related to Prolactin and Growth Hormone are also associated with changes in maternal metabolism thought to pro-mote nutrient availability for transport across the placenta [36].
This study examined feto-placental growth during mid to late gestation in a mouse model of long term maternal protein undernutrition. Insufficient protein intake and overreliance on car-bohydrates is prevalent in low income countries as well as among vulnerable populations in middle and high income countries [37]. We hypothesized that exposure to chronic low protein diet during prenatal growth would result in a differential resource allocation among feto-pla-cental tissues that is evidenced by an asymmetric growth impairment. Fetal and plafeto-pla-cental growth parameters were measured at three points in gestation: E10.5 and E17.5 represent the
study design, data collection and analysis, decision to publish, or preparation of the manuscript.
developing and mature placenta before and after the mid-gestation, and in which the labyrinth and junctional zone can be distinguished [38]. E17.5 and E18.5 were analyzed to register changes related to the rapid growth of the fetus by the end of gestation [39]. In particular, neu-rogenesis in most brain cell populations peaks between E9.5 (just after neural tube formation) and E18.5 [40], resulting in an important brain expansion especially during late pregnancy [41]. To provide a more refined measure of the growth effects of the protein restriction model, we examined the effects of diet on craniofacial shape and brain morphology. Previous studies using rats as an animal model, show that craniofacial shape can be affected by maternal nutri-tional stress [12,13]. Particularly, specimens affected by this environmental perturbation dis-played relatively shorter and wider face and neurocranium. A significant limitation of such studies is the focus on postnatal stages, while the changes induces in early ontogeny have not been explored yet. The results of this study will help to understand how maternal undernutri-tion differentially affects fetal, maternal and placental development and begin to reveal adap-tive responses of the placenta.
Materials and Methods
Experimental design
C57BL/6J male and female 4-wk-old mice were purchased from The Jackson Laboratory (Bar Harbor, ME) and maintained on a 12-h light-12-h dark cycle for 4 weeks. Then, nulliparous females were randomly divided into two groups: Control (C), withad libitumaccess to a 20% protein diet; and Low Protein (LP), withad libitumaccess to a 6% protein diet (TD91352 and TD90016, Harlan Teklad, Madison). Both diets are isocaloric (3.8 Kcal/g) but differ in the amount of protein in the form of casein and DL-Methionine. No significant differences were found in the daily consumption of food among dams fed on control and low protein diets (F
1-63= 0.69; P = 0.41). The mice were bred after two weeks. Fetuses and placentas of at least 5
lit-ters by conception day and treatment were dissected at embryonic days (E) 10.5, 17.5 and 18.5. All animal care and procedures were conducted in the compliance with the University of Calgary Health Sciences Animal Care Committee and with the guidelines of the Canada Coun-cil on Animal Care (Protocol number M10076).
Weight
Maternal, embryonic and placental weights were taken at the three time points. An ANOVA test was used to compare maternal weight in control and low protein groups before and after dissecting the uterus. Differences in embryo and placental size were tested using a mixed model ANOVA, in which maternal diet was the categorical predictor or fixed effect, while dams were included as a random factor. Due to high inter- and intra-litter variation in embryo development at E10.5, an univariate analysis of covariance (ANCOVA) including the number of tail somites as a covariate [42] was used in order to remove the variation due to development on feto-placental size.
Cranial and brain size
Mouse heads were fixed overnight in 4% PFA. High resolution X-ray micro-computed tomog-raphy (μCT) images of the heads were acquired and 3D isosurfaces reconstructed as described
in [43]. In addition, a subsample of specimens at E18.5 was re-scanned-using the same scan-ning protocol- to obtain images of the brain tissues. For this purpose, after 4% PFA immersion, the specimens were soaked overnight in Lugol’s iodine, which is used as aμCT contrast agent
heads were immerse in the iodine solution and keep at 4°C overnight. Then, the samples were rinsed in PBS to remove the excess of contrast agent and scanned.
A set of 42 bilateral anatomical points (landmarks) was digitized from the 3D reconstruction of each mouse cranium and a set of 57 landmarks were digitized on theμCT scans of the brain
using Amira software (S1 Table). While the landmarks of the cranium were digitized on the reconstructed surfaces of the skull, a different approach was used for brain landmarking. First, a transversal plane that goes through the most anterior and posterior points of the brain was estab-lished. On this transversal slice 24 points were digitized, which mainly describe the relative length and width of the brains. Additionally, a parasagittal plane starting from the most anterior point of the left olfactory bulb was defined and 25 points were digitized on this view to capture varia-tion in the height profile and in the antero-posterior dimensions as well (S1 Table).
The centroid size of the cranium and the brain were estimated as the square root of the summed squared distances from all landmarks to the centroid of each configuration [47]. While landmark-based methods have been widely used for estimating skull size, brain size has usually been assessed by its volume. In aμMRI sample of mouse brains, we had previously
found that the centroid size (as measured here) and volume are highly correlated (0.928, p = 0.003) showing that the protocol used in this work is reliable to estimate brain size.
Size was compared between treatments at E17.5 and E18.5 by means of a mixed model ANOVA, using treatment as a fixed effect and dam as a random effect. A linear model was adjusted to the log transformed centroid sizes on body weight and the residuals from this model (i.e., deviations of actual size of each specimen from the value predicted by body weight) were compared by treatment and age. Positive values are expected if cranial and brain size are larger than expected for a given body weight. Head size was not estimated at E10.5 due to the difficulties of scanning young embryos.
Craniofacial shape
All configurations of landmarks were translated to a common origin, scaled to the same size and rotated by minimizing the total sum of squared deviations of every landmark configuration from the mean configuration [47]. Differences among configurations that remain after this procedure represent actual shape differences. The effect of treatment and age on cranial shape was evaluated by means of a between-group principal component (bg-PCA) analysis. This method focuses on the effect of the specific factors to be tested [48] and thus is adequate to assess differences among groups in skull shape. In this analysis the superimposed coordinates of landmarks (i.e., shape var-iables) of all specimens were projected onto the eigenvectors of the between-groups covariance matrix. Shape changes along principal components were visualized by warping an average sur-face using the thin-plate spline procedure implemented by Landmark software [49]. Additionally, the variation in shape for each group was estimated as the mean of the squared Procrustes dis-tances between each individual configuration from its group mean [50,51]. This distance was estimated as the square root of the sum of squared distances between corresponding landmarks of each configuration and the group mean. To test whether the amount of variation differed among groups, we computed an ANOVA test of the individual deviations, using age and treat-ment as factors, which is an extension of Levene's test for multivariate data.
Histological and in situ hybridization analysis of placentas
Forin situhybridization, at least three central sections from at least three placentas (n = 3) were analyzed for each group and developmental stage. Placentas were bisected near the mid-point before dehydration and embedding and then at least one hundred 10μm sections were
taken for each placenta. From those sections, three central ones separated by 200μm were chosen
on the basis of the morphology: larger size and more conical shape of trophoblast for E10.5; larger size, presence of the umbilical cord vessels and/or central canal or spiral arteries for E17.5 and E18.5. The borders between three main placenta layers were distinguished by using the Tpbpagene–marker of spongiotrophoblast and glycogen trophoblast cells in the junctional zone, and cell morphology. Glycogen trophoblast cells were distinguished by expression ofPcdh12 mRNA. High magnification pictures were taken under the Leica microscope and then photo-merged using a‘Photomerge’tool in the‘Automate’option of Photoshop software. Measure-ments of placenta layers areas and glycogen trophoblast cells areas were done using ImageJ software by manual outlining of the analyzed areas and the‘polygon selection’tool. Statistical sig-nificance was evaluated using two-tailed Student’s t-test assuming unequal variances. Addition-ally, a principal component analysis was performed using the areas of each placenta layer standardized by the total area to account for differences in size between ages. This multivariate analysis was used to reduce the dimensionality and summarise the variance in the dataset.
Quantitative real-time PCR (qRT-PCR) for placental gene expression
From each litter, at least two specimens were dissected in order to isolate samples for RNA analysis. The corresponding placentas were immersed in 700 ml of Trizol, frozen and stored at -80°C until RNA extraction. The RNA was then processed using RNeasy Mini Kits (Qiagen) according to the manufacturer’s protocol. 1μg total RNA of three biological samples by
experi-mental group was reverse-transcribed using the RT2First Strand Kit (Qiagen). Complementary DNA samples produced were used for real time PCR to quantify the expression of several rep-resentative placenta-produced, prolactin-related genes (Prl2c2,Prl3a1,Prl3b1,Prl3d1,Prl5a1, Prl7c1,Prl8a8,), as well as spongiotrophoblast and glycogen trophoblast cell marker (Tpbpa), a glycogen trophoblast cell-specific marker (Pcdh12) andGapdh. Quantitative RT-PCR analyses were performed with a DNA Engine Opticon 2 system (Bio-Rad Laboratories, Inc., MA, USA) using detection with SYBR Green I. Each sample was assessed in duplicate.
Real-Time qRT-PCR forward and reverse primers were obtained as QuantiTect Primer Assays or RT2qPCR Primer Assays (Qiagen) forPrl3d1(QT01052219),Prl5a1(QT00139573), Prl3a1(QT00131782),Prl8a8(QT00124915),Prl7c1(QT00128646),Pcdh12(QT00100625), GAPDH(PPM02946E). Forward and reverse primers forPrl2c2were 5’-TGTGTGCAATGAG GAATGGT-3’and 5’-TAGTGTGTGAGCCTGGCTTG-3’; forPrl3b1were 5’-CCACACTGCT GCAATCCTTA-3’and 5’-TGACCATGCAGACCAGAAAG-3’, and forTpbpawere 5’-AAGT TAGGCAACGAGCGAAA-3’and 5’-AGTGCAGGATCCCACTTGTC-3’, respectively.
In order to determine the differences in target gene expression between control and low pro-tein diet groups, relative standard curves based on series of 5 dilutions were obtained for each gene using an independent placenta sample from the control group. Each curve was done in triplicate and the average used as the reference. The ratio between the target andGapdh expres-sion was calculated to provide relative gene expresexpres-sion. Those normalized values were then used to estimate the fold-change between groups and compared by t tests.
Results
Placenta, embryo and maternal weight are reduced by low protein diet
differ between experimental groups. The number of pups in the control group was 7.78±2.94 at E17.5 and 7.11±2.31 at E18.5, while in the low protein groups there were 7.5±2.12 and 8.42 ±1.61, respectively. Maternal weight was assessed after removal of the pregnant uterus and was not different between control and low protein groups at E10.5, but was significantly lower in the low protein group at E17.5 and E18.5 (Fig 1). Moreover, maternal weight of the low protein group significantly declined between E10.5 to E18.5 (P<0.001, assessed by two tailed t-test), while the weight of control mothers did not change significantly (Fig 1).
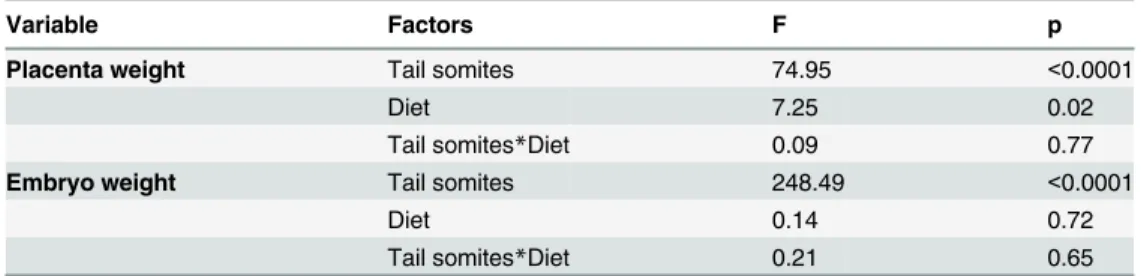
Embryo and placental weights were measured, and the number of tail somites was also assessed at E10.5 in order to account for potential differences in developmental stages. At E10.5, the effect of the number of tail somites was highly significant on both placenta and embryo weights (Table 1,Fig 1). After removing the effect of tail somites, there were no signifi-cant differences in embryo weight between control and low protein groups at E10.5 (Table 1,
Fig 1). Fetal weight in the low protein group was slightly reduced, though not significantly, at E17.5 (F1,13= 1.264, P = 0.281) but was 19% lower at E18.5 (F1,13= 30.55, P<0.01) (Fig 1). In
contrast to fetal growth, the low protein diet significantly reduced placenta weight as early as Fig 1. Maternal, placental and fetal weights at different developmental stages.E: embryonic day. The error bar represents the mean±SD.*Different from control, P<0.051;**Different from control, P<0.01.
E10.5 (Table 1,Fig 1) and this persisted at E17.5 and E18.5, being 15% and 17% lighter than in control animals (F1,13= 9.6, P<0.01;F1,13= 25.5, P<0.01). The association between placental
and fetal weight at each developmental stage, as measured by a Pearson correlation coefficient, was low at E17.5 (r= 0.45, P<0.01), but increased significantly by E18.5 (r= 0.69, P<0.01).
Fetal head size is only slightly reduced by low protein diet
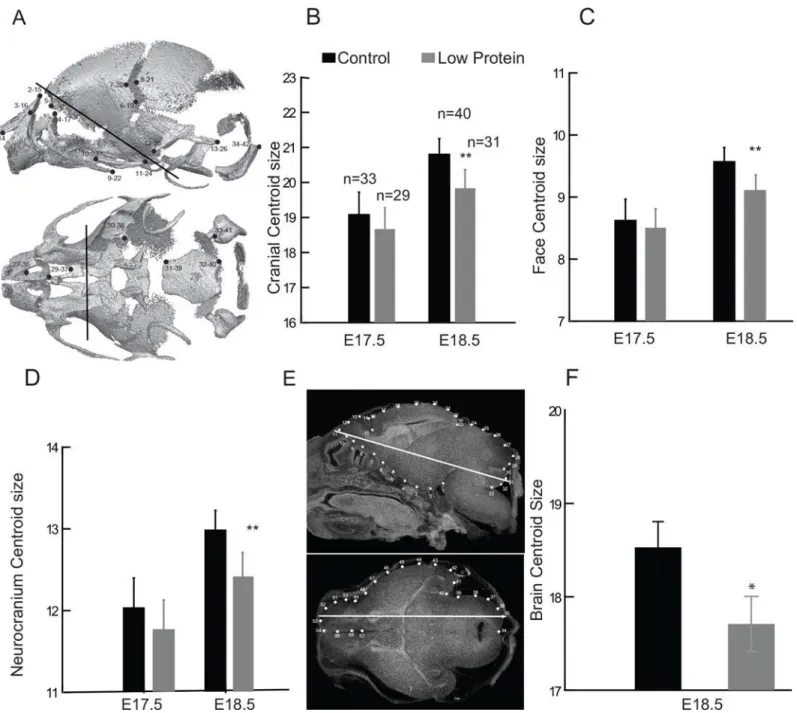
At E17.5, cranial size was slightly (2.5% smaller) but not significantly different between control and low protein groups (F1,9= 1.11, P = 0.32) (Fig 2B). Similar results were found for the face
and neurocranium, which were 2.3% and 2.5% smaller in the low protein group (Fig 2C and 2D) but did not differ significantly from the control group (Face:F1,9= 0.616, P = 0.453;
Neu-rocranium:F1,9= 1.26, P = 0.29). By E18.5, the overall cranial size as well as the size of face and
neurocranium displayed drop of around 5% in the low protein group at E18.5 (Fig 2B, 2C and 2D). Significant differences were found between the low protein and control groups at this age (Cranium:F1,13= 22.87, P<0.001; Face:F1,13= 21.3, P<0.001; Neurocranium:F1,13= 24.11,
P<0.001).
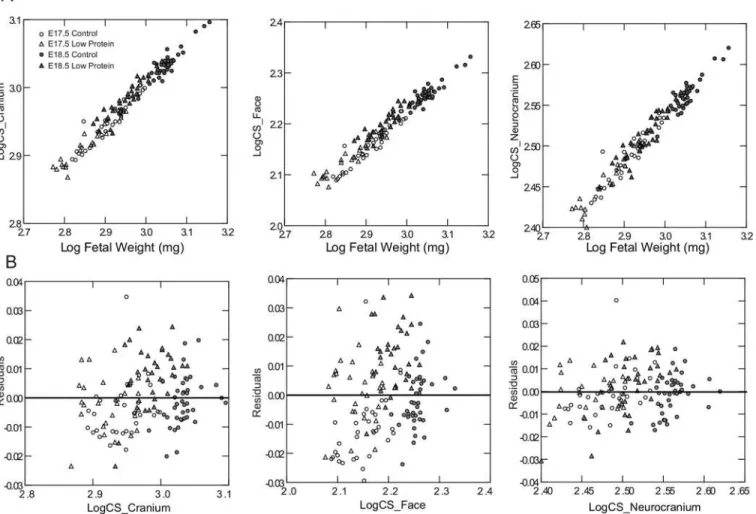
Cranial size and fetal body weight displayed a strong linear relationship during the late period of fetal growth (Fig 3A), with the slopes of the regressions being 0.59 for the cranium, 0.66 for the face and 0.54 for the neurocranium. Head size adjusted for expected body size was higher in the low protein group compared to controls (Fig 3B). This indicates that individuals in the low protein groups have larger heads relative to body size than controls. Differences in the residuals between control and low protein groups were significant, particularly for the cra-nium and face (Cracra-nium:F1,129= 12.61, P<0.01; Face:F1,129= 55.77, P<0.01; Neurocranium:
F1,129= 3.44, P = 0.06). The results obtained for cranial size are taken as proxies of brain
growth. This is supported by the strong association between the centroid size of both structures evaluated at E18.5 (r= 0.699, P<0.01). Accordingly, there was a significant reduction in brain size by E18.5 in the low protein group (F1,17= 4.52, P<0.05). The mean size of the brain was
reduced by 4.5 per cent, a decrease similar in magnitude to that found for the neurocranium (Fig 2F).
Cranial shape is affected by low protein diet
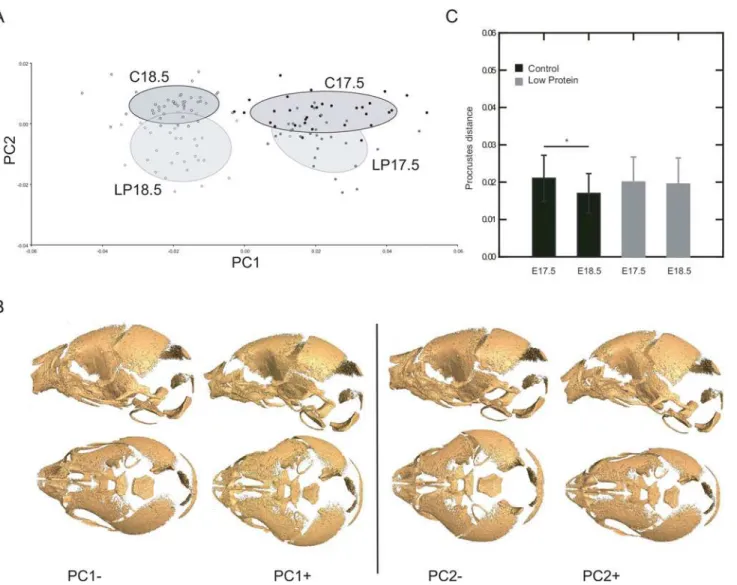
Variation in cranial shape was also assessed among treatments and age groups (Fig 4). The first principal component summarized shape variation related to fetal growth, given that E17.5 specimens were clearly separated from E18.5 along this axis (Fig 4A). Shape variation between age groups manifested primarily in the reduction of the relative width of the vault, the length-ening of the face and the less flexed cranial base at 18.5 days post-conception in relation to the cranial shape at 17.5 (Fig 4B). The second component accounted for differences in shape between treatments, which were characterized by wider and shorter skulls in the low protein groups compared to controls at both ages. These shape changes are shown as wireframes inS1
Table 1. ANCOVA test for placental and embryonic weight at E10.5.
Variable Factors F p
Placenta weight Tail somites 74.95 <0.0001
Diet 7.25 0.02
Tail somites*Diet 0.09 0.77
Embryo weight Tail somites 248.49 <0.0001
Diet 0.14 0.72
Tail somites*Diet 0.21 0.65
Fig. Interestingly, the amount of variation in shape between specimens was significantly reduced from E17.5 to E18.5 in the control group but not in the low protein group (Fig 4C).
The junctional zone of the placenta is preferentially reduced by low
protein diet
Given that the first morphological evidence of impact of the low protein diet was on placental weight, well before maternal and fetal effects, we analyzed placenta structure and function in Fig 2. Changes in skull and brain size in the low protein fetuses.Coordinates of landmarks (A) and centroid size of the cranium (B), face (C) and neurocranium (D), by treatment and age. Units inμm. Coordinates of landmarks and semilandmarks digitized in sections of sagittal and axial planes of the
brain (E). White lines represent the places where the transversal and sagittal sections were measured. Brain centroid size at E18.5 in the low protein and control groups (F). The error bar represents the mean±SD.**Different from control, P<0.01.*Different from control, P<0.05.
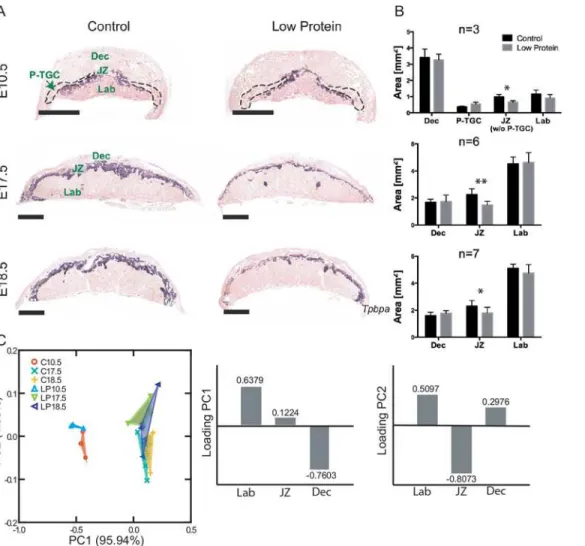
more detail. At all stages analyzed, the areas of the decidua and labyrinth were not different between low protein and control placentas. However, starting as early as E10.5, there was a sig-nificant reduction in the low protein group in the size of the junctional zone as defined by expression of theTpbpagene which is expressed in both spongiotrophoblast and glycogen tro-phoblast cells (Fig 5A and 5B). On histological sections, the reduction in cross-sectional areas was 33%, 34% and 22% at E10.5, 17.5 and 18.5 respectively. When the areas of the three main layers are analyzed together, as expected, a clear separation is seen between placentas at E10.5 and the other two ages (Fig 5C). Differences between treatments were also observable along the second principal component, although they were not as large as between age groups. The vari-able that contributed most to this component was the area of the junctional zone, which was relatively smaller in the specimens located at the positive values of the second component (the region where most specimens of the low protein groups are located).
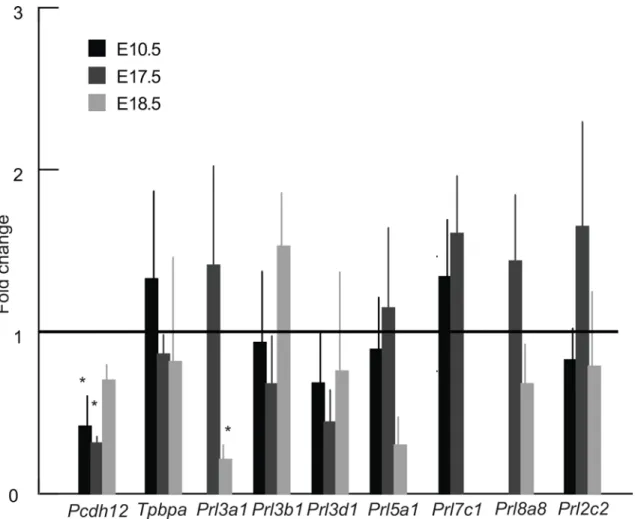
To further investigate the morphological changes in the junctional zone, quantitative real-time PCR assays were performed. Expression ofPcdh12mRNA, a marker of glycogen tropho-blast cells, was significantly reduced in low protein placentas at E10.5 and E17.5 as compared to the control group, though there was no significant difference by E18.5 (Fig 6). By contrast, TpbpamRNA expression was not different suggesting that glycogen cells were specifically Fig 3. Relationship between fetal skull size and body weight in low protein and control groups.A) Linear regressions between log centroid size (CS) and log body weight (BW) for the cranium, face and neurocranium; B) residuals of linear regressions between log CS and BW. Triangles: low protein group; circles: control group; empty symbols: E17.5; filled symbols: E18.5.
affected and not spongiotrophoblast cells. Based on in situ hybridization, the total area per sec-tion ofPcdh12-positive cells at E10.5 (0.53±0.04mm2vs 0.32±0.13mm2) and E17.5 (0.33 ±0.08mm2in control and 0.20±0.06mm2) tended to be reduced in the low protein group though the differences were not statistically significant. The parietal trophoblast giant cell com-ponent of the placenta did not seem to be affected by low protein diet at E10.5 (Fig 5A and 5B), E17.5 and E18.5 based on examination of histological sections. Consistent with this, expression of parietal trophoblast giant cell marker genesPrl2c2,Prl3b1, andPrl3d1based on qRT-PCR was not different between low protein and control group (Fig 6).
Expression of Prolactin-related hormone genes
To determine if low protein diet induced compensatory changes in the endocrine function of the placenta, we assessed the expression of a subset of the placenta-specific, Prolactin-related hormones which have been implicated in regulation of metabolism and fetal growth [25,26]. We focused on 7 of the 22 family members which are expressed in late gestation when fetal Fig 4. Analysis of skull shape based on three‐dimensional craniofacial landmarks.A) Distribution of specimens of low protein (LP) and control (C) groups along the between-group principal components (bg-PC). Ellipses represent the specimens of each group within the 1SD confidence interval. B) Shape changes corresponding to the observed extremes in the positive and negative directions of first two components shown as a warped surface of a mouse skull. C) Shape variance within each experimental group and age measured in units of Procrustes distance.
growth increases exponentially and representing at least one member from each of the six sub-families [26]:Prl2c2,Prl3a1,Prl3b1,Prl3d1,Prl5a1,Prl7c1andPrl8a8. Among these genes, only expression ofPrl3a1was significantly different between the low protein and control groups.Prl3a1is expressed only by spongiotrophoblast cells in the junctional zone and levels are first detectable at E14.5 and increase towards term, paralleling the increase in fetal growth [52]. Interestingly, whilePrl3a1mRNA levels seemed to be elevated in the low protein group at E17.5, expression declined and was significantly lower than control by E18.5, paralleling the arrest of fetal growth (Fig 6).
Discussion
In this study we demonstrate that the fetal, placental and maternal compartments are differen-tially affected by prolonged maternal protein restriction in mice. Overall, placenta size and function was first to be affected as a result of the low protein diet, as early as E10.5. The weight of the mother was next to be affected (E17.5), while the embryo weight did not display any sig-nificant change until the very end of the gestation (E18.5), and cranial size was relatively spared Fig 5. Decrease of junctional zone area in low protein placentas at E10.5, E17.5 and E18.5.A) In situ hybridization forTpbpa, marker of junctional zone. Purple area: junctional zone; dashed area: parietal trophoblast giant cells (P-TGC); B) Bars represent average area of given placenta layer on a histological section±SD.*Different from control, P<0.05;**Different from control, P<0.01; Dec: decidua; JZ: junctional zone; Lab: labyrinth; P-TGC: parietal trophoblast giant cells. Scale bar–1 mm. C) Principal component analysis of the areas of the three main placenta layers for the control (C) and low protein groups (LP). The bars represent the loading of each variable on the first two principal components (PC).
compared to the rest of the fetus (Fig 7). Further, we show that craniofacial shape is altered at E17.5 but to a greater extent at E18.5 in the low protein diet group. These differences in timing suggest that adaptations in the placenta and mother take place during early and mid pregnancy to maintain fetal growth, and especially the growth of brain. Other models for IUGR, such as Igf2knockout mice and rats, and mice fed on protein or calorie restricted diets, also show that fetal weight is not altered until the end of gestation [22,23,52,53]. Nonetheless, most Fig 6. Expression of seven prolactin family genes,Pcdh12andTpbpain control and low protein placentas at E10.5, E17.5 and E18.5.Missing bars mean that the particular gene is not expressed at the given developmental stage.*Different from control, p<0.05. The error bar represents the mean±SD. C–control group; LP–low protein group.
doi:10.1371/journal.pone.0152227.g006
Fig 7. Schematic summary of the effects of low protein diet on placental, fetal and maternal weight and on the head size.C–control group; LP–low protein group; red color–weight significantly reduced as compared to the control group of the same age; blue color–cranial and brain size significantly different from the control of the same age.
experiments have evaluated only one developmental stage, usually at E17.5 or later, and when more sampling points have been included, they have not started earlier than E14.5 [24,54]. As our results point out, data on early gestation are essential to assess the processes that underlie a given outcome at a specific time point.
One phenomenon that has attracted considerable attention in association to IUGR in human neonates is that brain tissues are often affected to a lesser extent than body mass [14,
55]. We show here that even though normal fetal and brain growth cannot be maintained until the end of gestation under extended periods of maternal protein malnutrition, head size is larger than predicted by body size in the restricted group. This evidence of head-sparing is con-sistent with a preferential allocation of nutrients to brain tissues during pregnancy when the brain is expected to be especially demanding due to its high growth rate. With few exceptions, the majority of the animal research on perturbed growth of prenatal brain has been conducted in sheep models [56,57]. Studies on rodents, while numerous, mainly focus on the negative effects of early environmental perturbations assessed postnatally [58]. Recently, a rising of cere-bral blood velocity was observed in fetal mice exposed to acute hypoxia, which suggests active regulation of cerebral oxygenation and brain sparing in fetal mice [59]. This potential mecha-nism has not been tested under other stimuli such as nutrient restriction. However, our results are consistent with these findings and support the use of mice fed on low protein diets through-out pregnancy as a model to study head sparing.
In addition to brain and cranial size, nutrient restriction also altered cranial shape. This is con-sistent with earlier work that showed that both pre- and postnatal nutritional stress alters cranio-facial shape [12,60,61]. This occurs primarily through the altered proportions of the brain, basicranium and face. If relative brain size is preserved but the rest of the skull is smaller, this results in an integrated series of changes that impact mid-facial projection, basicranial shape and the basicranial angle as well as the relative proportion of the neurocranium to the remainder of the skull [62–65].These are exactly the shape changes that we observed in our results. Therefore, these shape effects provide us with an additional indication of how the fetus is responding to the maternal malnutrition in our design. While we find detectable shape effects at E17.5, these are greatly exacerbated by E18.5 which is consistent with the interpretation that the fetus is spared during early gestation but that the effects become increasingly severe in late gestation.
The sequence of events in response to protein restriction suggests how fetal growth is spared. Protein restriction resulted in reduced placental size evident at early gestation (E10.5) and this reduction persisted until the end of pregnancy. Interestingly, chronic maternal protein restriction did not affect all placental layers to the same extent. The placenta layer most affected by low protein diet was the junctional zone, similar to previous results in undernourished mice [16,18,19], and specifically glycogen trophoblast cells. Since glycogen trophoblast cells accu-mulate and store glucose in the form of glycogen during gestation, we hypothesize that they act as the nutrient buffer between maternal supply and fetal demand, accumulating excess glucose from maternal blood in early and mid gestation, in order to utilize it in late gestation when the extra, easily accessible energy is needed for the rapid embryonic growth. We hypothesize that the reduction in glycogen trophoblast cells in placentas from undernourished pregnancies sim-ply reflects the fact that glucose is limited. Between E10.5 and 17.5, though fetal growth was still normal, maternal (non-uterine) body weight was beginning to fall, indicating maternal
“sacrifice”in favor of the growing fetus. It will be interesting to explore specific tissues and how they respond, and also to know what signals drive catabolism in the mother.
protein diet in only one of them,Prl3a1, which is expressed only in spongiotrophoblast cells of the junctional zone from E14.5 to term [66]. Its expression seemed to be elevated compared to controls at E17.5, but dramatically declined by E18.5 in the low protein fed group.Prl3a1 func-tion is unknown, though it is most closely related toPrl3b1andPrl3d1which work through the Prolactin receptor [34]. Other studies have shown thatPrl3a1mRNA levels are significantly reduced at term in the placenta of feed restricted mice [67] and administration of the synthetic corticosteroid, dexamethasone, increases expression ofPrl3a1in late gestation [68]. Overall these findings suggest a potential role forPrl3a1in normal late gestation for promotion of fetal growth, but this becomes dysregulated by term in response to low protein diet. What drives this change is unknown.
The strengths of this study lie in looking at maternal and fetal growth at multiple time points, including early pregnancy, and in analyzing changes in placenta under maternal malnu-trition on cellular and hormonal levels. In humans there is evidence of decreased fetal and pla-cental weight at term related to in utero nutrient compromise caused by events such as famine or fasting [69]. However, those studies report only the gross placental shape and size. It would be interesting to know which specific cell types in human placenta are particularly affected by in utero undernutrition and which placental hormones do not follow the normal temporal pat-tern of expression in such conditions. This is an important gap in knowledge to fill in order to understand the role of placenta in mediating nutritional challenges in human pregnancy. Human placenta-specific hormones related to Growth Hormone have been implicated in regu-lation of maternal metabolism and fetal growth [36] and are the most obvious candidates.
Evaluation of growth in human fetuses is usually done using ultrasound from which mea-surements such as femoral length and head circumference are obtained and then compared with published standards in order to identify growth retardation [70]. A small placenta size is known to be a cause of IUGR in humans and it has been shown that placenta volume predicts IUGR before fetal growth is compromised [71]. However, percentile curves for placental weight are rare [72–74]. Our study, although based on a mouse model, reinforces the importance of evaluating placental size for diagnostic purposes [75]. Early detection of retarded placental growth may allow improved prediction of IUGR before fetal growth is compromised along with the attendance of longer-term health consequences. These results highlight the interplay of placental development, placental buffering and fetal growth in determining birth outcomes in the face of human malnutrition.
In summary, this study demonstrates that the growth and function of the junctional zone of the murine placenta is affected by chronic maternal protein restriction in early gestation, and that reduction of this layer persists throughout gestation. However, fetal and especially brain growth are not affected until the very end of gestation. Based on these novel findings, we propose that the junctional zone is an early sensor of maternal nutritional status and that it initiates adap-tive endocrine changes that mitigate the impact of poor maternal nutrition on fetal growth.
Supporting Information
S1 Fig. Shape changes corresponding to the observed extremes in the positive and negative directions of first two components.In the wireframes, darker lines represent shape changes relative to PC1 and PC2 score moving from both negative and positive directions, lighter lines represent the shape consensus. The upper panel shows the landmarks linked in the wireframes. (PDF)
S1 Table. Definition of landmarks digitized in the skull and the brain.Landmarks’positions are illustrated inFig 2.
Acknowledgments
P.N.G., M.G., J.C.C. and B.H. designed the research; P.N.G., M.G. and N.K. conducted the research; P.N.G., M.G. and J.B.A. analyzed the data; P.N.G., M.G., J.C.C. and B.H. wrote the paper; J.C.C. and B.H. had primary responsibility for the final content. All authors read and approved the final manuscript. We thank Heather Jamniczky and Tegan Barry for their help with the protocols for brain staining.
Author Contributions
Conceived and designed the experiments: PNG MG JCC BH. Performed the experiments: PNG MG NK. Analyzed the data: PG MG JB. Contributed reagents/materials/analysis tools: BH JCC. Wrote the paper: PG MG BH JCC JB.
References
1. Prada JA, Tsang RC. Biological mechanisms of environmentally induced causes of IUGR. Eur J Clin Nutr. 1998; 52 Suppl 1: S21–7; discussion: S27-8. PMID:9511016
2. King JC. Physiology of pregnancy and nutrient metabolism. Am J Clin Nutr. 2000; 71: 1218s–1225s. PMID:10799394
3. Romo A, Carceller R, Tobajas J. Intrauterine growth retardation (IUGR): epidemiology and etiology. Pediatr Endocrinol Rev 6 Suppl. 2009; 3: 332–336.
4. Schell LM, Magnus PD. Is there an elephant in the room? Addressing rival approaches to the interpreta-tion of growth perturbainterpreta-tions and small size. Am J Hum Biol. 2007; 19: 606–614. PMID:17636533
5. Salam RA, Das JK, Bhutta ZA. Impact of intrauterine growth restriction on long-term health. Curr Opin Clin Nutr Metab Care. 2014; 17: 249–254. doi:10.1097/MCO.0000000000000051PMID:24613859
6. Fowden AL, Moore T. Maternal-fetal resource allocation: Co-operation and conflict. Placenta. 2012; 33: e11–e15. doi:10.1016/j.placenta.2012.05.002PMID:22652046
7. Gutierrez-Marcos JF, Constância M, Burton GJ. Maternal to offspring resource allocation in plants and mammals. Placenta. 2012; 33: e3–e10. doi:10.1016/j.placenta.2012.08.006PMID:22995735
8. Morrison JL. Sheep models of intrauterine growth restriction: fetal adaptations and consequences. Clin Exp Pharmacol P. 2008, 35: 730–743.
9. Fowden AL, Sferruzzi-Perri AN, Coan PM, Constancia M, Burton GJ: Placental efficiency and adapta-tion: endocrine regulation. J Physiol (Lond). 2009, 587: 3459–3472.
10. Kramer MS, McLean FH, Olivier M, Willis DM, Usher RH. Body proportionality and head and length “sparing”in growth-retarded neonates: a critical reappraisal. Pediatrics. 1989; 84: 717–723. PMID: 2780135
11. Reichling TD, German RZ. Bones, muscles and visceral organs of protein-malnourished rats (Rattus norvegicus) grow more slowly but for longer durations to reach normal final size. J Nutr. 2000; 130: 2326–2332. PMID:10958831
12. Gonzalez PN, Hallgrimsson B, Oyhenart EE. Developmental plasticity in covariance structure of the skull: effects of prenatal stress. J Anat. 2011; 218: 243–257. doi:10.1111/j.1469-7580.2010.01326.x PMID:21138433
13. Gonzalez PN, Oyhenart EE, Hallgrímsson B. Effects of environmental perturbations during postnatal development on the phenotypic integration of the skull. J Exp Zool B Mol Dev Evol. 2011; 316: 547– 561. doi:10.1002/jez.b.21430PMID:21826787
14. Baker J, Workman M, Bedrick E, Frey MA, Hurtado M, Pearson O. Brains versus brawn: An empirical test of Barker’s brain sparing model. Am J Hum Biol. 2010; 22: 206–215. doi:10.1002/ajhb.20979 PMID:19701887
15. Rutland CS, Latunde-Dada AO, Thorpe A, Plant R, Langley-Evans S, Leach L. Effect of gestational nutrition on vascular integrity in the murine placenta. Placenta. 2007; 28: 734–742. PMID:16930688
16. Coan PM, Vaughan OR, Sekita Y, Finn SL, Burton GJ, Constancia M, Fowden AL. Adaptations in pla-cental phenotype support fetal growth during undernutrition of pregnant mice. J Physiol. 2010; 588: 527–538. doi:10.1113/jphysiol.2009.181214PMID:19948659
18. Coan PM, Vaughan OR, McCarthy J, Mactier C, Burton GJ, Constancia M, Fowden AL. Dietary compo-sition programmes placental phenotype in mice. J Physiol. 2011; 589: 3659–3670 doi:10.1113/ jphysiol.2011.208629PMID:21624969
19. Schulz LC, Schlitt JM, Caesar G, Pennington KA. Leptin and placental response to maternal food restriction during early pregnancy in mice. Biol Reprod. 2012; 87: 120,1–9. doi:10.1095/biolreprod. 112.103218PMID:22993381
20. Gao H, Sathishkumar KR, Yallampalli U, Balakrishnan M, Li X, Wu G, Yallampalli C. Maternal protein restriction regulates IGF2 system in placental labyrinth. Front Biosci (Elite Ed). 2013; 4: 1434–1450. 21. Rebelato HJ, Esquisatto MA, Moraes C, Amaral ME, Catisti R. Gestational protein restriction induces
alterations in placental morphology and mitochondrial function in rats during late pregnancy. J Mol His-tol. 2013; 44: 629–637. doi:10.1007/s10735-013-9522-7PMID:23884563
22. Fernandez-Twinn DS, Ozanne SE, Ekizoglou S, Doherty C, James L, Gusterson B, Hales CN. The maternal endocrine environment in the low-protein model of intra-uterine growth restriction. Br J Nutr. 2003; 90: 815–822. PMID:13129451
23. Jansson N, Pettersson J, Haafiz A, Ericsson A, Palmberg I, Tranberg M, Ganapathy V, Powell TL, Jansson T. Down-regulation of placental transport of amino acids precedes the development of intra-uterine growth restriction in rats fed a low protein diet. J Physiol. 2006; 576: 935–946. PMID:16916910
24. Gheorghe CP, Goyal R, Holweger JD, Longo LD. Placental gene expression responses to maternal protein restriction in the mouse. Placenta. 2009; 30: 411–417. doi:10.1016/j.placenta.2009.03.002 PMID:19362366
25. Vaughan OR, Sferruzzi-Perri AN, Coan PM, Fowden AL. Environmental regulation of placental pheno-type: implications for fetal growth. Reprod Fertil Dev. 2012; 24: 80–96.
26. Watson ED, Cross JC. Development of structures and transport functions in the mouse placenta. Phys-iology (Bethesda). 2005; 20: 180–193.
27. Burton GJ, Fowden AL. Review: The placenta and developmental programming: balancing fetal nutri-ent demands with maternal resource allocation. Placnutri-enta. 2012; 33 Suppl: 23–27.
28. Tunster SJ, Tycko B, John RM. The imprinted Phlda2 gene regulates extraembryonic energy stores. Mol Cell Biol. 2010; 30: 295–306. doi:10.1128/MCB.00662-09PMID:19884348
29. Coan PM, Conroy N, Burton GJ, Ferguson-Smith AC. Origin and characteristics of glycogen cells in the developing murine placenta. Dev Dyn. 2006; 235: 3280–3294. PMID:17039549
30. Cross JC, Mickelson L. Nutritional influences on implantation and placental development. Nutr Rev. 2006; 64: S12–18; discussion: S72-91. PMID:16770948
31. Gasperowicz M, Surmann-Schmitt C, Hamada Y, Otto F, Cross JC. The transcriptional co-repressor TLE3 regulates development of trophoblast giant cells lining maternal blood spaces in the mouse pla-centa. Dev Biol. 2013; 382: 1–14. doi:10.1016/j.ydbio.2013.08.005PMID:23954203
32. Cross JC, Werb Z, Fisher SJ. Implantation and the placenta: key pieces of the development puzzle. Sci-ence. 1994; 266: 1508–1518. PMID:7985020
33. Simmons DG, Fortier AL, Cross JC. Diverse subtypes and developmental origins of trophoblast giant cells in the mouse placenta. Dev Biol. 2007; 304: 567–578. PMID:17289015
34. Rawn S, Cross JC. The evolution, regulation, and function of placenta-specific genes. Annu Rev Cell Dev Biol. 2008; 24: 159–181. doi:10.1146/annurev.cellbio.24.110707.175418PMID:18616428
35. Knox K, Leuenberger D, Penn AA, Baker JC. Global hormone profiling of murine placenta reveals Secretin expression. Placenta. 2011; 32: 811–816. doi:10.1016/j.placenta.2011.08.013PMID: 21944867
36. Newbern D, Freemark M. Placental hormones and the control of maternal metabolism and fetal growth. Curr Opin Endocrinol Diabetes Obes. 2011; 18: 409–416. doi:10.1097/MED.0b013e32834c800d PMID:21986512
37. Schönfeldt HC, Gibson Hall N. Dietary protein quality and malnutrition in Africa. Br J Nutr. 2012; 108 Suppl 2: S69–76. doi:10.1017/S0007114512002553PMID:23107550
38. Knox K, Baker JC. Genomic evolution of the placenta using co-option and duplication and divergence. Genome Res. 2008; 18: 695–705. doi:10.1101/gr.071407.107PMID:18340042
39. Mu J, Slevin JC, Qu D, McCormick S, Adamson SL. In vivo quantification of embryonic and placental growth during gestation in mice using micro-ultrasound. Reprod Biol Endocrinol. 2008; 6: 34. doi:10. 1186/1477-7827-6-34PMID:18700008
41. Semple BD, Blomgren K, Gimlin K, Ferriero DM, Noble-Haeusslein LJ. Brain development in rodents and humans: Identifying benchmarks of maturation and vulnerability to injury across species. Prog Neu-robiol. 2013; 106–107: 1–16. doi:10.1016/j.pneurobio.2013.04.001PMID:23583307
42. Young NM, Wat S, Diewert VM, Browder LW, Hallgrímsson B. Comparative morphometrics of embry-onic facial morphogenesis: implications for cleft-lip etiology. Anat Rec (Hoboken). 2007; 290: 123–139. 43. Gonzalez PN, Lotto FP, Hallgrímsson B. Canalization and developmental instability of the fetal skull in
a mouse model of maternal nutritional stress. Am J Phys Anthropol. 2014; 154: 544–553. doi:10.1002/ ajpa.22545PMID:24888714
44. Metscher BD. MicroCT for developmental biology: a versatile tool for high-contrast 3D imaging at histo-logical resolutions. Dev Dyn. 2009; 238: 632–640. doi:10.1002/dvdy.21857PMID:19235724
45. Wong MD, Dorr AE, Walls JR, Lerch JP, Henkelman RM. A novel 3D mouse embryo atlas based on micro-CT. Development. 2012; 139: 3248–3256. doi:10.1242/dev.082016PMID:22872090
46. Wong MD, Spring S, Henkelman RM. 2013. Structural stabilization of tissue for embryo phenotyping using micro-CT with iodine staining. PLoS One. 2013; 13: e84321.
47. Bookstein FL. Morphometric Tools for Landmark Data: Geometry and Biology. Cambridge University Press; 1997: 459 p.
48. Gonzalez PN, Kristensen E, Morck DW, Boyd S, Hallgrímsson B. Effects of growth hormone on the ontogenetic allometry of craniofacial bones. Evol Dev. 2013; 15: 133–145. doi:10.1111/ede.12025 PMID:25098638
49. Wiley DF, Amenta N, Alcantara DA, Ghosh D, Kil YJ, Delson E, Harcourt-Smith W, Rohlf FJ, St John K, Hamann B. Evolutionary morphing. Proceedings of the IEEE Visualization. 2005. 431–438.
50. Zelditch ML, Lundrigan BL, Garland T. Developmental regulation of skull morphology. I. Ontogenetic dynamics of variance. Evol. Dev. 2004; 6: 194–206. PMID:15099307
51. Willmore KE, Leamy L, Hallgrímsson B. Effects of developmental and functional interactions on mouse cranial variability through late ontogeny. Evol Dev. 2006; 8: 550–567. PMID:17073938
52. Simmons DG, Rawn S, Davies A, Hughes M, Cross JC. Spatial and temporal expression of the 23 murine Prolactin/Placental Lactogen-related genes is not associated with their position in the locus. BMC Genomics. 2008; 9: 352. doi:10.1186/1471-2164-9-352PMID:18662396
53. Brasel JA, Winick M. Maternal nutrition and prenatal growth. Experimental studies of effects of maternal undernutrition on fetal and placental growth. Arch Dis Child. 1972; 47: 479–485 PMID:4558382
54. Dilworth MR, Kusinski LC, Baker BC, Renshall LJ, Greenwood SL, Sibley CP, Wareing M. Defining fetal growth restriction in mice: A standardized and clinically relevant approach. Placenta. 2011; 32: 914–916. doi:10.1016/j.placenta.2011.08.007PMID:21889207
55. Malandro MS, Beveridge MJ, Kilberg MS, Novak DA. Effect of low-protein diet-induced intrauterine growth retardation on rat placental amino acid transport. Am J Physiol. 1996; 271: C295–303. PMID: 8760058
56. Roza SJ, Steegers EAP, Verburg BO, Jaddoe VWV, Moll HA, Hofman A, Verhulst FC, Tiemeier H. What is spared by fetal brain-sparing? Fetal circulatory redistribution and behavioral problems in the general population. Am J Epidemiol. 2008; 168: 1145–1152. doi:10.1093/aje/kwn233PMID:18826969
57. Edelstone DI, Rudolph AM, Heymann MA. Effects of hypoxemia and decreasing umbilical flow on liver and ductus venosus blood flows in fetal lambs in utero. Am J Physiol Heart Circ Physiol. 1980; 238: H656–H663.
58. Wedegärtner U, Tchirikov M, Schäfer S, Priest AN, Kooijman H, Adam G, Schröder HJ. Functional MR imaging: comparison of BOLD signal intensity changes in fetal organs with fetal and maternal oxyhemo-globin saturation during hypoxia in sheep. Radiology. 2006; 238: 872–880. PMID:16439569
59. Morgane PJ, Mokler DJ, Galler JR. Effects of prenatal protein malnutrition on the hippocampal forma-tion. Neurosci Biobehav Rev. 2002; 26: 471–483. PMID:12204193
60. Cahill LS, Zhou Y-Q, Seed M, Macgowan CK, Sled JG. Brain sparing in fetal mice: BOLD MRI and Doppler ultrasound show blood redistribution during hypoxia. J Cereb Blood Flow Metab. 2014. In press. doi:10.1038/jcbfm.2014.62
61. Pucciarelli HM, Oyhenart EE. Effects of maternal food restriction during lactation on craniofacial growth in weanling rats. Am J Phys Anthropol. 1987; 72: 67–75. PMID:3826329
62. Dressino V, Pucciarelli HM. Cranial growth in Saimiri sciureus (Cebidae) and its alteration by nutritional factors. A longitudinal study. Am. J. Phys. Anthropol. 1997; 102: 545–554 PMID:9140543
64. Hallgrímsson B, Jamniczky H, Young NM, Rolian C, Parsons TE, Boughner JC, Marcucio RS. Deci-phering the palimpsest: studying the relationship between morphological integration and phenotypic covariation. Evol Biol. 2009; 36: 355–376. PMID:23293400
65. Lieberman DE, Hallgrímsson B, Liu W, Parsons TE, Jamniczky HA. Spatial packing, cranial base angu-lation, and craniofacial shape variation in the mammalian skull: testing a new model using mice. J Anat. 2008; 212: 720–735. doi:10.1111/j.1469-7580.2008.00900.xPMID:18510502
66. Barbeito-Andrés J, Gonzalez PN, Hallgrímsson B. Prenatal development of skull and brain in a mouse model of growth restriction. Rev Arg Antrop Biol. 2016; 18: 1–13.
67. Chen PY, Ganguly A, Rubbi L, Orozco LD, Morselli M, Ashraf D, Jaroszewicz A, Feng S, Jacobsen SE, Nakano A, Devaskar SU, Pellegrini M. Intrauterine calorie restriction affects placental DNA methylation and gene expression. Physiol Genomics. 2013; 45: 565–576. doi:10.1152/physiolgenomics.00034. 2013PMID:23695884
68. Baisden B, Sonne S, Joshi RM, Ganapathy V, Shekhawat PS. Antenatal dexamethasone treatment leads to changes in gene expression in a murine late placenta. Placenta. 2007; 28: 1082–1090. PMID: 17559929
69. Barker DJP, Eriksson JG, Kajantie E, Alwasel SH, Fall CHD, Roseboom TJ, Osmond C. The maternal and placental origins of chronic disease. In: Burton GJ, Barker DJP, Moffet A, Thornburg K, editors. The Placenta and Human Developmental Programming. Cambridge: Cambridge University Press; 2011. pp. 5–13.
70. Elia M, Stratton RJ. An analytic appraisal of nutrition screening tools supported by original data with par-ticular reference to age. Nutrition. 2012; 28: 477–494. doi:10.1016/j.nut.2011.11.009PMID:22386636
71. Collins SL, Stevenson GN, Noble JA, Impey L. Rapid calculation of standardized placental volume at 11 to 13 weeks and the prediction of small for gestational age babies. Ultrasound Med Biol. 2013; 39: 253–260. doi:10.1016/j.ultrasmedbio.2012.09.003PMID:23219036
72. Thompson J, Irgens L, Skjaerven R, Rasmussen S. Placenta weight percentile curves for singleton deliveries. BJOG: Int J Gynaecol Obstet. 2007; 114: 715–720.
73. Proctor LK, Toal M, Keating S, Chitayat D, Okun N, Windrim RC, Smith GCS, Kingdom JCP. Placental size and the prediction of severe early-onset intrauterine growth restriction in women with low preg-nancy-associated plasma protein-A. Ultrasound Obstet Gynecol. 2009; 34: 274–282. doi:10.1002/uog. 7308PMID:19672838
74. Wallace JM, Bhattacharya S, Horgan GW. Gestational age, gender and parity specific centile charts for placental weight for singleton deliveries in Aberdeen, UK. Placenta. 2013; 34: 269–274. doi:10.1016/j. placenta.2012.12.007PMID:23332414