Computational Analysis of the Predicted
Evolutionary Conservation of Human
Phosphorylation Sites
Brett Trost1,2*, Anthony Kusalik1, Scott Napper2,3
1Department of Computer Science, University of Saskatchewan, Saskatoon, Saskatchewan, Canada, 2Vaccine and Infectious Disease Organization, University of Saskatchewan, Saskatoon, Saskatchewan, Canada,3Department of Biochemistry, University of Saskatchewan, Saskatoon, Saskatchewan, Canada
Abstract
Protein kinase-mediated phosphorylation is among the most important post-translational modifications. However, few phosphorylation sites have been experimentally identified for most species, making it difficult to determine the degree to which phosphorylation sites are conserved. The goal of this study was to use computational methods to characterize the conservation of human phosphorylation sites in a wide variety of eukaryotes. Using experi-mentally-determined human sites as input, homologous phosphorylation sites were pre-dicted in all 432 eukaryotes for which complete proteomes were available. For each pair of species, we calculated phosphorylation site conservation as the number of phosphorylation sites found in both species divided by the number found in at least one of the two species. A clustering of the species based on this conservation measure was concordant with phyloge-nies based on traditional genomic measures. For a subset of the 432 species, phosphoryla-tion site conservaphosphoryla-tion was compared to conservaphosphoryla-tion of both protein kinases and proteins in general. Protein kinases exhibited the highest degree of conservation, while general pro-teins were less conserved and phosphorylation sites were least conserved. Although pre-liminary, these data tentatively suggest that variation in phosphorylation sites may play a larger role in explaining phenotypic differences among organisms than differences in the complements of protein kinases or general proteins.
Introduction
Protein kinases play a critical role in regulating cellular processes by catalyzing the phosphory-lation of amino acid residues (usually serine, threonine, or tyrosine), which may activate, deac-tivate, or change the activity of the target protein [1,2]. Most eukaryotic genomes encode a large number of protein kinases; for example, the human genome encodes more than 500 [2], while theArabidopsis thalianagenome encodes more than 1000 [3]. The complement of pro-tein kinases in a species is called its kinome, while the complement of phosphorylation sites—
the residues phosphorylated by protein kinases—is called its phosphoproteome.
OPEN ACCESS
Citation:Trost B, Kusalik A, Napper S (2016) Computational Analysis of the Predicted Evolutionary Conservation of Human Phosphorylation Sites. PLoS ONE 11(4): e0152809. doi:10.1371/journal. pone.0152809
Editor:Manuela Helmer-Citterich, University of Rome Tor Vergata, ITALY
Received:November 26, 2015
Accepted:March 19, 2016
Published:April 5, 2016
Copyright:© 2016 Trost et al. This is an open access article distributed under the terms of the Creative Commons Attribution License, which permits unrestricted use, distribution, and reproduction in any medium, provided the original author and source are credited.
Data Availability Statement:All relevant data are within the paper and its Supporting Information files.
Funding:Funding was provided by Genome Canada (http://www.genomecanada.ca). The funders had no role in study design, data collection and analysis, decision to publish, or preparation of the manuscript.
Given their functional importance, as well as their integral role in determining the pheno-type of a given organism, several studies have been devoted to characterizing the evolution and conservation of phosphorylation sites. For example, Rinschen et al. discovered that cross-cies comparisons of phosphorylation site data can provide insight into the architecture of spe-cific signaling systems [4], while Kim et al. compared known phosphorylation sites in several evolutionarily-diverse organisms, and found several sites in human that appear to have arisen since the divergence of humans and chimpanzees [5]. Moses et al. examined the evolution of sites phosphorylated by cyclin-dependent kinases in proteins comprising the pre-replicative complex (a set of interacting proteins involved in DNA replication) in a number of closely-and distantly-related organisms [6]. They found that although pre-replicative complex compo-nents often contained clusters of cyclin-dependent kinase consensus sites, the presence or posi-tion of individual sites were often poorly conserved, and that differences in these sites were associated with regulatory changes. Recently, Freschi et al. [7] performed a detailed study of the known human and mouse phosphoproteomes, and found that while approximately 87% of the phosphorylation sites that have been experimentally determined to exist in one species or the other were conserved at the sequence level, a much lower proportion were actually known to be phosphorylated in both species. The authors then analyzed how often these discrepancies can be attributed to factors like false negatives and false positives in experimentally identifying sites, as well as to non-functional sites. From this analysis, they estimated that approximately 5% of the sites that were conserved at the sequence level, but were known to be phosphorylated in only one of the two species, represented sites that were truly differentially regulated between the two species.
In another study, Jimenez et al. found that phosphorylation sites are less well-conserved in different organisms than would be expected given their functional significance [8], although other studies have shown that phosphorylation sites are better conserved than serine, threonine, and tyrosine residues in general [9,10]. Nguyen-Ba et al. showed that mutations in yeast phos-phorylation sites are highly constrained relative to surrounding sites in both structured and unstructured regions of proteins [11]. Gnad and co-authors [12] found that proteins that con-tain phosphorylation sites are more likely to be conserved across species than proteins in gen-eral, and also developed a web-based tool (PHOSIDA) that integrates evolutionary information about phosphorylation sites with a database of experimentally-determined phosphorylation sites and a phosphorylation site prediction algorithm. Another software program devoted to the evolution of phosphorylation sites is CPhos, which—based on the assumption that functional phosphorylation sites are more likely to be conserved than non-functional sites—aids the user in identifying functional phosphorylation sites by assessing the degree of conservation of a given site in a number of different organisms [13]. Finally, although the study of phosphorylation site conservation has typically been limited to eukaryotes, such studies have also been done in pro-karyotes [14].
While the studies cited above have examined the evolution and conservation of phosphory-lation sites in a limited number of organisms and/or for a limited number of protein kinases, to our knowledge there has not yet been a study characterizing the general conservation of human phosphorylation sites in a wide variety of species. Whereas protein kinases can be read-ily identified using sequence and structural homology, allowing the kinomes of different spe-cies to be characterized and compared relatively easily [15,16], several challenges are
for some species (such as human, mouse, andA. thaliana), our knowledge of phosphorylation sites in other species ranges from sparse (e.g., approximately 500 in cattle) to almost nonexis-tent (e.g., honeybee) [17]. Third, the sequence-based identification of phosphorylation sites is more difficult than the sequence-based identification of protein kinases [18–20].
In this study, a methodology that addresses these challenges is used to characterize the degree of conservation of human phosphorylation sites among a wide variety of species. Phos-phorylation site conservation is then compared to the conservation of both protein kinases and proteins in general. Given that fewer genomic changes are required for the gain or loss of a phosphorylation site as compared to the gain or loss of a protein kinase, we hypothesize that phosphorylation sites will be less conserved than protein kinases.
Materials and Methods
Data
Experimentally-determined human phosphorylation sites (n= 146306) were gathered from the online databases PhosphoSitePlus [17,21,22] and Phospho.ELM [23]. Of these sites, 8842 had one or more references describing the characterization of that site using low-throughput biologi-cal techniques; the remainder were determined using only high-throughput methods (typibiologi-cally mass spectrometry). We will denote the complete set of experimentally-determined human phosphorylation sites asPFand the subset consisting only of sites with low-throughput
refer-ences asPL. Complete eukaryotic proteomes (n= 432) were downloaded from UniProt [24]
using the query“complete:yes ancestor:2759”(where 2759 is the taxonomic ID for eukaryotes).
Measuring phosphorylation site conservation
The degree of phosphorylation site conservation between each pair of speciesSAandSBwas
assessed as follows. For a given phosphorylation sitei, letfi(S) = 1 if the proteome of speciesS
contains phosphorylation sitei; otherwise,fi(S) = 0. Additionally, define the functionsEi(SA,
SB) andBi(SA,SB) as follows:
EiðSA;SBÞ ¼
1 if f
iðSAÞ ¼1 orfiðSBÞ ¼1
0 otherwise
(
BiðSA;SBÞ ¼
1 if f
iðSAÞ ¼1 and fiðSBÞ ¼1
0 otherwise
(
Ei(SA,SB) is equal to 1 if eitherSAorSB(or both) contains phosphorylation sitei.Bi(SA,SB) is
equal to 1 only if bothSAandSBcontain phosphorylation sitei. Finally, we defineC(SA,SB),
which represents the number of phosphorylation sites present in bothSAandSBdivided by the
number present in at least one ofSAandSB(expressed as a percentage). Stated differently, the
valuesC(SA,SB) represent the percentage of phosphorylation sites that are present in at least
one ofSAandSBthat are present in both. Mathematically,
CðSA;SBÞ ¼100 Pp
i¼1BiðSA;SBÞ Pp
i¼1EiðSA;SBÞ
wherepis the number of phosphorylation sites examined. Greater values ofC(SA,SB) indicate
greater conservation, and vice versa.
thefi’s by employing the online tool DAPPLE [25] to predict phosphorylation sites in the vari-ous species using experimentally-determined phosphorylation sites from human (the species with the greatest number of known phosphorylation sites). A brief description of DAPPLE is as follows. DAPPLE uses as input experimentally-determined phosphorylation sites from species other than the species for which predictions are being made (the“target species”). Each known phosphorylation site is represented as a 15-residue subsequence (peptide) of a full protein (with the phosphorylated residue in the center and 7 residues on either side), which is used as a BLAST query against the proteome of the target species. DAPPLE reports a number of pieces of information about each query peptide. Given that protein kinases recognize phosphorylation sites within the context of specific (but degenerate) sequence motifs, the most important piece of information given by DAPPLE is the number of sequence differences between the query peptide and its best match in the target proteome. If the number of sequence differences is small, then it is likely that the recognition pattern remains intact, and thus the residue in the matching peptide that corresponds to the phosphorylation site in the query peptide is consid-ered a putative phosphorylation site. In contrast, if the number of sequence differences is large, then it is likely that the recognition pattern no longer exists, and thus the matching residue is not considered a putative phosphorylation site. For example, residue S53 in the protein with UniProt accession number Q8N0S6 is a known human phosphorylation site [17,21,22]. The 15-mer peptide with S53 at its center isRRKIPQCSQLQEDVD, which spans residues 46–60 in the full protein sequence. A BLAST search against the bovine proteome using this peptide as a query givesRRKIPQGSQLQEDVDas the best match, which is found in the bovine protein with accession number Q5EA18. This peptide comprises residues 48–62 of the full protein, and the phosphorylated residue is S55. Given that there is only one mismatch between the two
sequences (C!G in position 7 of the peptides), it is likely that residue S55 in the bovine protein Q5EA18 is a phosphorylation site.
Thefi’s were calculated from the DAPPLE output as follows. LetQirepresent the 15-mer
peptide corresponding to known human phosphorylation sitei, andHi,Sdenote its best match
in speciesS. We setfi(S) = 1 if the number of sequence differences betweenQiandHi,Swas less
than or equal to a thresholdT; otherwise,fi(S) = 0. To select an appropriate value forT, we
used previously-published data concerning how the number of sequence differences between a query 15-mer and its best match in the target proteome affects the likelihood that the best match is a known phosphorylation site [26]. In addition tofi, an alternative functiongiwas
defined in whichgi(S) = 1 if the number ofnon-conservativesequence differences betweenQi
andHi,Sis less than or equal toT, and 0 otherwise. A substitution was considered
non-conser-vative if the entry for that substitution in the BLOSUM62 substitution matrix was less than zero. The usage offiorgiis explained further at the end of this section.
After selecting an appropriate value forT, the valuesC(SA,SB) were calculated for each pair
of speciesSAandSB, and the results were compiled into a table (similarity matrix). As the
num-ber of species was 432, the numnum-ber of possible pairs of species was 432 2
¼93096. A distanceD (SA,SB) = 100−C(SA,SB) was also calculated for each pair, and the R functionhclustwas
used to perform hierarchical clustering using these distances. Average linkage was used as the linkage method. The functionhc2Newickfrom thectcR package was used to convert the hier-archical clustering to Newick format. The Newickfile was visualized using TreeGraph 2 [27].
Four different variations of the above procedure were performed. The differences between each variation relate to whetherfi(S) orgi(S) was used to determine if speciesScontains
phos-phorylation sitei, and whether the set of phosphorylation sites used wasPForPL. Specifically,
Method 1 usedfiandPF, Method 2 usedfiandPL, Method 3 usedgiandPF, and Method 4 used
To determine how the values ofC(SA,SB) derived using Method 1 compared to those
derived using Methods 2, 3, and 4, the following procedure was used. The methods were com-pared both in terms of the degree of difference (i.e., how different are the results obtained when using Method 1 versus when using Method 2?) and the direction of difference (i.e., do phos-phorylation sites appear to be more conserved or less conserved when using Method 1 versus when using Method 2?). LetC1(SA,SB),C2(SA,SB),C3(SA,SB), andC4(SA,SB) denote the value
ofC(SA,SB) obtained using Methods 1, 2, 3, and 4, respectively. To determine thedegreeof
dif-ference between Method 1 and Method 2, the value |C1(SA,SB)−C2(SA,SB)| was computed for
all possible pairs (SA,SB), generating a list of 93096 values, with each value representing the
degree of difference between the two methods for one pair of species. The mean, median, stan-dard deviation, and range of these differences were then calculated, which together describe the overall degree to which the two methods differ in calculating phosphorylation site conserva-tion. The degree of difference between Method 1 and Method 3 was then determined by calcu-lating the values |C1(SA,SB)−C3(SA,SB)| and then determining the aforementioned statistical
parameters, and similarly for Method 1 versus Method 4. To compute thedirectionalityof the difference between Method 1 and Method 2, the same procedure as above was used except without taking the absolute value (that is,C1(SA,SB)−C2(SA,SB) was computed for each (SA,SB)
instead of |C1(SA,SB)−C2(SA,SB)|), and similarly for Method 1 versus Method 3 and Method 1
versus Method 4.
Measuring protein kinase conservation
To determine the degree to which protein kinases are conserved in different species, protein orthology data were used. As we are not aware of an orthologue database that includes all (or even most) of the 432 species whose proteomes were downloaded from UniProt, twenty species were selected that were present in the orthologue database OrthoMCL-DB [28]. These species represented a range of lineages (mammals:Homo sapiens,Pan troglodytes,Canis lupus famil-iaris,Mus musculus, andRattus norvegicus; insects:Drosophila melanogaster,Apis mellifera, andAnopheles gambiae; fish:Danio rerioandTetraodon nigroviridis; plants:Arabidopsis thali-ana,Oryza sativa, andRicinus communis; birds:Gallus gallus; arachnids:Ixodes scapularis; nematodes:Caenorhabditis elegans; others (single-celled organisms of different lineages): Plas-modium falciparum,Saccharomyces cerevisiae,Chlamydomonas reinhardtii, andTrypanosoma vivax). A list of orthologous groups was obtained from OrthoMCL-DB, where the entry for each group contained a list of the proteins from each species (if any) that were members of that group. Groups for which at least one of the member proteins contained at least one of the terms“tyrosine kinase”,“protein kinase”, or“serine/threonine kinase”were included in the analysis. The degree of protein kinase conservation was assessed using the same general frame-work as was used for determining phosphorylation site conservation. Specifically,fi(S) = 1 if
there existed a protein kinase from speciesSin orthologous groupi, andfi(S) = 0 otherwise. All
of the other functions were defined analogously; in particular,C(SA,SB) represented the
pro-portion of orthologous groups containing a protein kinase from at least one ofSAorSBthat
contained a protein kinase from both.
Measuring general protein conservation
Results
Determining an appropriate threshold
T
To select an appropriate value forT(see theMaterials and Methodssection), we used the data presented in Table 3 of Trost et al. [26]. This table suggests that the more sequence differences between a 15-mer representing a known phosphorylation site and its best match in the target proteome, the lower the probability that the match represents a known phosphorylation site. Letdrepresent the number of sequence differences for which the probability that a match with that number of sequence differences is a known phosphorylation site is approximately half the probability of a match with zero sequence differences being a known phosphorylation site. We choseTto be equal tod. Althoughddiffered somewhat depending on the species, Table 3 of Trost et al. [26] shows thatd6. Thus, we setT= 6.
Measuring phosphorylation site conservation
The degree of phosphorylation site conservationC(SA,SB) was determined between each pair of
speciesSAandSBfor which a complete proteome was available (432 species).C(SA,SB) represents
the percentage of phosphorylation sites present in at least one ofSAandSBthat were present in
both. As described earlier, we performed four different variations of our procedure for determin-ing theC(SA,SB) values. These variations were denoted Method 1, Method 2, Method 3, and
Method 4. The differences between the four methods relate to the dataset of human phosphory-lation sites (Methods 1 and 3 used the entire dataset of human phosphoryphosphory-lation sites, while Methods 2 and 4 used the subset of those sites that have been verified using low-throughput bio-logical techniques) and in how phosphorylation site conservation was measured (Methods 1 and 2 used the number of sequence differences between a query 15-mer and its best match in the tar-get proteome, while Methods 3 and 4 used the number ofnon-conservativesequence differences). The reason that Methods 2 and 4 used the subset of human phosphorylation site data verified using low-throughput techniques (rather than the full dataset of human phosphorylation sites) is that it has been suggested that a sizeable portion of sites identified only using discovery-mode mass-spectrometry experiments are non-functional and do not play a role in cellular signaling [17,29], and because phosphorylation sites with known functions appear to be more evolution-arily conserved than sites with unknown function [9,10]. Thus, restricting the analysis to sites that have been verified to be functional may provide a different picture of phosphorylation site conservation as compared to using all sites, including those identified only via mass spectrome-try. The reason for performing the procedure by counting only non-conservative substitutions rather than all substitutions when determining the presence or absence of a given site (Methods 3 and 4) is that conservative substitutions surrounding a phosphorylation site may have a smaller impact on the ability of the kinase to recognize that site than non-conservative substitutions. In the following, we begin by describing the results obtained using Method 1. We then compare the results when using Method 1 to the results when using Methods 2, 3, and 4.
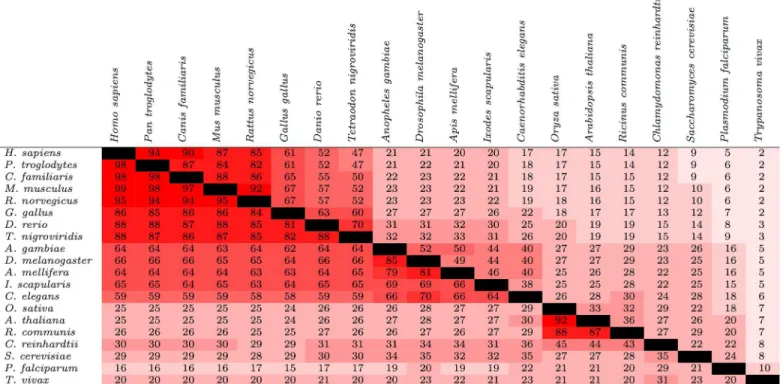
The upper triangle ofFig 1contains the values ofC(SA,SB) when using Method 1 for the 20
species described in the Materials and Methods section;S1 Tableincludes all 432 species. These conservation values appear to be consistent with prior studies; for instance, Freschi et al. examined the conservation of known phosphorylation sites in human and mouse, and found that 84% of the phosphorylation sites that had been experimentally determined in at least one of the two species were conserved at the sequence level [7]. Here, we report that 87% of experi-mentally-determined human sites were conserved at the sequence level in mouse (Fig 1).
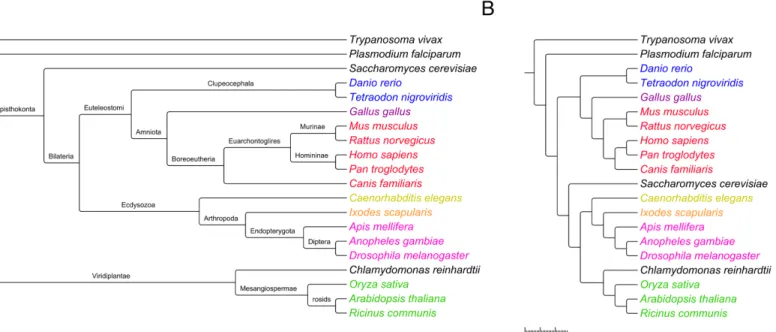
A dendrogram created using hierarchical clustering was generated using the distancesD(SA,
the National Center for Biotechnology Information (NCBI) [30] Taxonomy Browser (Fig 2). Visually, the two trees are quite similar—most branches that are close to leaves have identical sets of descendants, although the branching patterns differ more closer to the root. To obtain a quantitative measure of the similarity of the two trees, we used the T-REX web server [31] to compute the Robinson and Foulds distance, which reflects the number of operations needed to convert one tree into another [32]. The calculated distance was 11; thus, relatively few opera-tions are needed to transform the NCBI tree into the tree based on the conservation of human phosphorylation sites. A dendrogram based on the distancesD(SA,SB) for all 432 species is
given inS1 Fig.
Interestingly, the degree of phosphorylation site conservation appeared to differ depending on the residue being phosphorylated. Specifically, the average of all theC(SA,SB) values was
21.8 for Ser sites, 31.7 for Thr sites, and 28.7 for Tyr sites (all differences statistically significant withp value0
:001according to a two-tailed t-test).S2–S4Tables contain the values ofC
(SA,SB) for Ser, Thr, and Tyr sites, respectively.S5 Tablecontains the average value ofC(SA,
SB) for each species (averaged over all of the other species) for each phosphorylated residue.
Figs1and2show that the relative degree of phosphorylation site conservation among the different species was consistent with their known evolutionary relationships. For instance,Fig 1shows that 94% of the phosphorylation sites in eitherH. sapiensandP. troglodyteswere found in both (C(SA,SB) = 94), whereasC(SA,SB) = 21 forH. sapiensandD. melanogaster. The
pair of species with the lowest degree of similarity includedH. sapiensand the parasiteT. vivax, withC(SA,SB) = 2.
To determine the degree of difference between the values ofC(SA,SB) determined using
Method 1 and the values obtained using Method 2, |C1(SA,SB)−C2(SA,SB)| was calculated for
Fig 1. Conservation of phosphorylation sites (upper triangle) and protein kinases (lower triangle) among 20 species from a diverse range of lineages.For a given pair of species, the values represent the percentage of phosphorylation sites or protein kinases found in at least one of the two species that were found in both species (the valuesC(SA,SB) described in the text). The cells are colored based on the value within; the closer the value is to 100, the brighter the shade of red.
each pair (SA,SB), whereC1(SA,SB) represents the value ofC(SA,SB) calculated using Method 1
andC2(SA,SB) represents the value ofC(SA,SB) calculated using Method 2. LetErepresent the
list of differences for all pairs (SA,SB). Some simple descriptive statistics (mean, median, range,
and standard deviation) were then calculated for the values inE. The same procedure was then used to characterize how the values ofC(SA,SB) differ between Method 1 and Method 3, and
between Method 1 and Method 4. The results of this analysis are given inTable 1, which shows that the degrees of difference between Method 1 and Methods 2, 3, and 4 were relatively small. Specifically, the mean difference between Method 1 and Method 2 was 2.7 (median = 3). As the values ofC(SA,SB) can range between 0 and 100, this represents a mean difference of
approxi-mately 3 percentage points. The mean differences when comparing Method 1 with Method 3 and when comparing Method 1 with Method 4 were slightly higher (3.8 and 4.8, respectively). The standard deviations of the differences were also quite small, ranging from 1.9 (Method 1 versus Method 2) to 3.0 (Method 1 versus Method 4). This suggests that, while the choice of method for calculating theC(SA,SB) values makes some difference, it does not markedly
change the measured degree of phosphorylation site conservation among the different species. The four methods were also compared in order to measure the direction of differences between theC(SA,SB) values. This was done using a simple modification of the above
proce-dure: to compare Method 1 with Method 2,C1(SA,SB)−C2(SA,SB) was calculated for each
instead of |C1(SA,SB)−C2(SA,SB)|, and similarly for Method 1 versus Method 3 and Method 1
versus Method 4. The results of this analysis are also shown inTable 1.
Interestingly, the mean conservation among species was greater when using Method 1 (which used the full dataset of known human phosphorylation sites) than when using Method 2 (which used only known human phosphorylation sites that have been verified using low-throughput biological techniques). This is inconsistent with some prior findings, Fig 2. Comparison between the taxonomy of the 20 species described in the Materials and Methods section according to the National Center for Biotechnology Information (NCBI) Taxonomy Browser (panel A), and the dendrogram generated based on the phosphorylation site conservation of pairs of species (panel B).The scale applies to panel B only, with the branch lengths representing values ofC(SA,SB). The species names are color-coded based on lineage: red, mammals; pink, insects; blue, fish; green, plants; purple, birds; orange, arachnids; yellow, nematodes; black, others (single-celled organisms of different lineages).
which have suggested that phosphorylation sites with unknown functions are less likely to be conserved [9,10]. An initially plausible explanation for this observation is that there are dif-ferent levels of intra-proteome redundancy of high-throughput sites as compared to low-throughput sites. Unfortunately, because of the method DAPPLE uses to predict phosphory-lation sites, this cannot explain the discrepancy. Specifically, DAPPLE uses a BLAST search to determine the best match between a given human phosphorylation site (represented as a 15-mer peptide with the phosphorylated residue in the center) and the target proteome. For the purposes of this study, only the best match in a particular proteome is important—any other matches are ignored. This means that the result will be the same whether the target pro-teome contains just one match, or (say) 10 matches, making the level of intra-propro-teome redundancy irrelevant.
Determining phosphorylation site conservation by counting only non-conservative substi-tutions rather than all substisubsti-tutions had a relatively small effect on the measured levels of phos-phorylation site conservation (Method 1 versus Method 3;Table 1), although the standard deviation of the differences (4.5) was somewhat higher than for the comparison between Method 1 and Method 2. The mean difference when comparing Method 1 and Method 4, which differed both in the phosphorylation site dataset used and in the function for determin-ing whether a phosphorylation site is present in a given species, was similar to the comparison between Method 1 and Method 2, although the standard deviation was higher, which was expected given that two variables were modified in the comparison between Method 1 and Method 4 versus only one in the comparison between Method 1 and Method 2.
S6–S8Tables contain the values ofC(SA,SB) obtained for all 432 species when using Method
2, Method 3, and Method 4, respectively; similarly,S2–S4Figs contain the dendrogram for all 432 species when using Methods 2–4.
Measuring protein kinase conservation
The degree of protein kinase conservation for the 20 species described earlier is shown in the lower triangle ofFig 1. Consistent with the hypothesis given at the end of the Introduction sec-tion, the degree of protein kinase conservation was generally greater than the degree of phos-phorylation site conservation. For example, forH. sapiensandM. musculus,C(SA,SB) = 88 for
phosphorylation sites andC(SA,SB) = 99 for protein kinases. The difference in conservation
appeared to heighten at greater evolutionary distances; for instance, forH. sapiensandI. scapu-laris,C(SA,SB) = 20 for phosphorylation sites versusC(SA,SB) = 65 for protein kinases.
How-ever, there were a few exceptions to this trend, typically when one species in a pair was a plant. Table 1. Comparison between the values ofC(SA,SB) generated using Method 1 and those generated using the other three methods (X= 2, 3, and
4).
Degree Directionality
Method # (X) Mean Median Range Sthev Mean Median Range Sthev
2 2.7 3 [0, 19] 1.9 2.1 2 [−12, 19] 2.6
3 3.8 4 [0, 18] 2.6 0.8 1 [−11, 18] 4.5
4 4.8 5 [0, 26] 3.0 1.9 3 [−12, 26] 5.3
See theMaterials and Methodsfor descriptions of each method. The“degree”section of the table represents the degree to which the values ofC(SA,SB) obtained using Method 1 differ from those obtained using Methods 2, 3, and 4, and is calculated as |C1(SA,SB)−CX(SA,SB)|. The“directionality”section represents whether Method 1 tends to indicate more or less phosphorylation site conservation between pairs of species than the other methods (a positive mean and median indicates greater conservation, and vice versa), and is calculated asC1(SA,SB)−CX(SA,SB).
For the pairA. thalianaandA. gambiae, for example,C(SA,SB) = 27 for both phosphorylation
sites and protein kinases.
Measuring general protein conservation
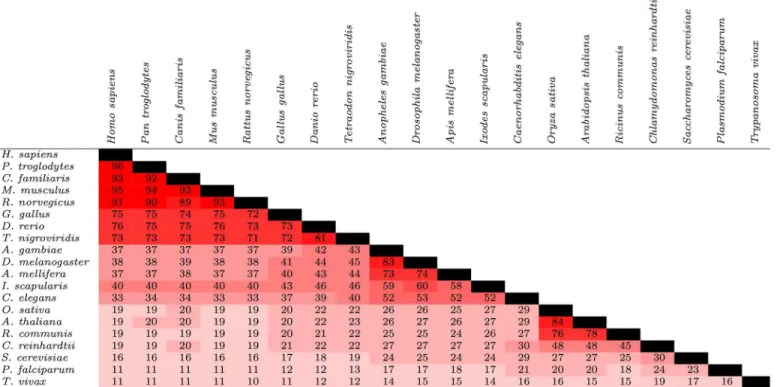
The degree of conservation of proteins in general among the 20 species is shown inFig 3. Overall, the degree of conservation of general proteins appeared to be higher than phosphorylation sites but lower than protein kinases. For instance, betweenH. sapiensandM. musculus,C(SA,SB) = 95
for general proteins, compared to 88 for phosphorylation sites and 99 for protein kinases. This trend appeared to extend to more distantly-related species; for instance,C(SA,SB) = 40 for
gen-eral proteins betweenH. sapiensandI. scapularis, compared toC(SA,SB) = 20 andC(SA,SB) = 65
for phosphorylation sites and protein kinases, respectively. As before, pairs that included a plant were often exceptions to this pattern; for instance,C(SA,SB) = 26 forA. thalianaandA. gambiae
versus 27 for both phosphorylation sites and protein kinases.
Discussion
All eukaryotic species—even those that are closely related—exhibit substantial phenotypic dif-ferences. While some of these differences can be explained by the presence/absence of, or sequence variation within, specific genes and their corresponding proteins, regulatory mecha-nisms (e.g., post-translational modifications, DNA methylation, mRNA silencing and degrada-tion, alternative splicing) also play a significant role. Phosphorylation is the most widespread post-translational modification in eukaryotes, and is integral to the control of almost every cel-lular signaling process. Thus, phosphorylation patterns dramatically affect the phenotype of a given organism. There are two major mechanisms by which phosphorylation-mediated Fig 3. Conservation of proteins among 20 species from a diverse range of lineages.For a given pair of species, the values represent the percentage of proteins found in at least one of the two species that were found in both species. The cells are colored based on the value within; the closer the value is to 100, the brighter the shade of red.
regulatory pathways may be modified: the gain or loss of phosphorylation sites, and the gain or loss of protein kinases (although other mechanisms exist, such as sequence or structural changes to protein kinases that alter their specificity). We hypothesized that phosphorylation sites would be less conserved than protein kinases because less genomic modification is required for their gain or loss.
The data presented here support this hypothesis. For a given pair of species, the percentage of phosphorylation sites found in at least one of the two species that were found in both was generally less than the percentage of protein kinases found in at least one of the two species that were found in both (Fig 1,S1 TableandS6–S8Tables). These data tentatively suggest that the gain or loss of phosphorylation sites may play a greater role in contributing to phenotypic differences among species than the gain or loss of protein kinases, and may help explain (for instance) why organisms with similar kinomes exhibit very different phenotypes.
While there exists a generally accepted taxonomy for eukaryotes, there is no definitive method for ascertaining phylogenetic relationships. Methods using genetic information, while widely used and accepted, can nonetheless exhibit significant biases [33]. Nonetheless, the tree we generated based on phosphorylation site conservation was very similar to the classifications given by the NCBI Taxonomy Browser [30], which amalgamates taxonomic information from multiple sources (Fig 2).
In summary, we would like to emphasize that, given the predictive nature of this study, additional research—preferably using experimentally-determined phosphorylation sites—is required to more clearly characterize phosphorylation site conservation among species, and to define the relative importance of phosphorylation site evolution and protein kinase evolution in influencing phenotype. As more and more phosphorylation sites are discovered in different organisms using mass spectrometry and other biological techniques, our ability to accurately characterize phosphorylation site conservation will continue to improve.
Supporting Information
S1 Table. Values ofC(SA,SB) for all 432 species when using Method 1. (XLSX)
S2 Table. Values ofC(SA,SB) for all 432 species for Ser sites when using Method 1. (XLSX)
S3 Table. Values ofC(SA,SB) for all 432 species for Thr sites when using Method 1. (XLSX)
S4 Table. Values ofC(SA,SB) for all 432 species for Tyr sites when using Method 1. (XLSX)
S5 Table. Average value ofC(SA,SB) for each species (averaged over all of the other species)
for each phosphorylated residue when using Method 1.
(XLSX)
S6 Table. Values ofC(SA,SB) for all 432 species when using Method 2. (XLSX)
S7 Table. Values ofC(SA,SB) for all 432 species when using Method 3. (XLSX)
S8 Table. Values ofC(SA,SB) for all 432 species when using Method 4. (XLSX)
S1 Fig. Dendrogram created using hierarchical clustering for all 432 species when using Method 1.
(PDF)
S2 Fig. Dendrogram created using hierarchical clustering for all 432 species when using Method 2.
(PDF)
S3 Fig. Dendrogram created using hierarchical clustering for all 432 species when using Method 3.
(PDF)
S4 Fig. Dendrogram created using hierarchical clustering for all 432 species when using Method 4.
(PDF)
Acknowledgments
Author Contributions
Conceived and designed the experiments: BT AK SN. Performed the experiments: BT. Ana-lyzed the data: BT. Contributed reagents/materials/analysis tools: AK. Wrote the paper: BT AK SN.
References
1. Hunter T. Protein kinases and phosphatases: the yin and yang of protein phosphorylation and signal-ing. Cell. 1995; 80(2):225–36. doi:10.1016/0092-8674(95)90405-0PMID:7834742
2. Manning G, Whyte DB, Martinez R, Hunter T, Sudarsanam S. The protein kinase complement of the human genome. Science. 2002; 298(5600):1912–34. doi:10.1126/science.1075762PMID:12471243
3. The Arabidopsis Genome Initiative. Analysis of the genome sequence of the flowering plant Arabidop-sis thaliana. Nature. 2000; 408(6814):796–815. doi:10.1038/35048692PMID:11130711
4. Rinschen MM, Pahmeyer C, Pisitkun T, Schnell N, Wu X, Maaß M, et al. Comparative phosphoproteo-mic analysis of mammalian glomeruli reveals conserved podocin C-terminal phosphorylation as a determinant of slit diaphragm complex architecture. Proteomics. 2015; 15(7):1326–31. doi:10.1002/ pmic.201400235PMID:25420462
5. Kim SH, Lee CE. Counter-regulation mechanism of IL-4 and IFN-αsignal transduction through cytosolic
retention of the pY-STAT6:pY-STAT2:p48 complex. Eur J Immunol. 2011; 41(2):461–72. doi:10.1002/ eji.201040668PMID:21268015
6. Moses AM, Liku ME, Li JJ, Durbin R. Regulatory evolution in proteins by turnover and lineage-specific changes of cyclin-dependent kinase consensus sites. Proc Natl Acad Sci U S A. 2007; 104(45):17713–
8. doi:10.1073/pnas.0700997104PMID:17978194
7. Freschi L, Osseni M, Landry CR. Functional divergence and evolutionary turnover in mammalian phos-phoproteomes. PLoS Genet. 2014; 10(1):e1004062. doi:10.1371/journal.pgen.1004062PMID:
24465218
8. Jiménez JL, Hegemann B, Hutchins JRA, Peters JM, Durbin R. A systematic comparative and struc-tural analysis of protein phosphorylation sites based on the mtcPTM database. Genome Biol. 2007; 8 (5):R90. doi:10.1186/gb-2007-8-5-r90PMID:17521420
9. Malik R, Nigg EA, Körner R. Comparative conservation analysis of the human mitotic phosphopro-teome. Bioinformatics. 2008; 24(12):1426–32. doi:10.1093/bioinformatics/btn197PMID:18426804
10. Landry CR, Levy ED, Michnick SW. Weak functional constraints on phosphoproteomes. Trends Genet. 2009; 25(5):193–7. doi:10.1016/j.tig.2009.03.003PMID:19349092
11. Nguyen Ba AN, Moses AM. Evolution of characterized phosphorylation sites in budding yeast. Mol Biol Evol. 2010; 27(9):2027–37. doi:10.1093/molbev/msq090PMID:20368267
12. Gnad F, Ren S, Cox J, Olsen JV, Macek B, Oroshi M, et al. PHOSIDA (phosphorylation site database): management, structural and evolutionary investigation, and prediction of phosphosites. Genome Biol. 2007; 8(11):R250. doi:10.1186/gb-2007-8-11-r250PMID:18039369
13. Zhao B, Pisitkun T, Hoffert JD, Knepper MA, Saeed F. CPhos: a program to calculate and visualize evo-lutionarily conserved functional phosphorylation sites. Proteomics. 2012; 12(22):3299–303. doi:10. 1002/pmic.201200189PMID:23001821
14. Nakedi KC, Nel AJM, Garnett S, Blackburn JM, Soares NC. Comparative Ser/Thr/Tyr phosphoproteo-mics between two mycobacterial species: the fast growing Mycobacterium smegmatis and the slow growing Mycobacterium bovis BCG. Front Microbiol. 2015; 6:237. doi:10.3389/fmicb.2015.00237
PMID:25904896
15. Manning G, Plowman GD, Hunter T, Sudarsanam S. Evolution of protein kinase signaling from yeast to man. Trends Biochem Sci. 2002; 27(10):514–20. doi:10.1016/S0968-0004(02)02179-5PMID:
12368087
16. Caenepeel S, Charydczak G, Sudarsanam S, Hunter T, Manning G. The mouse kinome: discovery and comparative genomics of all mouse protein kinases. Proc Natl Acad Sci U S A. 2004; 101(32):11707–
12. doi:10.1073/pnas.0306880101PMID:15289607
17. Hornbeck PV, Zhang B, Murray B, Kornhauser JM, Latham V, Skrzypek E. PhosphoSitePlus, 2014: mutations, PTMs and recalibrations. Nucleic Acids Res. 2015; 43(Database issue):D512–20. doi:10. 1093/nar/gku1267PMID:25514926
18. Xue Y, Gao X, Cao J, Liu Z, Jin C, Wen L, et al. A summary of computational resources for protein phos-phorylation. Curr Protein Pept Sci. 2010; 11(6):485–96. doi:10.2174/138920310791824138PMID:
19. Trost B, Kusalik A. Computational prediction of eukaryotic phosphorylation sites. Bioinformatics. 2011; 27(21):2927–35. doi:10.1093/bioinformatics/btr525PMID:21926126
20. Dou Y, Yao B, Zhang C. PhosphoSVM: prediction of phosphorylation sites by integrating various pro-tein sequence attributes with a support vector machine. Amino Acids. 2014; 46(6):1459–69. doi:10. 1007/s00726-014-1711-5PMID:24623121
21. Hornbeck PV, Chabra I, Kornhauser JM, Skrzypek E, Zhang B. PhosphoSite: A bioinformatics resource dedicated to physiological protein phosphorylation. Proteomics. 2004; 4(6):1551–61. doi:10.1002/ pmic.200300772PMID:15174125
22. Hornbeck PV, Kornhauser JM, Tkachev S, Zhang B, Skrzypek E, Murray B, et al. PhosphoSitePlus: a comprehensive resource for investigating the structure and function of experimentally determined post-translational modifications in man and mouse. Nucleic Acids Res. 2012; 40(Database issue):D261–70. doi:10.1093/nar/gkr1122PMID:22135298
23. Dinkel H, Chica C, Via A, Gould CM, Jensen LJ, Gibson TJ, et al. Phospho.ELM: a database of phos-phorylation sites–update 2011. Nucleic Acids Res. 2011; 39(Database issue):D261–7. doi:10.1093/ nar/gkq1104PMID:21062810
24. UniProt Consortium. UniProt: a hub for protein information. Nucleic Acids Res. 2015; 43(Database issue):D204–12. doi:10.1093/nar/gku989PMID:25348405
25. Trost B, Arsenault R, Griebel P, Napper S, Kusalik A. DAPPLE: a pipeline for the homology-based pre-diction of phosphorylation sites. Bioinformatics. 2013; 29(13):1693–5. doi:10.1093/bioinformatics/ btt265PMID:23658419
26. Trost B, Napper S, Kusalik A. Case study: using sequence homology to identify putative phosphoryla-tion sites in an evoluphosphoryla-tionarily distant species (honeybee). Brief Bioinform. 2015; 16(5):820–9. doi:10. 1093/bib/bbu040PMID:25380664
27. Stöver BC, Müller KF. TreeGraph 2: combining and visualizing evidence from different phylogenetic analyses. BMC Bioinformatics. 2010; 11:7. doi:10.1186/1471-2105-11-7PMID:20051126
28. Chen F, Mackey AJ, Stoeckert CJ Jr, Roos DS. OrthoMCL-DB: querying a comprehensive multi-spe-cies collection of ortholog groups. Nucleic Acids Res. 2006; 34(Database issue):D363–8. doi:10.1093/ nar/gkj123PMID:16381887
29. Lienhard GE. Non-functional phosphorylations? Trends Biochem Sci. 2008; 33(8):351–2. doi:10.1016/ j.tibs.2008.05.004PMID:18603430
30. Sayers EW, Barrett T, Benson DA, Bryant SH, Canese K, Chetvernin V, et al. Database resources of the National Center for Biotechnology Information. Nucleic Acids Res. 2009; 37(Database issue):D5–
15. doi:10.1093/nar/gkn741PMID:18940862
31. Boc A, Diallo AB, Makarenkov V. T-REX: a web server for inferring, validating and visualizing phyloge-netic trees and networks. Nucleic Acids Res. 2012; 40(Web Server issue):W573–9. doi:10.1093/nar/ gks485PMID:22675075
32. Robinson DF, Foulds LR. Comparison of phylogenetic trees. Math Biosci. 1981; 53:131–147. doi:10. 1016/0025-5564(81)90043-2
33. Hahn MW. Bias in phylogenetic tree reconciliation methods: implications for vertebrate genome evolu-tion. Genome Biol. 2007; 8(7):R141. doi:10.1186/gb-2007-8-7-r141PMID:17634151