Socioeconomic inequality
in catastrophic health
expenditure in Brazil
Desigualdade socioeconômica nos
gastos catastróficos em saúde no
Brasil
I Programa de Pós-Graduação em Saúde
Pública. Centro de Ciências da Saúde. Universidade Federal de Santa Catarina. Florianópolis, SC, Brasil
II Programa de Pós-Graduação em
Epidemiologia. Universidade Federal de Pelotas. Pelotas, RS, Brasil
III Departamento de Medicina Social.
Faculdade de Medicina. Universidade Federal de Pelotas. Pelotas, RS, Brasil
IV Diretoria de Estudos Setoriais. Instituto de
Pesquisa Econômica Aplicada. Brasília, DF, Brasil
V Australian Research Centre for Population
Oral Health. School of Dentistry. The University of Adelaide. Adelaide, Australia Correspondence:
Alexandra Crispim Boing
Universidade Federal de Santa Catarina Centro de Ciências da Saúde Campus Universitário – Trindade 88034-500 Florianópolis, SC, Brasil E-mail: [email protected] Received: 8/29/2013 Approved: 2/26/2014
Article available from: www.scielo.br/rsp
ABSTRACT
OBJECTIVE: To analyze the evolution of catastrophic health expenditure and the inequalities in such expenses, according to the socioeconomic characteristics of Brazilian families.
METHODS: Data from the National Household Budget 2002-2003 (48,470 households) and 2008-2009 (55,970 households) were analyzed. Catastrophic
health expenditure was deined as excess expenditure, considering different
methods of calculation: 10.0% and 20.0% of total consumption and 40.0% of the family’s capacity to pay. The National Economic Indicator and schooling were considered as socioeconomic characteristics. Inequality measures utilized were the relative difference between rates, the rates ratio, and concentration index.
RESULTS: The catastrophic health expenditure varied between 0.7% and 21.0%, depending on the calculation method. The lowest prevalences were noted in relation to the capacity to pay, while the highest, in relation to total consumption. The prevalence of catastrophic health expenditure increased by 25.0% from 2002-2003 to 2008-2009 when the cutoff point of 20.0% relating to the total consumption was considered and by 100% when 40.0% or more of the capacity to pay was applied as the cut-off point. Socioeconomic inequalities in the catastrophic health expenditure in Brazil between
2002-2003 and 2008-2009 increased signiicantly, becoming 5.20 times higher
among the poorest and 4.17 times higher among the least educated.
CONCLUSIONS: There was an increase in catastrophic health expenditure among Brazilian families, principally among the poorest and those headed by the least-educated individuals, contributing to an increase in social inequality.
DESCRIPTORS: Income. Health Expenditure. Health Inequality. Social Inequity. Health Economics.
Alexandra Crispim BoingI
Andréa Dâmaso BertoldiII
Aluísio Jardim Dornellas de BarrosIII
Leila Garcia PosenatoIV
633
Rev Saúde Pública 2014;48(4):632-641
Catastrophic health expenditure (CHE) is defined
as the spending on health that exceeds a pre-deined
percentage of a household’s total costs and its capacity to pay.19,21 The literature indicates different forms of calculations and cutoff points for estimating CHE,1,6,13,19,21 although there is no consensus over the most adequate form to be used in studies regarding this subject.
However, regardless of the method selected for its calculation, CHE has great repercussions on people’s lives, discouraging them at times from using health services and resulting in their non-adherence to medic-inal therapies and postponement of physical examina-tions, consultaexamina-tions, and necessary procedures.a In addi-tion, this may result in a reduction in consumption of the goods and services essential to people’s daily lives, thus exposing families to social risk and quite often to economic ruin.18
ABSTRACT
OBJETIVO: Analisar a evolução dos gastos catastróicos em saúde e as desigualdades
nesses gastos, segundo características socioeconômicas das famílias brasileiras.
MÉTODOS: Foram analisados dados da Pesquisa de Orçamentos Familiares de
2002-2003 (48.470 domicílios) e 2008-2009 (55.970 domicílios). Gasto catastróico em saúde foi deinido como despesas em excesso, considerando diferentes métodos
de cálculo: 10,0% e 20,0% do consumo total e 40,0% da capacidade de pagamento da família. Consideraram-se indicadores socioeconômicos o Indicador Econômico Nacional e a escolaridade. As medidas de desigualdade utilizadas foram a diferença relativa entre taxas, razão das taxas e índice de concentração.
RESULTADOS: Os gastos catastróicos variaram entre 0,7% e 21,0%, a depender do método de cálculo. As menores prevalências foram observadas em relação à
capacidade de pagamento, enquanto as maiores, em relação ao total do consumo.
Houve aumento na prevalência de gastos catastróicos em saúde de 25,0%,
entre 2002-2003 e 2008-2009, quando utilizado o ponto de corte de 20,0% em relação ao total de consumo, e de 100% quando aplicado o ponto de corte de 40,0% da capacidade de pagamento. Houve expressiva e crescente desigualdade
socioeconômica na prevalência de gasto catastróico em saúde no Brasil entre 2002-2003 e 2008-2009, chegando a ser 5,2 vezes maior o gasto catastróico
entre os mais pobres e 4,2 vezes maior nos menos escolarizados.
CONCLUSÕES: Houve crescimento da prevalência do gasto catastróico entre as famílias brasileiras, principalmente entre aquelas mais pobres e cheiadas por
indivíduos menos escolarizados, contribuindo para o aumento das desigualdades socioeconômicas.
DESCRITORES: Renda. Gastos em Saúde. Desigualdades em Saúde. Iniquidade Social. Economia da Saúde.
INTRODUCTION
Family health expenditure in Brazil is especially concerning. Between 1995 and 2010, an increase in public health expenditure was observed; however, this was accompanied by greater expenditure by families and organizations with health plans and in direct costs.8,9 Although the country possesses a public health system boasting universality, integrity and equality, it is one of the few in the world where the private health expendi-ture surpasses government expendiexpendi-ture.a
Multicentric research conducted by Xu et al21 analyzed
data from 59 countries and classiied Brazil as second
in terms of percentage of population with catastrophic expenditure (10.3%). However, other studies analyzing CHE exclusively in Brazil used different forms of calculations for obtaining the indicator and reported
lower igures compared with those reported by Xu
et al.21 According to the data from the 1998 National Household Sample Survey (PNAD), the prevalence of catastrophic expenditure is 3.7%.6 Analysis of the
Pesquisa de Orçamentos Familiares (POF – Family Budget Research) from 2002 to 2003 also presented
different cutoff points and identiied a prevalence that
varied from 2.0% to 16.0% of families with CHE in the country.1,b
The socioeconomic level of families is intimately linked with the risk of CHE and family impoverishment. Those families belonging to the lowest quintiles of income present a greater risk of incurring CHE and impoverish-ment resulting from such expenditure is more common than that in families belonging to the higher income quintiles.c Disparities in social, economic, and envi-ronmental conditions in different regions may play an important role in the risk of incurring CHE.2,17
To analyze data regarding catastrophic expenditure in the country, its evolution throughout the years, and its distribution according to socioeconomic strata of society is of fundamental importance, both for the development and evaluation of health policies as well
as for the eficient management of programs intended
to reduce the magnitude and inequality occurring from such a phenomenon.
Revision of literature published in 2012 identiied few
studies on CHE in Brazil,1,2,6,10,c among which none analyzed the evolution of inequalities resulting from the conclusions contemplating the 2002-2003 and 2008-2009 periods, the two most recent POF and the only ones based on a sample representing the entire nation.
The objective of this study was to analyze the evolu-tion of CHE and the inequalities in these expenses according to the socioeconomic characteristics of Brazilian families.
METHODS
Data from POF conducted in Brazil during 2002-2003 and 2008-2009 were analyzed. The POF has national scope; it is conducted by the Brazilian Institute of Geography and Statistics (IBGE) since the 1970s, and its main objective is to obtain information about the budget structure of families and Brazilians.d,e
In the research conducted in the two biennia cited above, a sample plan was adopted by conglomerates, where 48,470 households were interviewed in the POF of 2002-2003 and 55,970 households in the POF of
2008-2009. Detailed information on the methodology may be found in the IBGE publications.d,e
The collection of data regarding expenditure included all monetary and non-monetary expenses of families during different recording periods, varying between seven days, 30 days, 90 days and 12 months. The mone-tary expenses are those carried out through means of payment, on demand or over a period of time, in cash or by check or credit card. The non-monetary expenses do not involve monetary payment, corresponding to acquisitions by means of donations, taken from the
business, own production, ishing, hunting or gathering.
The income data corresponded to a 12 month period. The health expenditure varied from 30 to 90 days. All
igures were annualized and subject to delation. The index igures used for delation as well as the reference
dates are available in IBGE publications.d,e
The outcome of the current study was the catastrophic expenditure on health. Due to a lack of consensus in domestic and international literature concerning the best methodology for calculating such expenditure, three different forms of calculations, widespread in literature, were employed: methodology proposed by Xu et al21 (2003), used by Wagstaff & Van Doorslaer19 (2003),and a variation of the Wagstaff & Van Doorslaer methodology.7,12 Thus, a more deep understanding of the phenomenon in the country is possible as well as better
comparison of results with indings from other countries.
The methodology used by Xu et al21 (2003) employs the
concept of the capacity to pay, deined as the subtraction
of subsistence (se) expenses of each household from
their total costs. When the igures derived from this
operation were negative, the expenditure in subsistence was substituted by the expenditure on food in the equa-tion. The subsistence expenditure, in turn, was equal to the average expenditure with food for the households among the 45 and 55 percentiles in expenditure with food (lp) multiplied by the number of residents in each household (size) to the power of beta (β), i.e., if se = lp * sizeβ.21 The igure for β was obtained for each
bien-nium of the POF by regression of ixed effects, where
the outcome was the logarithm of household expen-diture on food as a function of the logarithm of the household size. CHE was considered to exist when the
coeficient of the division of total health expenditure
by the capacity of payment was equal to or greater than 20.0% and 40.0%.
b Diniz BP, Servo LM, Piola SF, Eirado M. Gasto das Famílias com saúde no Brasil: evolução e debate sobre gasto catastrófico. In: Silveira FG,
Servo LM, Menezes, Piola SF, organizadores. Gasto e consumo das famílias brasileiras contemporâneas. Brasília (DF): Instituto de Pesquisa Econômica Aplicada; 2007.
c Diaz MDM, Sarti FM, Campino ACC, Lunes RF. Catastrophic health expenditure in Brazil: Regional differences, budget constraints and
private health insurance. In: Knaul FM, Wong R, Arreola-Ornelas H, organizadores. Financing health in Latin America: household spending and impoverishment. vol. 1. Cambridge: Global Equity Initiative/Harvard University; 2012.
d Instituto Brasileiro de Geografia e Estatística. Pesquisa de Orçamentos Familiares 2008-2009. Antropometria e estado nutricional de crianças,
adolescentes e adultos no Brasil. Rio de Janeiro; 2010.
e Instituto Brasileiro de Geografia e Estatística. Pesquisa de Orçamentos Familiares 2002-2003: primeiros resultados: Brasil e grandes regiões.
635
Rev Saúde Pública 2014;48(4):632-641
In the methodology used by Wagstaff & Van Doorslaer19 (2003), the CHE was calculated by dividing global health expenditure by the total household expendi-ture, discounting in the denominator the amount spent
on food (χ 100). The cutoff points used to deine CHE were ≥ 10.0% and ≥ 20.0%.
Finally, using the variation of the Wagstaff & Van Doorslaer19 methodology, CHE was calculated consid-ering the total health expenditure as the numerator and
total household expenditure as the denominator (χ 100) with cutoff points of ≥ 10.0% and ≥ 20.0% to deine
the outcome.7,12
The socioeconomic variables used were the academic level of the head of family and the domestic economic index (DEI).3 The academic level was obtained in the completed years of study and categorized from zero to
four, ive to eight, nine to eleven and twelve years or
more. The DEI was calculated according to a proposal by Barros & Victoria3 (2005), considering for analysis 12 assets available in the household and the academic level of the head of family. Thereafter, the variable was categorized in quintiles, with Q1 being the quintile with a worse socioeconomic situation and Q5 the one with the best socioeconomic situation.
The prevalence of outcomes according to each meth-odology employed was described for all categories of socioeconomic variables in the study. The estimates were generated for both biennia of the POF as a means of comparison. The linear tendency test was used to test the difference between the prevalence of CHE among categories of socioeconomic variables.
In analyzing the socioeconomic inequalities in cata-strophic expenditure prevalence, the following measures of inequality were used: (i) relative difference between rates, calculated as the difference in propor-tions of outcomes among the extreme socioeconomic groups; (ii) ratio of rates, division among proportions of outcomes of the worst socioeconomic level by the proportion of the best level; and (iii) concentration index, calculated for the DEI by means of the relative and accumulated frequency of catastrophic expendi-ture in the population by applying Brown’s formula
(G = 1- ∑k-1 1- (Y
i+1+ Yi) (Xi+1- Xi)), where y is the population’s accumulated frequency, and x is the accu-mulated frequency of the population’s CHE, sorted by socioeconomic variables.15
The graphic representation of the outcomes distribu-tion was also performed according to their concentra-tion curves. They represent the cumulative distribuconcentra-tion of each outcome according to the population’s cumu-lative proportion.20
The data was analyzed resorting to the statistics program Stata 9, considering the effect of delineation of the study and sample weightings.
RESULTS
In 2002-2003, 78.0% of the researched households were concentrated in urban areas, 26.1% were families led by women, 40.2% had children, 24.0% were senior citizens, and 60.2% of the heads of family were over the age of 40. In 2008-2009, there was an increase in the number of households led by women (30.5%) and by people over the age of 40 (64.1%). Simultaneously, there was an increase in the proportion of households with senior citizens (27.1%) and little change in those with children (40.7%) and located in urban areas (76.7%).
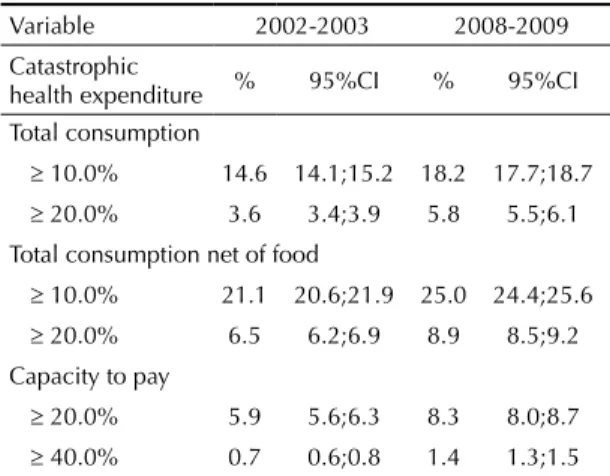
Regarding CHE, an increase between 2002-2003 and 2008-2009 was observed. The prevalence of CHE according to the different calculation methods varied from 0.7% to 21.1% in 2002-2003 and from 1.4% to 25.0% in 2008-2009. The smallest prevalence was observed in relation to the capacity to pay, whereas the greatest was in relation to total expenditure net of food. When CHE was calculated in relation to total consump-tion, the increase was of 25.0% at the cutoff point of 10.0%, reaching up to 62.0% when the cutoff point was considered to be 20.0%. When CHE was calculated by subtracting food costs from total expenditure, the vari-ance was 18.5% and 37.0% at the cutoff points of 10.0% and 20.0%, respectively. Finally, when the capacity to pay was included in the calculation, the increase in the proportion of households that incurred CHE was equal to 42.0%, using a cutoff point of 20.0%, and it was 100% when the cutoff point was 40.0% (Table 1).
Table 1. Proportion of households that spent 10.0% and 20.0%
or more of their total consumption with catastrophic health expenditures and 40.0% or more in relation to their capacity to pay. Brazil, 2002-2003 and 2008-2009.
Variable 2002-2003 2008-2009 Catastrophic
health expenditure % 95%CI % 95%CI Total consumption
≥ 10.0% 14.6 14.1;15.2 18.2 17.7;18.7
≥ 20.0% 3.6 3.4;3.9 5.8 5.5;6.1 Total consumption net of food
≥ 10.0% 21.1 20.6;21.9 25.0 24.4;25.6
≥ 20.0% 6.5 6.2;6.9 8.9 8.5;9.2 Capacity to pay
≥ 20.0% 5.9 5.6;6.3 8.3 8.0;8.7
Inequality in health expenditure
Boing
A
C et al
according to socioeconomic index. Brazil, 2002-2003 and 2008-2009.
Variable 2002-2003
Catastrophic Health expenditure Q1
a Q2 Q3 Q4 Q5 pb
% 95%CI % 95%CI % 95%CI % 95%CI % 95%CI
Total consumption
≥ 10.0% 12.9 12.2;13.7 14.3 13.1;15.6 14.2 13.0;15.5 16.8 15.3;18.4 16.3 14.4;18.2 < 0.001
≥ 20.0% 4.0 3.6;4.5 3.9 3.2;4.6 3.7 3.0;4.4 3.1 2.5;3.8 2.6 2.0;3.3 0.141
Total consumption net of food
≥ 10.0% 20.9 20.0;21.8 20.8 19.4;22.2 21.1 19.6;22.6 22.3 20.5;24.0 20.9 18.8;22.9 0.42
≥ 20.0% 7.6 7.0;8.2 7.0 6.2;7.9 6.4 5.5;7.3 5.6 4.6;6.5 3.9 3.1;4.7 < 0.001
Capacity to pay
≥ 20.0% 7.2 6.6;6.8 6.5 5.6;7.3 5.7 4.8;6.6 4.7 3.8;5.5 3.4 2.6;4.1 < 0.001
≥ 40.0% 1.0 0.8;1.2 0.9 0.6;1.2 0.6 0.4;0.8 0.3 0.1;0.4 0.3 0.08;0.6 < 0.001
2008-2009
Total consumption
≥ 10.0% 18.4 17.5;19.4 18.3 17.2;19.3 18.3 17.2;19.4 18.4 17.2;19.7 17.7 16.4;19.0 0.122
≥ 20.0% 7.3 6.6;7.9 6.2 5.5;6.8 6.2 5.5;7.0 5.5 4.7;6.2 3.7 3.2;4.3 < 0.001
Total consumption net of food
≥ 10.0% 28.0 26.9;29.0 25.6 24.5;26.8 24.8 23.6;26.0 23.9 22.6;25.3 22.7 21.2;24.2 < 0.001
≥ 20.0% 12.0 11.2;12.8 9.8 9.0;10.5 9.3 8.5;10.1 7.9 7.0;8.7 5.5 4.7;6.2 < 0.001
Capacity to pay
≥ 20.0% 11.4 10.6;12.2 9.2 8.4;10.0 8.7 7.9;9.5 7.2 6.4;8.0 5.0 4.2;5.6 < 0.001
≥ 40.0% 2.6 2.2;2.9 1.6 1.3;1.9 1.4 1.0;1.7 0.9 0.6;1.2 0.5 0.3;0.7 < 0.001
637
Rev Saúde Pública 2014;48(4):632-641
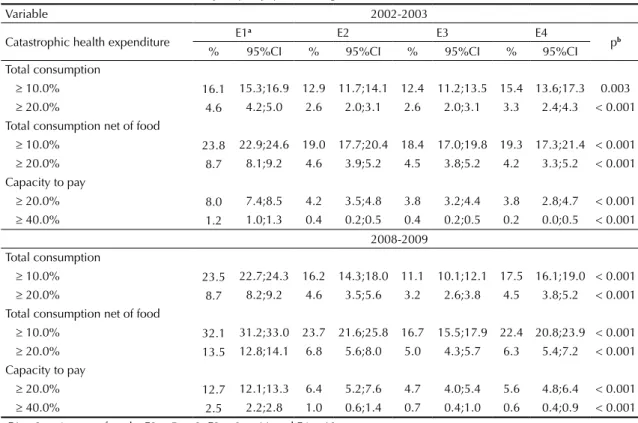
When analyzing CHE according to socioeconomic
conditions, it was veriied that the expenditure was
greater among the poorest, except at the cutoff point of 10.0% for the two outcomes in which it was used and among those with less schooling except at the cutoff point of 10.0% for the year of 2002-2003 (Tables 2 and 3).
Analysis of the DEI clearly indicated a socioeconomic gradient, varying from lesser prevalence in the most-favored quintile (Q5) to greater prevalence in the poorest (Q1) (Table 2). In addition, the positive varia-tion in outcomes between the investigated biennia was greater in the poorest strata of society.
A similar phenomenon was observed when schooling was used as a socioeconomic factor. Approximately one in three households in which the head of family had up to four years of education incurred CHE in 2008-2009, when the cutoff point was 10.0% in the calculation where the denominator was the total expenditure net of food. That amount was 35.0% greater than that observed in the previous biennium for the same socioeconomic
group and 43.0% greater than that identiied for the same
period among those with higher schooling (Table 3).
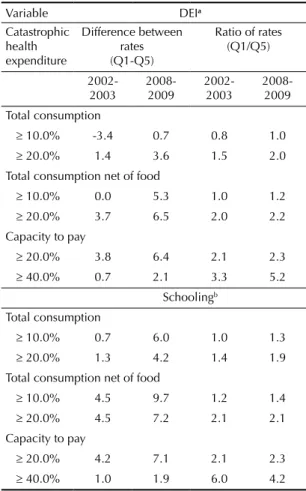
Table 4 presents the absolute and relative difference among the extreme groups of academic backgrounds and DEI in 2002-2003 and 2008-2009. In 2008-2009,
the prevalence of CHE, considering the capacity to pay,
was ive times greater in the irst quintile of the DEI
and four times greater in the group with lesser educa-tion, in comparison with the richer and more educated strata, respectively. On the other hand, when the cutoff point was of 20.0%, for the outcome that incorpo-rated the total consumption net of food expenditure in the denominator, the differences reached 118.0% and 114.0% in 2002-2003 and 2008-2009, respectively. The worst condition was always for the families with the least favorable socioeconomic situation.
This was also veriied in the concentration curves of the
different outcomes (Figure). In every case, the distribu-tion curve for 2008-2009 presented greater departure from the line of perfect equality. The greatest index of concentration was recorded in 2008-2009 when analyzing the DEI and CHE in relation to the capacity to
pay ≥ 40.0% (Figure A). On the other hand, the smaller concentration was identiied when the CHE in relation to total consumption ≥ 20.0% as an outcome (Figure C).
DISCUSSION
The current study revealed an increase in the prevalence of CHE of Brazilian families between 2002-2003 and 2008-2009. In addition, an expressive and increasing
Table 3. Proportion of households with catastrophic health expenditures of 10.0% and 20.0% or more of total health consumption
and 40.0% or more in relation to their capacity to pay, according to academic level. Brazil, 2002-2003 and 2008-2009.
Variable 2002-2003
Catastrophic health expenditure E1
a E2 E3 E4
pb
% 95%CI % 95%CI % 95%CI % 95%CI Total consumption
≥ 10.0% 16.1 15.3;16.9 12.9 11.7;14.1 12.4 11.2;13.5 15.4 13.6;17.3 0.003
≥ 20.0% 4.6 4.2;5.0 2.6 2.0;3.1 2.6 2.0;3.1 3.3 2.4;4.3 < 0.001 Total consumption net of food
≥ 10.0% 23.8 22.9;24.6 19.0 17.7;20.4 18.4 17.0;19.8 19.3 17.3;21.4 < 0.001
≥ 20.0% 8.7 8.1;9.2 4.6 3.9;5.2 4.5 3.8;5.2 4.2 3.3;5.2 < 0.001 Capacity to pay
≥ 20.0% 8.0 7.4;8.5 4.2 3.5;4.8 3.8 3.2;4.4 3.8 2.8;4.7 < 0.001
≥ 40.0% 1.2 1.0;1.3 0.4 0.2;0.5 0.4 0.2;0.5 0.2 0.0;0.5 < 0.001 2008-2009
Total consumption
≥ 10.0% 23.5 22.7;24.3 16.2 14.3;18.0 11.1 10.1;12.1 17.5 16.1;19.0 < 0.001
≥ 20.0% 8.7 8.2;9.2 4.6 3.5;5.6 3.2 2.6;3.8 4.5 3.8;5.2 < 0.001 Total consumption net of food
≥ 10.0% 32.1 31.2;33.0 23.7 21.6;25.8 16.7 15.5;17.9 22.4 20.8;23.9 < 0.001
≥ 20.0% 13.5 12.8;14.1 6.8 5.6;8.0 5.0 4.3;5.7 6.3 5.4;7.2 < 0.001 Capacity to pay
≥ 20.0% 12.7 12.1;13.3 6.4 5.2;7.6 4.7 4.0;5.4 5.6 4.8;6.4 < 0.001
≥ 40.0% 2.5 2.2;2.8 1.0 0.6;1.4 0.7 0.4;1.0 0.6 0.4;0.9 < 0.001
socioeconomic inequality was identiied in this preva -lence, which was higher among the poorer households, which were led by less educated individuals. The preva-lence of CHE found in the current study was similar to
those veriied in the country by Barros et al,1 Diniz et al,b and Knaul et al10 and differed from studies by Xu et al21 and Bos & Waters.6 The differences occurred, mainly, due to the use of different databases for esti-mating national expenditure. Xu et al,21 who reported a CHE of 10.3%, employed the Research about Living Standards, which was conducted in 1996-1997 and
included 4,800 households, without national representa-tion. On the other hand, Bos & Waters6 used data from the PNAD without considering non-monetary expen-diture and reported the prevalence of CHE between
3.7% and 20.0%, depending on the deinition and cutoff
point of the outcome. The POF, besides considering non-monetary expenses, employs a level of detail in capturing expenses and incomes which is unparalleled in any other national research; therefore, it is the most indicated base for studies on expenditure and incomes of Brazilian families.d,e
IC 2002-2003 = 1.17 IC 2008-2009 = 1.24 (A) Expenditure in relation to the
capacity to pay ≥ 40.0 %
IC 2002-2003 = 1.07 IC 2008-2009 = 1.12 (B) Expenditure in relation to total consumption
net of food ≥ 20.0%
IC 2002-2003 = 1.01 IC 2008-2009 = 1.09 (C) Expenditure in relation to total consumption
≥ 20.0% and education
IC 2002-2003 = 1.21 IC 2008-2009 = 1.17
IC 2002-2003 = 1.13 IC 2008-2009 = 1.18 (E) Expenditure in relation to total consumption
net of food ≥ 20,0%
IC 2002-2003 = 1.10 IC 2008-2009 = 1.16 (F) Expenditure in relation to total
consumption ≥ 20,0%
Linha de igualdade perfeita 2002-2003 2008-2009
(D) Expenditure in relation to payment capacity ≥ 40.0%
IC: concentration index
639
Rev Saúde Pública 2014;48(4):632-641
As expected, the different forms of measuring CHE had a direct impact on the estimated outcomes. Diniz et alb also reported an expressive variation in the prevalence of catastrophic expenditure depending on the formula or cutoff point used. The smallest estimates of CHE were observed logically when the cutoff points were the greatest. Besides, the formulas which used total health expenditure in the numerator and payment capacity in the denominator were those which presented the greatest percentage of CHE. Each calculation method expresses different methods of observing the phenom-enon, and there is no consensus over which is the most adequate or which estimates the outcome with greater
precision. Meanwhile, the clarity in deining the concept
is fundamental as well as the calculation method and data collection instrument to allow the use of this
measure by monitoring studies of health expenditure, subsidizing, and evaluating public policies.
In the period under analysis, the average monthly expenditure in health increased by approximately 5.0% in the country, with medication and health plans as the main items, corresponding to 76.0% of private health expenditure in 2008-2009.9 In addition, both presented an increase in Brazilian family expenditure between the analyzed biennia (9.0% in case of medication and 25.0% for health plans)9 and were composed of items that substantially compromise their income.5,16
Regarding medication, the difference may be explained by the aging of the population, the increase of the
prev-alence of chronic diseases, dificulties in accessing products in the scope of a Brazilian Uniied Health
System (SUS) and by the increase in their use due to the incorporation of new therapeutic products. The anal-ysis conducted with data from the 2008 PNAD
veri-ied that only 45.3% of the SUS users, who received
prescription medicine in the system, obtained all their medication free of charge. Among those who did not receive them via the UHS, 78.1% had to acquire them from the private sector.4
The Popular Pharmacy Program (PPP) was created in 2004f with the aim of broadening the population’s access to basic and essential medication, thereby reducing the impact of these items on the family budget. This program was structured in partnership with states
and municipalities and in 2006 was ampliied by means
of agreements with private establishments.
Although the program’s target audience is the part of
the population using the private sector and has inan
-cial dificulty in acquiring medication, it became an
option both for the users of the private network as well as for the users of the public network who do not obtain their medication free of charge.14 In a few states and regions of the country, approximately 70.0% of people assisting in the PPP belonged to the population of the public health network, which should have obtained their medication free of charge at the health unit where they were assisted.14
As such, bearing in mind the aim of mitigating private expenditure on medication, this policy may be directing users from the public sector toward the private sector, with a potential impact on the prevalence of CHE. Therefore, there is a need for additional studies to
eval-uate such a possibility. Anyhow, the inancing capacity
of the public sector must be improved, resources must
be used eficiently, and an adequate system of the supply
of consumables must be structured.23
Table 4. Measures of inequality in catastrophic health
expenditure, according to education and socioeconomic index. Brazil, 2002-2003 and 2008-2009.
Variable DEIa
Catastrophic health expenditure
Difference between rates (Q1-Q5)
Ratio of rates (Q1/Q5)
2002-2003 2008-2009 2002-2003 2008-2009 Total consumption
≥ 10.0% -3.4 0.7 0.8 1.0
≥ 20.0% 1.4 3.6 1.5 2.0 Total consumption net of food
≥ 10.0% 0.0 5.3 1.0 1.2
≥ 20.0% 3.7 6.5 2.0 2.2 Capacity to pay
≥ 20.0% 3.8 6.4 2.1 2.3
≥ 40.0% 0.7 2.1 3.3 5.2 Schoolingb
Total consumption
≥ 10.0% 0.7 6.0 1.0 1.3
≥ 20.0% 1.3 4.2 1.4 1.9 Total consumption net of food
≥ 10.0% 4.5 9.7 1.2 1.4
≥ 20.0% 4.5 7.2 2.1 2.1 Capacity to pay
≥ 20.0% 4.2 7.1 2.1 2.3
≥ 40.0% 1.0 1.9 6.0 4.2
a Domestic economic index (DEI) in quintiles, in which
Q1 corresponds to the poorest and Q5 to the richest. The comparisons were conducted from Q5 in relation to Q1.
b E1 = 0 to 4 years of schooling; E2 = 5 to 8; E3 = 9 to 11
and E4 = 12 or more. The comparisons were conducted from E5 in relation to E1.
Regarding health plans, between 2000 and 2012, there was a substantial increase in the covered population, varying from 18.1% to 25.1%.g In Brazil, the private market for health plans has been set up as a parallel system that competes with the SUS, when in fact is should simply be complementary to the SUS.
Although the monthly fee for these plans is an expense that is part of the household budget, the system of co-payment is ever more common in Brazil and, in some cases, may lead to costs that are greater than people’s capacity to pay. A study conducted with data from the POF 2002-2003 indicated that the coverage
per health plan was not suficient to safeguard fami
-lies against CHE.1
Finally, we can observe a growing prevalence of chronic diseases and the incorporation of new ther-apeutic technologies of elevated cost. Diseases that demand long-treatment times and resources of high technological density have become predominant, thus decisively compromising family budgets. Although the SUS contemplates universal and integral treatment, it
is notorious that Brazil possesses a subinancing of the
public health sector when compared with other coun-tries,23 thus compromising the public system’s capacity to comply with quality and its principles. Consequently, a part of the population returns to the private health care sector in search of answers to their needs, increasing private expenditure, which proportionally in relation to their income may penalize the poorest. While France invested 11.9% of its GDP in 2009 on health, the United Kingdom used 9.8%, New Zealand 10.0%, and Canada 11.4%, Brazil only invested 8.8%,23 where less than half of this amount was derived from the public sector. In Brazil, the proportion of public expenditure in relation to the total health expenditure (public plus private) was
only 43.6%, whereas in Canada this igure was 70.6%,
in France it was 77.9%, in New Zealand it was 83.0%, and in the United Kingdom it was 84.1%.23
According to a study by Xu et al, 22 the incidence of inan -cial catastrophe is inversely proportional to countries’
inancing of their health systems, with a greater public inancing an important measure in combating CHE. Besides the increase in CHE, we identiied inequality in
its distribution. Although the richest quintile spends about 10 times more on health than the poorest,9 the prevalence
of CHE was superior among the poorest quintiles. This result is in accordance with the literature, as observed in China,11 Argentina,21 Mexico,21 and Burkina Faso.17 The CHE was inversely proportional to the socioeconomic level of those countries, with an increase in expenditure among the richest, whereas the economic cost supported by that group is proportionally smaller.11 Among the poorest, the need for use and consumption of health goods and services associated with an inadequate health system for their needs, leads to greater costs, and they are forced to access private services.
This perspective of high private expenditure has a great impact on the general population, leading to many not using the health services even when necessary and even to cut back on important expenses for their subsis-tence to maintain access to the service and to adhere to treatments.18,a
One of the limitations of the current study is the restric-tive recording period of the collection of health expen-ditures. When only considering the last 30 days in the case of medication and 90 days for other health expen-diture and the observed annual value, one can underes-timate or overesunderes-timate expenditure esunderes-timates. Further, expenditure and income were self-referred, and reported
values may have not been the real igures.
Besides the relevance of the SUS as a social policy in Brazil and the improvement of its management and the
quality of its services since 1988, it is still insuficient
to protect families from CHE. To reverse the regres-sive structure of health expenditure of families with the worst socioeconomic conditions, one must guarantee access to health goods and services, especially medica-tion, which represents a large proportion of the expen-diture of these groups,b by means of inancing and efi -cient management of pharmaceutical services. The SUS user within this system should be guaranteed access to professionals, technologies, and necessary supplies for the promotion and recovery of their health as well as disease prevention. All actions promoting greater access and guaranteeing the integrity and capacity for resolution within the SUS have a strong potential of minimizing CHE because they limit the need for people to resort to the private sector. Access to the SUS has been communicated as a protection factor against catastrophic expenditure, whereas this is not directly observed in relation to health plans.1,6
g Agência Nacional de Saúde. FOCO: Saúde Suplementar. Brasília (DF); 2012 [cited 2013 Jan 15]. Available from: http://www.ans.gov.br/
641
Rev Saúde Pública 2014;48(4):632-641
1. Barros AJ, Bastos JL, Dâmaso AH. Catastrophic spending on health care in Brazil: private health insurance does not seem to be the solution.
Cad Saude Publica. 2011;27Suppl 2:254-62. DOI:10.1590/S0102-311X2011001400012 2. Barros AJ, Bertoldi AD. Out-of-pocket health
expenditure in a population covered by the Family Health Program in Brazil. Int J Epidemiol.
2008;37(4):758-65. DOI:10.1093/ije/dyn063 3. Barros AJD, Victora CG. Indicador econômico
para o Brasil baseado no censo demográfico de 2000. Rev Saude Publica. 2005;39(4):523-9. DOI:10.1590/S0034-89102005000400002 4. Boing AC, Bertoldi AD, Boing AF, Bastos JL, Peres
KG. Acesso a medicamentos no setor público: análise de usuários do Sistema Único de Saúde no Brasil. Cad Saude Publica. 2013;29(4):691-701. DOI:10.1590/S0102-311X2013000800007 5. Boing AC, Bertoldi AD, Peres KG. Desigualdades
socioeconômicas nos gastos e comprometimento da renda com medicamentos no Sul do Brasil.
Rev Saude Publica. 2011;45(5):897-905. DOI:10.1590/S0034-89102011005000054 6. Bos AM, Waters HR. The impact of the public health
system and private insurance on catastrophic health expenditures. CEPAL Rev. 2008;95:125-39. 7. Bredenkamp C, Mendola M, Gragnolati M.
Catastrophic and impoverishing effects of health expenditure: new evidence from the Western Balkans. Health Policy Plan. 2011;26(4):349-56. DOI:10.1093/heapol/czq070
8. Couttolenc B, Dmytraczenko T. Brazil’s primary care strategy. Universal Health Coverage Studies Series (UNICO) vol. 2. Washington (DC): World Bank; 2013. 9. Garcia LP, Sant’ana AC, Magalhães LCG,
Aurea AP. Gastos com saúde das famílias brasileiras residentes em regiões metropolitanas: composição e evolução no período 1995-2009.
Cienc Saude Coletiva. 2013;18(1):115-28. DOI:10.1590/S1413-81232013000100013 10. Knaul FM, Wong R, Arreola-Ornelas H, Méndez O,
Network on Health Financing and Social Protection in Latin America and the Caribbean (LANET). Household catastrophic health expenditures: a comparative analysis of twelve Latin American and Caribbean Countries. Salud Publica Mex. 2011;53Suppl 2:85-95. DOI:10.1590/S0036-36342011000800005
11. Li Y, Wu Q, Xu L, Legge D, Hao Y, Gao L, et al. Factors affecting catastrophic health expenditure and impoverishment from medical expenses in China: policy implications of universal health insurance.
Bull World Health Organ. 2012;90(9):664-71. DOI:10.2471/BLT.12.102178
REFERENCES
12. Mataria A, Raad F, Abu-Zaineh M, Donaldson C. Catastrophic healthcare payments and impoverishment in the occupied Palestinian territory. Appl
Health Econ Health Policy. 2010;8(6):393-405. DOI:10.2165/11318200-000000000-00000 13. O’Donnell O, van Doorslaer E, Wagstaff A, Lindelow
M. Analyzing health equity using household survey data: a guide to techniques and their implementation. Washington (DC): World Bank; 2008.
14. Santos-Pinto CB, Costa NR, Osorio-de-Castro CGS. Quem acessa o Programa Farmácia Popular do Brasil? Aspectos do fornecimento público de medicamentos.
Cienc Saude Coletiva. 2011;16(6):2963-73. DOI:10.1590/S1413-81232011000600034 15. Schneider MC, Castillo-Salgado C, Bacallao J,
Loyola E, Mujica OJ, Vidaurre M, et al. Métodos de mensuração das desigualdades em saúde.
Rev Panan Salud Publica. 2002;12(6):1-17. DOI:10.1590/S1020-49892002001200006
16. Silveira FG, Osório RG, Piola SF. Os gastos das famílias com saúde. Cienc Saude Coletiva. 2002;7(4):719-31. DOI:10.1590/S1413-81232002000400009
17. Su TT, Kouyaté B, Flessa S. Catastrophic household expenditure for health care in a low income society: a study from Nouna district, Burkina Faso. Bull World Health
Organ. 2006;84(1):21-7. DOI:10.2471/BLT.05.023739
18. Van Doorslaer E, O’Donnell O, Rannan-Eliya RP, Somanathan A, Adhikari SR, Garg CC, et al. Effect of payments for health care on poverty estimates in 11 countries in Asia: an analysis of household survey data. Lancet. 2006;368(9544):1357-64. DOI:10.1016/S0140-6736(06)69560-3 19. Wagstaff A, Van Doorslaer E. Catastrophe and
impoverishment in paying for health care: with applications to Vietnam 1993-1998. Health Econ.
2003;12(11):921-34. DOI:10.1002/hec.776
20. Wagstaff A, Bilger M, Sajaia Z, Lokshin M. Health equity and financial protection. Washington (DC): World Bank; 2011.
21. Xu K, Evans DB, Kawabata K, Zeramdini R, Klavus J, Murray CJL. Household catastrophic health expenditure: a multicountry
analysis. Lancet. 2003;362(9378):111-7. DOI:10.1016/S0140-6736(03)13861-5 22. Xu K, Evans DB, Carrin G, Aguilar-Rivera AM,
Musgrove P, Evans T. Protecting households from catastrophic health spending. Health Aff (Millwood).
2007;26(4):972-83. DOI:10.1377/hlthaff.26.4.972
23. World Health Organization. WHO Global Health Expenditure Atlas. Geneva; 2012.
Article based on doctorate thesis by Boing AC, entitled: “Desigualdade socioeconômica nos gastos catastróficos em saúde no Brasil: análise da Pesquisa de Orçamentos Familiares 2002-3 e 2008-9”, presented to the Programa de Pós-Graduação em Saúde Coletiva of the Universidade Federal de Santa Catarina, in 2013.