*Correspondence: O. Flórez-Acosta. Departamento de Farmacia, Facultad de Química Farmacéutica-UdeA. Clle 67 N°53-108, B2-127, Medellín, Colombia. E-mail: [email protected]
A
rti
Pharmaceutical Sciences vol. 46, n. 4, out./dez., 2010
Categorization of the main descriptors of different ampicillin
crystal habits
Oscar Flórez-Acosta
1,*, Gloria Tobón-Zapata
1, Jaime Valencia-Velasquez
21Department of Pharmacy, Faculty of Pharmaceutical Chemistry, University of Antioquia, 2Department of Electric
Engineering, Faculty of Engineering, University of Antioquia
With the purpose of enabling the analysis by digital methods of particles of multisource pharmaceutical raw materials, this study analyzed different crystal habits of ampicillin particles, by grouping the external shapes obtained from 3 different solvents (acetonitrile, ethanol, and methanol), thereby reducing the number of descriptors necessary to adequately represent each shape. For this purpose, a selection of morphological descriptors was used including: circularity, roughness, roundness, compactness, aspect ratio, effective diameter, solidity, convexity, fractal dimension, and 10 Complex Fourier descriptors. These measures cover highly diverse morphological properties and deine the crystal habit of a particle. Principal Component Analysis (PCA) and the Cluster Analysis (CA) were the grouping techniques used, which demonstrated the possibility of using between 2 and 4 descriptors instead of the 18 proposed initially.
Uniterms: Multisource solids. Morphological descriptors. Fourier descriptors. Crystal habits. Multivariate analysis.
Com o objetivo de possibilitar a análise, por meio de métodos digitais, de partículas de matérias-primas farmacêuticas de múltiplas fontes, analisaram-se diferentes cristais de partículas de ampicilina através do agrupamento de formas externas obtidas de três diferentes solventes (acetonitrila, etanol e metanol), reduzindo, desse modo, o número de descritores necessários para representar adequadamente cada forma. Com esse propósito, utilizou-se seleção de descritores morfológicos, incluindo: circularidade, aspereza, arredondamento, compactação, relação de aspecto, diâmetro efetivo, solidez, convectividade, dimensão fractal e 10 descritores complexos de Fourier. Essas medidas cobrem diversas propriedades morfológicas e deinem a cristalinidade de uma partícula. As análises do componente principal (PCA) e por grupamento (CA) foram as técnicas de agrupamento utilizadas, que demonstraram a possibilidade de utilizar entre 2 e 4 descritores ao invés dos 18, inicialmente propostos.
Unitermos: Sólidos de múltiplas fontes. Descritores morfológicos. Descritores Fourier. Cristal. Análise multivariada
INTRODUCTION
Ampicillin is one of the most widely used anti-infective agents in the world. This antibiotic, and other multisource active pharmaceutical ingredients (API), are marketed by different companies and have reported variations in bioavailability. However, controversy exists in studies over the best absorption between anhydrous or trihydrate species, 2 reported structural forms of
ampi-cillin. Although these authors state that the formulation plays an important role, it is likely that the size and shape of the particles is a factor that should be taken into account (Cabana, Willhitc, Bierwagen, 1969; Hill et al., 1975; Ali, Farouk, 1981).
ses (Haleblian, 1975).
The aim of this study was to further the decision on an adequate strategy to simplify the routine measurement of the solid raw material crystalline habits derived from di-fferent manufacturers, given that the morphology of these particles can be described using different techniques and approaches, and there is no clear consensus on which are the most appropriate. In this case, different crystal habits of ampicillin were used as a model.
Patience and James used an algorithm that allows, by means of digital analysis, controlling and monitoring of the crystallization process in real time, using a micrometer to measure the size and aspect ratio and a boxed area to provide a description of particle shape (Patience, Rawlin-gs, 2001). However, the overriding consensus holds that the morphology of a particle cannot be characterized using only one descriptor, especially with APIs whose origin is not known or that have been exposed to comminution, sin-ce it is nesin-cessary to deine at least the geometrical shape, surface roughness, and angularity. Hence, simultaneous use of several of these descriptors becomes inevitable (Barret, 1980; Podczeck, Newton, 1995).
The interpretation of the morphological measure-ments of the particles through digital analysis remains complicated, hence this study’s use of classic morpholo-gicaldescriptors that highlight the characteristics of the edges of the igure, for ease of measurement and inter-pretation, and the use of descriptors based on mathematic methods that integrally deine the particles.
The classic measurement methods used were: the circularity shape factor, which combines the roughness and symmetry of the contours; roundness, that measures the difference between the particle surface and a circular surface, with a maximum Feret diameter, and compares the angularity and texture; the curvature of the particles was also measured through compactness; the aspect ratio, represents the irregularity of the particle, since it relates the length and width; the effective diameter, with which the particle is approximated to a sphere averaged by the maximum and minimum diameter; solidity, describes the convexity of the polygon that defines the contour; and convexity, that compares the perimeter of the curvatures regarding the polygon, as an angularity measure.
Also, mathematic descriptors were calculated as the fractal dimension and Fourier transform complex. Both methods may be used to perform a structural measurement of the particle igure (Ehrlich, Weimberg, 1970).
The Fractal Dimension is more a solidness and texture measurement than a shape measurement. In this
through the length of the “box”, i.e. the measurement of the perimeter of the contour. This process is repeated for boxes from 2 to 64 pixels wide, then the size log is plotted against the box amount log, and the slope is considered as the measurement for the fractal dimension (Biswas et al., 1998).
For the measurement of Fourier transform, the me-thod used was Fourier complex descriptors, where each of these can explain different parameters of the shape (Clark, 1981).
Finally, to carry out categorization of the classic and mathematic shape descriptors, 2 multivariate analysis techniques were used: Principal Components Analysis (PCA), used to reduce the number of correlated variables between them, simplifying or classifying complex data, such as the case of the different ampicillin solids obtained, retaining the highest possible amount of variation of each data series; and the results were reinforced by a hierarchic Cluster Analysis (CA), which enables the pooling of diffe-rent sets of observations based on the similarities among them (Maciejewski, Roberts, 2001; Berthiaux et al., 2006; Kaufman, Rousseeuw, 1990). These techniques enabled reorganization of all the descriptors used, and enables the subsequent use of a subset of them (Pons, 2002).
MATERIALS AND METHODS
Ampicillin as a raw material was kindly donated by a pharmaceutical industry and used in the form received. Analysis showed water content of 12-15%, which indi-cated occurrence of trihydrate ampicillin (USP31, 2007). Subsequently, the solid was dissolved in solvent to boiling point, immediately iltrated, and the hot supersaturated solution allowed to reach room temperature, then cooled (10-15 °C) until the formation of crystals. Acetonitrile (ACN), ethanol (EtOH), and methanol (MetOH) solvents (all solvents were JT Baker®, reactive grade) were chosen because they produced different crystalline shapes.
From the crystals obtained, 9 representative recrys-tallized ampicillin microphotographs were selected: 3 in acetonitrile, 3 in ethanol, and 3 in methanol. The images were binary converted for the analysis, as shown in Fi-gure 1 (Mateu, Lorenzo, 2002). The measurements and the digital processing were done with Matlab 7® (THE
MATHWORKS INC. Massachusetts, 2004), ImageJ 1.41 (Rasband, 2009), and Lispix 137P (Bright, 2008) programs.
factor (Circul): 4ΠA/P2; Roundness (Round): 4A/Π(large
axis)2; Compactness (Comp): (4A/Π)1/2/large axis; Aspect
ratio (AR): large axis/Minor axis; Effective Diameter (Eff_ Diam): 2(A/Π)1/2; Solidity (Solidity): A/Convex A;
Con-vexity (ConCon-vexity): Pc/P; with A= area in squared pixels, P = perimeter, measured as the length of the external edge of the particle, Pc = convex perimeter. Fractal Dimension (Dfractal):DF= log(Nε/logε); where N, is the number of
boxes and ε is the scale. The slope of the regression line was the fractal dimension (D).
As Fourier Complex descriptors (see equation 1), the irst 10 coeficients were calculated (DFC0, DFC1, DFC2, DFC3, DFC4, DFC5, DFC6, DFC7, DFC8, and DFC9). The method uses all the points that make up the completely full particle (Raadnui, 2005; Bowman, Keni-chi, Drummond, 1997).
(Eq. 1)
Eq. 1: Where x and y are the coordinates that describe each of the pixels of the particle; N, is the total number
of coeficients; M, is the total number of pixels used in the particle description; m, is the number of each of the points; a, b, are the coeficients of each factor; i, marks an imaginary number.
The PCA and CA multivariate analyses were con-ducted with the Statgraphics Centurion XV program for Windows (Statistical Graphics Co., Rockville, MD, USA. 2007).
RESULTS AND DISCUSSION
The PCA data depicted in Table II and the scree plot in Figure 2 were obtained based on the measurement of the descriptors of the 9 particles, with linear combination of the 18 descriptors which combined gave the total varia-bility of the data. It was found that taking 2, 3, or 4 com-ponents yielded eigenvalues greater than 1 and cumulated variability percentages greater than 75%.
Figure 3 evidences low weight in the matrix compo-nent correlation. Therefore, an evaluation of the correla-tion among all the pairs of variables through the Pearson Moment Product test was performed, and statistical sig-niicance with 95% conidence was found.
FIGURE 1 - Microphotographs taken with 10x objective, converted to binary format for measurement. Letters correspond to the
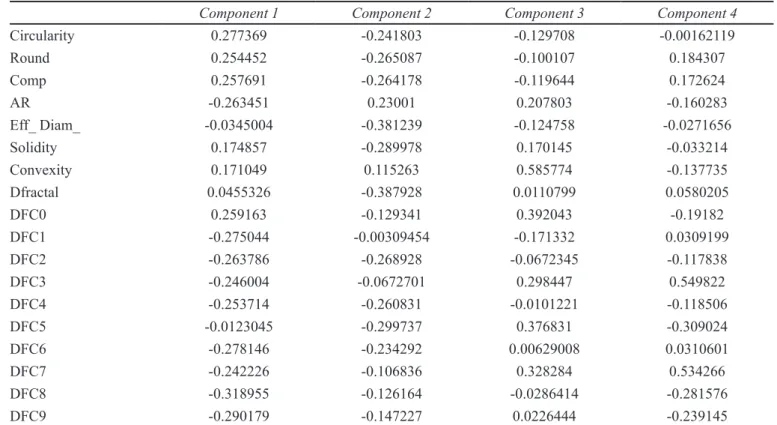
According to the PCA data in Table III and bi-plot of Figure 3, the irst component directly correlated with circularity, roundness, compactness, solidity, convexity, fractal dimension, and DFC5, DFC6, and DFC7, and has an inverse correlation with the other descriptors; the second component presents a direct correlation with the aspect ratio and convexity; the third component corre-lated with the aspect ratio, solidity, convexity, Dfractal, DFC1, DFC3, DFC6, and DFC7, the effective diameter and DFC0, DFC3, DFC5, DFC6, and DFC7; the fourth component, correlated with the roundness, compactness, Dfractal, DFC1, DFC3, DFC6, and DFC7. Effective dia-meter and DFC2 have no positive correlation with any of the 4 selected components.
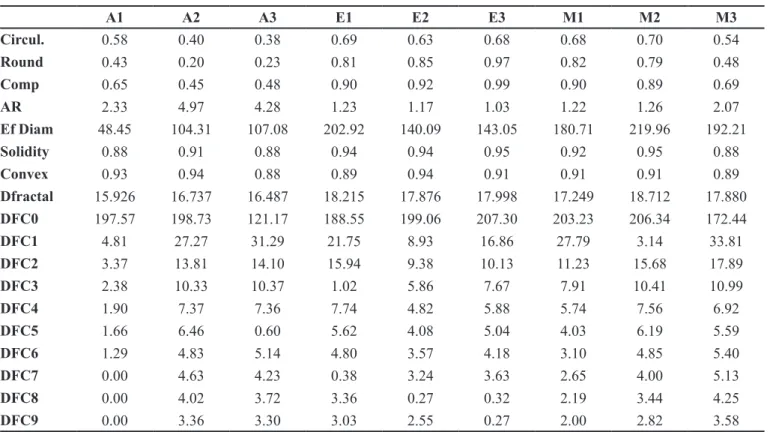
A1 A2 A3 E1 E2 E3 M1 M2 M3
Circul. 0.58 0.40 0.38 0.69 0.63 0.68 0.68 0.70 0.54
Round 0.43 0.20 0.23 0.81 0.85 0.97 0.82 0.79 0.48
Comp 0.65 0.45 0.48 0.90 0.92 0.99 0.90 0.89 0.69
AR 2.33 4.97 4.28 1.23 1.17 1.03 1.22 1.26 2.07
Ef Diam 48.45 104.31 107.08 202.92 140.09 143.05 180.71 219.96 192.21
Solidity 0.88 0.91 0.88 0.94 0.94 0.95 0.92 0.95 0.88
Convex 0.93 0.94 0.88 0.89 0.94 0.91 0.91 0.91 0.89
Dfractal 15.926 16.737 16.487 18.215 17.876 17.998 17.249 18.712 17.880
DFC0 197.57 198.73 121.17 188.55 199.06 207.30 203.23 206.34 172.44
DFC1 4.81 27.27 31.29 21.75 8.93 16.86 27.79 3.14 33.81
DFC2 3.37 13.81 14.10 15.94 9.38 10.13 11.23 15.68 17.89
DFC3 2.38 10.33 10.37 1.02 5.86 7.67 7.91 10.41 10.99
DFC4 1.90 7.37 7.36 7.74 4.82 5.88 5.74 7.56 6.92
DFC5 1.66 6.46 0.60 5.62 4.08 5.04 4.03 6.19 5.59
DFC6 1.29 4.83 5.14 4.80 3.57 4.18 3.10 4.85 5.40
DFC7 0.00 4.63 4.23 0.38 3.24 3.63 2.65 4.00 5.13
DFC8 0.00 4.02 3.72 3.36 0.27 0.32 2.19 3.44 4.25
DFC9 0.00 3.36 3.30 3.03 2.55 0.27 2.00 2.82 3.58
TABLE II - Eigenvalues and cumulated percentage for the 4
principal components
Component
Number Eigenvalue Percent ofVariance CumulativePercentage
1 7.47742 41.541 41.541
2 6.22821 34.601 76.142
3 1.81638 10.091 86.233
4 1.00281 5.571 91.805
FIGURE 2 - Eigenvalues obtained from the 18 total components.
The red line indicates the 4 principal components. The 4 components may be deined according to the information that they represent: the irst can be taken as compacting, density, or homogeneity, given their topo-logical intuitive notion; the second component, could be considered the stretching or elongation factor; the third, is present in particles that do not have “entries” or “bays” and therefore represents smoothing of edges; the fourth, can be an indication of angularity.
TABLE III - Weight of individual descriptors for the 4 principal components
Component 1 Component 2 Component 3 Component 4
Circularity 0.277369 -0.241803 -0.129708 -0.00162119
Round 0.254452 -0.265087 -0.100107 0.184307
Comp 0.257691 -0.264178 -0.119644 0.172624
AR -0.263451 0.23001 0.207803 -0.160283
Eff_ Diam_ -0.0345004 -0.381239 -0.124758 -0.0271656
Solidity 0.174857 -0.289978 0.170145 -0.033214
Convexity 0.171049 0.115263 0.585774 -0.137735
Dfractal 0.0455326 -0.387928 0.0110799 0.0580205
DFC0 0.259163 -0.129341 0.392043 -0.19182
DFC1 -0.275044 -0.00309454 -0.171332 0.0309199
DFC2 -0.263786 -0.268928 -0.0672345 -0.117838
DFC3 -0.246004 -0.0672701 0.298447 0.549822
DFC4 -0.253714 -0.260831 -0.0101221 -0.118506
DFC5 -0.0123045 -0.299737 0.376831 -0.309024
DFC6 -0.278146 -0.234292 0.00629008 0.0310601
DFC7 -0.242226 -0.106836 0.328284 0.534266
DFC8 -0.318955 -0.126164 -0.0286414 -0.281576
DFC9 -0.290179 -0.147227 0.0226444 -0.239145
(Ward method) was applied, evaluating the Euclidean dis-tance between the weight of the descriptors of the 4 main components chosen, and represented in the dendrogram of Figure 4. This formed the following groups: the irst comprising circularity, roundness, compactness, solidity, effective diameter, DFractal and DFC5; the second made up of AR, DFC1, DFC3 and DFC7; the third formed by convexity and DFC0; and the fourth by DFC2, DFC4, DFC6, DFC8, and DFC9.
The groups obtained in the PCA and CA revealed the following common descriptors: circularity, roundness,
FIGURE 3 - Shows the position of the 18 descriptors and 9
particles showing the relationships of descriptors among the 3 most important components.
FIGURE 4 - Dendrogram showing groupings of the variables on
the conglomerate analysis by the Ward Method, using squared Euclidean as metric distance.
compactness, solidity and Dfractal, for the irst group; AR, and DFC1 for the second group; convexity and DFC0, for the third; and only DFC6 for the fourth group.
besides the information obtained from the PCA, a faster approximation for morphological characterization is possi-ble using only 2 of these descriptors (but with greater loss of information), for example: DFC0 and DFC3, with com-plex Fourier descriptors; or compactness and convexity, if only classic shape descriptors are used (Almeida-Prieto, Blanco-Méndez, Otero-Espinar, 2007; Powers, 1953).
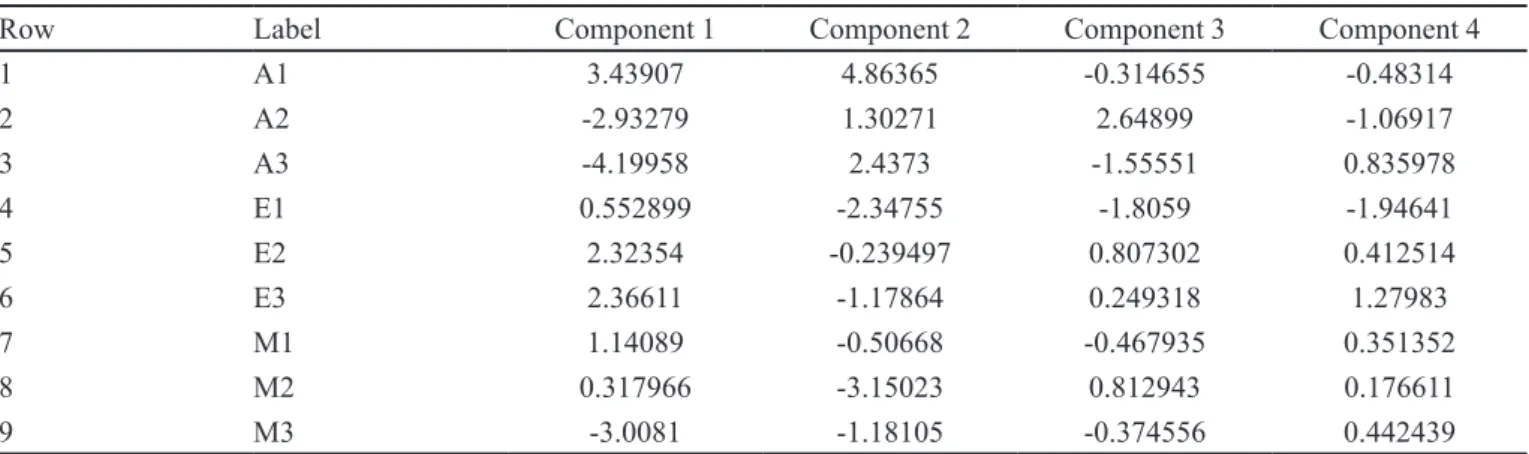
Table IV constitutes a base to classify the different types of re-crystallized ampicillin particles: compact shapes, A1, E1, E2, E3, M1, M2; elongated, A1, A2, A3; with smooth edges, A2, E2, E3, M2; and with angle shapes, A3, E2, E3, M1, M2, M3. It must be considered that the different descriptors are greater or least measure weighted in each of the components, for example: A1, is not smooth, and does not have angles; E2, is not elongated, but compact, smooth, and angular.
CONCLUSIONS
Other articles make reference to the use of at least 3 descriptors to deine the morphology of a bi-dimensionally observed particle. However, it may be inferred from the results obtained in ampicillin particles re-crystallized in different solvents, and through the use of multivariate te-chniques of PCA and CA, that this number can be reduced to a minimum of 2 descriptors. Nevertheless, to achieve a better approximation in the morphological deinition it is necessary to use 4 descriptors.
Finally, using this recrystallization technique, the analysis showed that the ampicillin habit in acetonitrile are mainly elongated, those recrystallized in ethanol were compact, smooth, and with angles, while particles recrys-tallized in methanol were very similar to those in ethanol, only rougher.
Row Label Component 1 Component 2 Component 3 Component 4
1 A1 3.43907 4.86365 -0.314655 -0.48314
2 A2 -2.93279 1.30271 2.64899 -1.06917
3 A3 -4.19958 2.4373 -1.55551 0.835978
4 E1 0.552899 -2.34755 -1.8059 -1.94641
5 E2 2.32354 -0.239497 0.807302 0.412514
6 E3 2.36611 -1.17864 0.249318 1.27983
7 M1 1.14089 -0.50668 -0.467935 0.351352
8 M2 0.317966 -3.15023 0.812943 0.176611
9 M3 -3.0081 -1.18105 -0.374556 0.442439
REFERENCES
ALI, A.; FAROUK, A. Comparative studies on the bioavailability of ampicillin anhydrate and trihydrate. Int. J. Pharm., v.9, n.3, p.239-243, 1981.
ALMEIDA-PRIETO, S.; BLANCO-MÉNDEZ, J.; OTERO-ESPINAR, F. Microscopic image analysis techniques for the morphological characterization of pharmaceutical particles: Inluence of the software, and the factor algorithms used in the shape factor estimation. Eur. J. Pharm. Biopharm., v.67, n.3, p.766-776, 2007.
BARRET, P. The shape of rock particles, a critical review.
Sedimentology, v.27, n.3, p.291-303, 1980.
BERTHIAUX, H.; MOSOROV, V.; TOMCZAK, L.; GATUMEL, C.; DEMEYRE, J.F. Principal component analysis for characterising homogeneity in powder mixing using image processing techniques. Chem. Eng. Pro., v.45, n.5, p.397-403, 2006.
BISWAS, M.K; GHOSE, T.; GUHA, S.; BISWAS, P. K. Fractal dimension estimation for texture images: A parallel approach. Patt. Recog. Lett., v.19, n.3-4, p.309-313, 1998.
BOWMAN, E.; SAGA, K.; DRUMMOND, T. Particle shape characterisation using Fourier analysis. Geotechnique
(CUED/D-Soil/TR315), v.51, n.6, p.545-554, 2001.
CLARK, M. W. Quantitative shape analysis: a review. Math. Geol., v.13, n.4, p.303-320, 1981.
EHRLICH, R.; WEINBERG, B. An exact method for characterization of grain shape. J. Sediment. Petrol., v.40, n.1, p.205-212, 1970.
HALEBLIAN, J. Characterization of habits and crystalline modiication of solids and their pharmaceutical applications.
J. Pharm. Sci.,v.64, n.8, p.1269-1288, 1975.
HILL, S.A.; JONES, K.H.; SEAGER, H.; TASKIS, C.B. Dissolution and bioavailability of anhydrate and trihydrate ampicillin. J. Pharm. Pharmacol., v.27, n.8, p.594-598, 1975.
KAUFMAN, L.; ROUSSEEUW, P.J. Finding groups in data: an introduction to cluster analysis. New York: Wiley & Sons, Inc., 1990. 368 p.
MACIEJEWSKI, A.A.; ROBERTS, R.G. An example of principal component analysis applied to correlated images. In: SOUTHEASTERN SYMPOSIUM ON SYSTEM THEORY, 33., Athens, 2001. Proceedings. Ohio:Colorado State University, Libraries, 2001. p.269-273.
MATEU, J.; LORENZO, G. Detección de rasgos en imágenes binarias mediante procesos puntuales Espaciales marcados. Qüestiió, v.26, n.1-2, p.61-85, 2002.
NOJAVAN, S.; GHASSEMPOUR, A.; BASHOUR, Y.; DARBANDI, M.; AHMADI, S. Determination of residual solvents and investigation of their effect on ampicillin trihydrate crystal structure. J. Pharm. Biomed. Anal.,v.36, n.5, p.983-988, 2005.
PATIENCE, D.B.; RAWLINGS, J.B. Particle-Shape Monitoring and Control in Crystallization Processes.AIChE Journal., v.47, n.9, p.2125-2130. 2001.
PODCZECK, F.; NEWTON, J.M. The evaluation of a three-dimensional shape factor for the quantitative assessment of the sphericity and surface roughness of pellets. Int. J. Pharm., v.124, n.2, p.253-259, 1995.
PONS, M.N.; VIVIER, H.; DELCOUR, V.; AUTHELIN, J. R.; PAILLÉRES-HUBERT, L. Morphological analysis of pharmaceutical powders. Powd. Tech., v.128, n.2-3, p.276-286, 2002.
POWERS, M. A new roundness scale for sedimentary particles.
J. Sediment. Petrol., v.23, n.2, p.117-119, 1953.
RAADNUI, S. Wear particle analysis. Utilization of quantitative computer image analysis: A review. Tribol. Int., v.38, n.10, p.871-878, 2005.
THE UNITED STATES PHARMACOPEIA. 31. The National Formulary 26. Monographs: Ampicillin, water, Method I <921>. ed. Rockville: United States Pharmacopeial Convention, 2007. 517 p.
ZHU, H..; YUEN, C.; GRANT, D. Inluence of water activity on the anhydrate and hydrate phases of ampicillin crystallized from methanol + water mixtures. Pharm. Res., v.12, n.9, p.S-196 PDD 7016, 1995.
ZHU, H.; GRANT, D. Inluence of water activity in organic solvent + water mixtures on the nature of the crystallizing drug phase: 2. Ampicillin. Int. J. Pharm., v.139, n.1-2, p.33-43, 1996.