José Gomes Bezerra FilhoI Lígia Regina Franco Sansigolo Kerr PontesI
Daniel de Lima MináI Maurício Lima BarretoII
I Departamento de Saúde Comunitária.
Universidade Federal do Ceará. Fortaleza, CE, Brasil
II Instituto de Saúde Coletiva. Universidade
Federal da Bahia. Salvador, BA, Brasil Correspondence:
José Gomes Bezerra Filho Faculdade de Medicina da UFC Departamento de Saúde Comunitária R. Prof. Costa Mendes 1608 5º Andar Bairro Rodolfo Teófi lo
60416-200 Fortaleza, CE, Brasil E-mail: [email protected] Received: 9/4/2006 Reviewed: 4/23/2007 Approved: 7/13/2007
Infant mortality and
sociodemographic conditions in
Ceará, Brazil, 1991 and 2000
ABSTRACT
OBJECTIVE: To assess ecological models to describe infant mortality rate in Ceara (Northeastern Brazil) in two different periods of time.
METHODS: This was a cross-sectional ecologic study of two years, 1991 and 2000, using non-matching information per municipalities. Estimates on the infant mortality rate of the Instituto de Pesquisas Econômicas Aplicadas (Institute of Applied Economic Research) have been used. For the remaining indicators different sources of the System of Health Information were used. The main risk factors were assessed using multiple linear regression.
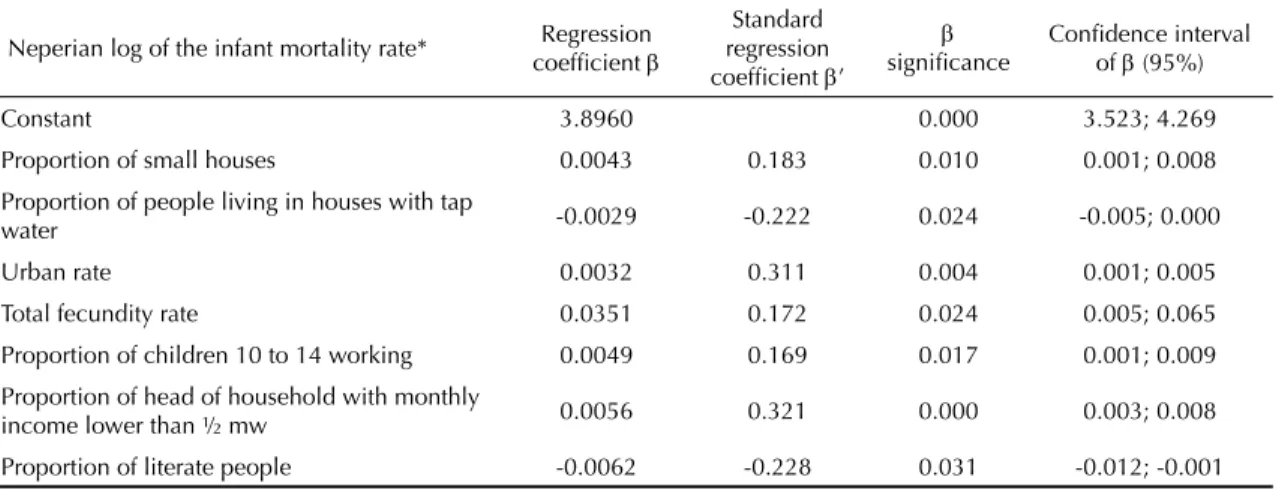
RESULTS: In 1991, the variables that predicted infant mortality rate (R2=0.3575) were: small houses (β=0.0043; ρ=0.010), proportion of inhabitants with tap water in the household (β=-0.0029; ρ=0.024), urbanization rate (β=0.0032; ρ=0.004), fecundity rate (β=0.0351; ρ=0.024), the proportion of children working at 10-14 years (β=0.0049; ρ=0.017), proportion of families with income < ½ minimum wage (β=0.0056; ρ=0.000), that can read and write (β=-0.0062; ρ=0.031). In the year 2000, the following possible determinants were identifi ed (R2=0.3236): the proportion of children <2 years of age with malnutrition (β=0.0064; ρ=0.024), proportion of households with adequate sanitation (β=-0.0024; ρ=0.010), proportion of women who could read and write (β=-0.0068; ρ=0.044), expenses on health human resources regarding total health expenses (β=-0.0024; ρ=0.027), proportion of the value of the vegetal production in relation to the total of the state (β=-0.1090; ρ=0.001), intensity of poverty (β=0.0065; ρ=0.002), and ageing index (β=-0.0100; ρ=0.006).
CONCLUSIONS: Although the variables have not been exactly the same for the evaluated period, determiners of infant mortality have been changing, except for indicators of education, income and sanitation. The overall decrease in fecundity led to a reduction in its discriminating power, and it was replaced by the ageing index. Another tendency observed was the replace of several demographic variables by health care indicators.
KEY WORDS: Infant mortality. Socioeconomic factors. Risk factors. Linear models.
INTRODUCTION
Infant Mortality Rate (IMR) refl ects, overall, the levels of health and socio-economic development of a certain area, and is considered one of the most important epidemiologic indicators internationally used.10
Europe has a rate of nine per 1000 live births. North America reaches the level of seven per 1000 live births. South America presents the mean value of 31 deaths per 1000 live births.17
In the year 2000, estimated IMR in Brazil was 28.3 per 1000 live births* however, an expressive inequal-ity was observed among the states. This has caught attention of several researchers and health institutes looking for determiners of these differences.6 Although
none of the Brazilian states have presented increase in infant mortality in the last ten years, eleven states are above the national average, among them, nine are in the Northeast region and two in the North.19
In Ceará, a tendency towards decrease in IMR was observed from 1991 to 2000, when it ranged from 66.8 to 39.8 per 1000 live births, representing a 40.4% de-crease.** However, in 2000, this rate was higher than that of Brazil (28.3 per 1000 live births) and of all the states in the other regions.∗∗ Although information on live births in the beginning of the 90’s is lacking, infant mortality according to neonatal components (younger than 28 days) represented 30.4%, and for post neonatal (28 days and 11 months) it was 69.6% in Ceará in 1991, of the total deaths of those younger than one year old. In 2000, these same fi gures were 41% and 59% of infant mortality. The high rates in these segments show, in the fi rst, the unsuitable as-sistance on prenatal, on labor, and to newborns, and in the second, poor socioeconomic conditions and mother’s health.*
Reduction in infant mortality is still a great challenge to the country. Despite the important decrease recorded in the last decade, especially due to post-neonatal mor-tality, fi gures are still high. There is a stop in neonatal mortality in the most developed regions and a relative increase in the most vulnerable regions and popula-tion, because of the reduction in post neonatal infant mortality. This situation is worsened when we see that more than 90% of these deaths of younger than one year old could have been avoided with prevention actions, diagnoses and early treatment, or with partnerships with other sectors.
It is known that several births have occurred, especially in cities of the countryside of the state. These deliveries are performed at home, and they are not included in the records of Sistema de Informações sobre Nascidos Vivos (SINASC – Information System on Live Births), or in the statistics of Offi ce of Register of Births. It is expected, that with the high coverage indexes of the Family Health Program in Ceará, there is an under-registration of births.19
Taking into account the political, economic, and aid changes of the end of the 80’s and during the 90’s, one can suppose that there was a change in the factors associated with IMR in Ceará, due to the changes of these decades. The objective of the present study is to discuss the ecological models to describe IMR in Ceará in two different periods: 1991 and 2000.
METHODS
This is a cross-sectional ecological study consider-ing two census years as of information mismatchconsider-ing information per municipalities in Ceará. The year of 1991 encompassed all the 178 municipalities in Ceará and in 2000, all the 184 municipalities.
IMR’s of 1991 and 2000 were employed, estimated by the Institute of Applied Economic Research (IPEA), due to the small coverage of the Information System on Mortality in Ceará in the beginning of the 90’s. To obtain the remaining indicators, different sources have been used from the Health Information System (SIS) of the Ministry of Health through the Technol-ogy Department (DATASUS). Other research sources were the Brazilian Institute of Geography and Statistics (IBGE), Economic Research and Strategy Institute of Ceará (IPECE), Health State Secretariat of Ceará (SESA-CE), and the United Nations Development Program (UNDP).
The following variables have been used:
• Epidemiological indicator: infant mortality rate – IPEA.
• Demographic indicators: urbanization rate –
IPECE; demographic density – IBGE; total fecun-dity – IPEA; ageing index and dependency ratio – IBGE.
• Health attention indicators, infrastructure and hu-man resources in health services: vaccine coverage, hospital beds, equipment and prenatal appointments per inhabitants – DATASUS; indicators of breast-feeding and infant malnutrition – DATASUS and SESA-CE; doctors per inhabitants – IPECE and DATASUS.
• Socioeconomic indicators:
- Education: proportion of illiterate children from sevn to 14 years old, proportion of children from seven to 14 not in school, literacy rate among adults, average number of schooling years of people who were 25 or older – IPEA; propor-tion of literate women and proporpropor-tion of women with less than eight schooling years – IPECE; and component for education of the Human Development Index (IDH) – IPEA and UNDP.
* Ministry of Health (BR). Technology Department of the National Health System - DATASUS, 2003.
- Indicator of housing and sanitation: proportion of small houses (two or less rooms), percentage of the population with access to public supply of water, sewage facilities, trash collection – IPEA and IPECE; access to power supply and proportion of people leaving in house with telephone – IPECE.
- Income and production: proportion of fi nancial resources to health in the municipality – DATA-SUS; proportion of household heads according to income in minimum wages – IPECE and IBGE; proportion of children from ten to 14 years old working – IPEA; proportion of the value of vegetal production compared to the total of the state, proportion of rural, indus-trial, commercial energy use on the total of the municipality, per capita gross domestic product – IPECE; intensity of poverty (line of R$37.75) and IDH-M Income (methodology 2000) – IPEA and UNDP.
Simple and multiple linear regression analysis were introduced to obtain regression coeffi cients that relate each variable in the model with IMR. According to Sz-warcwald (2002),21 the angular coeffi cient of regression
is considered the best indicator to measure inequality in health when the variables health and socioeconomic levels can be quantitatively expressed.
Models were built through unvaried analysis, observing the assumptions of regression, especially regarding the linear correlation between the outcome and the indepen-dent variables. As of this analysis, we have introduced in the model of linear multiple regression, indicators whose regression on IMR presented signifi cance lower than 0.25.9 For multiple linear regression, neperian log
transformation was applied in the dependent variable to normalize residue distribution.
Estimates of the parameters were produced according to the method of least squares, backward selection. The best predictors were chosen assessing their signifi cance in the model through Wald’s test, and 0.05 was the pres-ervation level in the defi nite model.9 The fi nal model
was selected through the coeffi cient of determination (R2) and by normality of residuals. The methodology
described was implemented using statistical softwares Stata 7.0 and SPSS 10.
Additionally to models to discuss their possible deter-miners, a collinearity diagnoses using variance infl a-tion factors (VIF) for individual variables according to Hamilton’s criteria (2003).8
Overall the models proposed derive from the proposi-tions of Mosley14 (1988) and Arroyo et al2 (1988) who
incorporated social and biological variables or more recent variables, distal and proximal determinants to explain the behavior of infant mortality.
RESULTS
Table 1 presents the minimum and maximum value, the mean and standard deviation of all the variables studied. IMR obtained by the mean of municipalities decreased from 70.69 to 47.27 deaths per 1000 live births. Even so, all municipalities presented rates higher than 25 per 1000 live births in the end of the period, of which, 35% presented values higher than 50 per 1000 live births.
Among the variables, health care, vaccine coverage in the year of 1991 had its minimum value of 21.0% and mean of 72.8%, increasing in the year 2000 to 62.7% and 102.3%, respectively, showing improvement in the period. Maximum coverage presented for the year 2000 surpassed 100% in several municipalities. The explanation found for this fact is that some municipali-ties, as they have free demand, cover the population of neighboring cities and/or the population in the age for vaccine was underestimated by IBGE.
Regarding sanitation variables, the proportion of urban and rural houses with tap water increased, reaching the average of 21.5% in 1991 and 40.7% in 2000. Trash collection in urban houses presented increase in the average of coverage from 38.2% in 1991 to 66.5% in 2000. O sewage facilities in urban houses, although its coverage improved (from 3.0% in 1991 to 14.8% in 2000), the value was still considerably below of what is considered as a satisfactory sanitation level.
Among demographic indicators, total fecundity rate was highlighted, representing the mean number of children that women had in their fertile period; the average rates among municipalities decreased from 4.59 to 3.37 in the period, following the national trend.
Among economic indicators, there was an improvement in the proportion of household heads with monthly income lower than half minimum wage, decreasing the average from 33.2% in 1991 to 16.5% in 2000. How-ever, indicator of poverty intensity (line R$ 37.75=¼ minimum wage) showed increase from 45.2% in 1991 to 55.1% in 2000 (minimum wage in 2000, of R$ 151.00, similar to approximately US$ 77.00).
Regarding educational indicators, an improvement in the proportion of literate women was observed (aver-age in 1991 was 60.0% and in 2000 it was 73.5%) although Ceará presents one of the highest national illiteracy rates (24.8%).
Neperian logarithm of IMR in 1991 was better ex-plained (R2=0.3575) by the following co-variables:
proportion of small houses (β=0.0043; ρ=0.010), of people living in houses with tap water (β=-0.0029;
Table 1. Descriptive analysis of infant mortality rate and socioeconomic, demographic and health care indicators. Ceará, Northeastern Brazil, 1991 and 2000.
Variable Unity 1991 2000
Minimum Maximum Minimum Maximum Epidemiologic
Infant mortality rate* Per 1000 LB 47.1 108.9 26.9 81.6 Health care, human resources and infrastructure
Vaccine coverage in < 1 year old Per 100 21.0 97.0 64.2 126.1 % of pregnant women with 4 or more prenatal appointments Per 100 3.0 93.0 44.9 96.5 Number of physicians per 1000 inhab. Per 1000 inhab 0.0 3.1 0.1 4.3 PSF physicians per shift** Unity 0.0 30.0 Pediatrician per shift per 1000 live births ** Unity 0.00 31.4 % of babies < 4 months followed up at PACS/PSF only nursing Per 100 0.0 62.0 26.8 84.8 % of younger than one year old unnourished** Per 100 3.3 33.2 % of younger than 2 years old unnourished** Per 100 0.0 25.9 Hospital beds per 1000 inhab.** Per 1000 inhab 0.0 10.6 Presence or absence of delivery rooms** Yes/no 0.0 1.0 Presence or absence of incubators** Yes/no 0.0 1.0 Housing and sanitation conditions
% of small houses** Per 100 8.7 60.2
% of people living in houses with tap water Per 100 0.3 74.0 2.2 88.5 % of urban houses with trash collection Per 100 0.0 88.5 13.5 95.1 % of people living in urban houses with proper sewage facilities Per 100 0.0 49.9 0.1 81.1 % of people living in houses with energy and refrigerators Per 100 2.9 71.2 11.8 86.8 % of people living in houses with telephone Per 100 0.2 24.8 1.8 55.2 Demographic indicators
Urbanization rate Per 100 11.4 100.0 17.4 100.0 Dependence ratio Per 100 61.9 108.2 52.6 92.9 Total fecundity rate Per 1 woman 2.5 7.8 2.2 4.9 Ageing index Per 100 6.3 29.4 10.3 37.5 Production and income indicators
Poverty intensity: line R$37.75 R$ 32.7 61.5 38.3 73.6 Income per capita R$ 27.3 232.4 46.4 306.7 Human development index-M Income 0.3 0.7 0.4 0.7 % of head of household with income > 1 minimum wage** Per 100 13.8 67.2 % of head of household with monthly income lower than ½ mw
(urban) Per 100 12.8 70.4 1.5 36.6
% use of commercial and industrial energy on the total use of the
municipality ** Per 100 1.9 80.8
% use of rural energy on the total of the municipality ** Per 100 0.2 59.3 % of vegetal production value compared to the total for the state ** Per 100 0.0 2.4 % expenses with personnel regarding total health expense of the
municipality** Per 100 4.1 78.5
% of National Health System transferences regarding total health
expense of the municipality ** Per 100 21.8 94.3 % of children 10 to 14 working Per 100 2.8 41.2 2.7 32.1 Educational indicators
% of illiterate children 7 to 14 Per 100 21.9 79.5 11.9 49.9 % of literate women 10 or over Per 100 38.3 85.2 57.2 90.7 % of women 10 or over with less than 8 years of schooling Per 100 65.3 99.0 54.8 89.2 % of literates*** Per 100 21.4 69.3 39.0 77.3 Human Development Index -M Education 0.3 0.8 0.6 0.9 * Source: Instituto de Pesquisas Econômicas Aplicadas (IPEA - Institute of Applied Economic Research)
** Variables available only for the year 2000 *** Variables available only for the year 1991 PSF: Family Health Program
income lower than ½ minimum wage (β=0.0056;
ρ=0.000) and of literates (β=-0.0062; ρ=0.031), ur-banization rates (β=0.0032; ρ=0.004), total fecundity rate (β=0.0351; ρ=0.024).
Neperian log of IMR of 2000 was better modeled (R2=0.3236) due to the following factors: proportion of
children younger than two ywars and undernourished (β=0.0064; ρ=0.024), of houses with proper sewage fa-cilities (β=-0.0024; ρ=0.010), of the personal expenses in relation to total health expense (β=-0.0024; ρ=0.027), of the value of vegetal production regarding total production of the state (β=-0.1090; ρ=0.001) and of literate women (β=-0.0068; ρ=0.044); intensity of poverty (β=0.0065;
ρ=0.002), ageing index (β=-0.0100; ρ=0.006).
DISCUSSION
The main limitation of ecologic analysis is to expect that causal assumptions of the ecological effect reflect on the biological effect at the individual level.12 Another problem is due to the fact that social
demographic and environmental factors are usually correlated.20 According to spatial autocorrelation,13
neighboring regions tend to present more similari-ties than far away regions. Data aggregation leads to statistical problems due to reduction of variability, with refl ecting on the interferences.12
In this type of study, models presented to explain the components of infant mortality are expressed as Table 2. Description of the multiple linear regression model based on the possible socioeconomic and demographic determiners of the infant mortality rate. Ceará, Northeastern Brazil, 1991.
Neperian log of the infant mortality rate* Regression coeffi cient β
Standard regression coeffi cient β’
β
signifi cance
Confi dence interval of β (95%)
Constant 3.8960 0.000 3.523; 4.269
Proportion of small houses 0.0043 0.183 0.010 0.001; 0.008
Proportion of people living in houses with tap
water -0.0029 -0.222 0.024 -0.005; 0.000
Urban rate 0.0032 0.311 0.004 0.001; 0.005
Total fecundity rate 0.0351 0.172 0.024 0.005; 0.065
Proportion of children 10 to 14 working 0.0049 0.169 0.017 0.001; 0.009
Proportion of head of household with monthly
income lower than ½ mw 0.0056 0.321 0.000 0.003; 0.008
Proportion of literate people -0.0062 -0.228 0.031 -0.012; -0.001 * Source: IPEA
N = 178 F = 13.51 R2 = 0.3575
Table 3. Description of the multiple linear regression model based on socioeconomic and demographic determiners of the infant mortality rate. Ceará, Northeastern Brazil, 2000.
Neperian log of the infant mortality rate* Regression coeffi cient β
Standard regression coeffi cient β’
β
signifi cance
Confi dence interval of β (95%)
Constant 4.2520 0.000 3.658;4.846
Proportion of unnourished children younger
than two years 0.0064 0.146 0.024 0.001;0.012
Proportion of real state with proper sewage
facilities -0.0024 -0.182 0.010 -0.004;-0.001
Ageing index -0.0100 -0.180 0.006 -0.017;-0.003
Proportion of expense with personnel regarding
total health expense -0.0024 -0.148 0.027 -0.005;0.000
Proportion of the value of vegetal production
regarding the total of the state -0.1090 -0.221 0.001 -0.172;-0.047
Intensity of poverty 0.0065 0.210 0.002 0.002;0.011
Proportion of literate women -0.0068 -0.154 0.044 -0.013;0.000
* Source: IPEA
linear combinations among socioeconomic and linear indicators. However, outcomes and co variables are simultaneously taken, therefore cause and consequence correlation is not perfectly seen and the term “possible determinants” for these co variables is better.13
Other limitations are imposed by the indicators included in the analysis, taking into account the quality of infor-mation made available by DATASUS and other systems used. One of the possible causes for the differences found among the models of 1991 and 2000 is related to the fact the set of predictors for each year is not the same because of the databanks. Additionally, different correlation structures among the variables available may, on their own, lead to different sets of statistically signifi cant predictors.
Despite the limitations, there are several reasons for the use of ecologic studies, among them are: the low cost because secondary data are usually used; greater facility to treat variables, when there is limitation regarding individual measuring; interest in ecological effects, following the example of assessment or poli-cies programs; and last, the sense of opportunity, tak-ing into account the level of development of analysis techniques, guided to manage challenges important to the model of the present study.
Coeffi cients of determination (R2) presented translated
that the set of variables incorporated in the regression models could explain about 35% and 32% of the vari-ability of the neperian log of IMR in 1991 and 2000, respectively. The rest of the variation is due to other determinants not covered by these models.
In the present study, the correlation among IMR and sanitation in 1991 occurred with inverse relation be-tween the proportion of urban real states with public water supply and IMR. For 2000, with the greater coverage of this service (about 80% of urban real states present public water supply), the correlation reappears by the proportion of real state with sewage facilities. In 2000, less than 30% of the urban houses in Ceará had sewage facilities, and this situation has changed little in the last years.* Proportion of small houses found in the model of 1991 also reinforces the approximation between infant mortality and poor housing in big urban centers, this idea was corroborated by Monteiro & Nazário11 (2000) when assessing infant environmental
health conditions in the city of São Paulo.
Total fecundity rate was one of the factors forming the model to describe IMR for 1991. According to studies by Patarra16 (2000) in 80’s and the 90’s, the decrease in
fecundity rate in Brazil contributed to the decrease in IMR and consequent improvement in life expectancy.18
Thus the assumption about fecundity which states that
its decrease infl uences directly the reduction in infant mortality, by avoiding risks such as multiparity, small interpregnany interval and extreme labor age.3 This
thesis is corroborated by Costa et al5 (2003) that
con-sidered plausible to say that decrease in fecundity in Brazil in the 80’s was the main responsible for keeping the decline of infant mortality. This factor is not evident in 2000, probably, because of its stabilization in the end of the decade.
Another predictor highlighted in 1991 was the urbaniza-tion rate. This direct correlaurbaniza-tion can be explained by the adverse conditions in big cities by most migrants. With poor education and no professional skills, these migrants are an enormous population, living with low income in inadequate houses with no access to basic sanitation.3 In
Ceará, the 70’s and 80’s characterized by the search of a new survival profi le for part of the population, that do not believe in agriculture and cattle raising for survival. This population fi nds industries and shops in greater cities, causing disorganized population growth in these cities especially in the capital of the State.
Variables indicating poor conditions of life were pre-dictors in 1991, and they continued to be variables of determination in 2000. Indicators of vulnerability and income which are directly related to IMR in 2000: the proportion of children from ten to 14 years old that work, proportion of household heads with monthly income lower than ½ minimum wage, both in 1991, and the intensity of poverty. However, peculiarities are discussed. The fi rst is related to those indicators of mean income, such as gross domestic product (GDP) per capita that can lead to an interpretation bias in the relation with infant mortality, because even if the municipality presents satisfactory levels, this will not imply necessarily income distribution. The second peculiarity refers to the fact that the improvement in economic conditions of a municipality is only translated into social gains if they favor investments in the other sectors such as education, health, access to goods and services, housing and others.
Although there was a reduction in the rate of activity in the age group from ten to 14 years old in all Brazilian regions, the Northeast still concentrates the greatest amount of children working.* In 1997 and 2001, Ceará reached the level of 23.4% and 19.0%, respectively. In the Southeast region, these values are 10.8% in 1997, decreasing to 8.1% in 2001. Reduction in participation of children and adolescents in the formation of the eco-nomically active population must be associated with an improvement of youngsters’ education.*
Taking GDP per capita as a base, Ceará presented a se-ries ranging from R$ 2,418.07, in 1991, to 2,794.14, in 2000, below the regional mean of R$ 3,014.15, whereas
states such as São Paulo, Rio de Janeiro, Rio Grande do Sul and Distrito Federal presented in 2000, a per capita GDP of R$ 9,995.11, R$ 9,571.49, R$ 8,341.04 and R$ 14,405.37, respectively.*
Inter-regional difference regarding the percentage of the population in poverty state (monthly family income of up to ¼ minimum wage), in the period of 1992-2001, was strong. Based on this last year, the Northeast region presented 50.9% of its population in this condition,** and Ceará presented 52.1% as a result.
Indicators of educational level are covered by the regression models in both periods. It is acknowledged by the World Bank that the educational development policies are strongly related to the gains obtained in health. The level of instruction is considered a marker of socioeconomic condition of the mother and her fam-ily. Additionally to the focus, the educational level of the mother may be also understood as factor related to the cultural profi le and behaviors linked with behaviors connected with health care, which have an important effect in determining infant mortality.7
The presence of the proportion of children younger than two years undernourished, and of the proportion of the value of the vegetal production in relation to the total of the state in the model to describe IMR, in 2000, reinforces the importance of the relation between diet and infant mortality. With that, one may assume that municipalities with greater agricultural production use part of this production for their own population. In Ceara’s GDP for 2000, a greater growth of cattle raising regarding other components is seen, using as a reference the years of 1998 and 1999.*** Food, environ-ment and children care are conditioned by the level of income, although they can be changed by actions such as public health services, sanitation, education and other relieving policies.4
Ageing rate, part of the model in 2000, shows the importance of resources coming from retirement pen-sions in extremely poor municipalities15 and the ageing
of the Brazilian population over the last decades, a process called demographic transition.16 The
propor-tion of children and youngsters that was 42.1% up to the 70’s is decreasing, and in 2000 it was 29.6% of the total. Estimates point out that this decrease in the participation of children and youngsters will continue (23.3%) and the increase in elderly will be maintained
(12.6%) up to 2020, that is a 47% relative increase in the next 20 years.6
The proportion of expenses with human resources re-garding total health expense, found in the 2000 model, shows the importance of investments in personnel to improve the quality of health level, assessed by infant mortality. A concrete example of this investment in Ceará, is the Family Health Program, that created jobs for health professionals, and the need for a hierarchized net of outpatients facilities and hospitals and a qualifi ed clinical team that ensure secondary care in the different regions of the state.1
Income, education and sanitation were maintained as possible determiners of IMR. However, new variables were introduced in the assessment of 2000, enabling that elements connected with health care, agricultural production, ageing of the population and income distri-bution explained the behavior of IMR. Urbanization, fe-cundity, infant work was no longer part of the model.
After adopting public measures of selective care for children’s health, an effective reduction in IMR was observed in the 90’s in all municipalities. However, that does not mean that socioeconomic determiners are no longer important in favoring infant survival. In the absence of deeper social changes, the difference among municipalities regarding IMR reduction is the greater intensity state and municipal managers apply selection measures in primary care.
These strategies of basic care are emergency measures and are not enough to reduce to infant mortality and to maintain it in the lowest possible level.5 Its
continu-ity will depend on structural changes, such as: better income distribution through creation of job posts, encouragement of production, population access to the profi ts of this production, inclusion of the population in educational programs, expansion of sanitation and of primary and secondary health care. These measures are examples of concrete institutional actions that affect the levels of infant mortality and restructure the order of their determinants.
With the relative increase in the neonate component of infant mortality, other different measures of primary care must be developed. Reduction in neonate mortal-ity is also dependent on a more qualifi ed prenatal care, delivery and care of newborns.
* Ministério da Saúde. Departamento de Informática do Sistema Único de Saúde. Datasus. Brasília; 2003 ** Ministério da Saúde. Departamento de Informática do Sistema Único de Saúde. Datasus. Brasília; 2004
1. Andrade FM, editor. O programa de saúde da família no Ceará. Fortaleza: Expressão Gráfi ca e Editora; 1998. Ceará: abrindo as portas para saúde dentro de casa;p.49-59.
2. Arroyo P, Langer A, Avila H, Llerena C. Modelo para el analisis de la sobrevivencia en la infancia. Salud Publica Mex. 1988;30(3):463-9.
3. Ayçaguer LCS, Duran Macho E. Mortalidad infantil y condiciones higienico-sociales en las Ameritas: un estudio de correlación. Rev Saude Publica.
1990;24(6):473-80.
4. Benício MH, Monteiro CA, Costa-Rosa TE. Evolução da agenda tradicional da saúde pública: defi ciências nutricionais. Evolução da desnutrição, da pobreza e do acesso a serviços públicos em dezesseis estados. In: Monteiro CA, organizador. Velhos e novos males da saúde no Brasil: a evolução do país e de suas doenças. 2. ed. São Paulo: Hucitec; 2000. p. 141-52.
5. Costa MCN, Mota ELA, Paim JS, Silva LMV, Texeira MG, Mendes CMC. Mortalidade infantil no Brasil em períodos recentes de crise econômica. Rev Saude
Publica. 2003;37(6):699-706.
6. Fundo das Nações Unidas para a Infância. Situação da infância brasileira: 2001. Brasília: 2001.
7. Goldani MZ, Benatti R, Silva AAM, Bettiol H, Correa JCW, Tietzmann M, et al. Narrowing inequalities in infant mortality in Southern Brazil. Rev Saude Publica. 2002;36(4):478-83.
8. Hamilton LC, editor. Statistics with STATA. Belmont: Duxbury Thompsom Learning; 2003. Regression diagnostics. p. 152-70.
9. Hosmer DW, Lemeshow S, editors. Applied logistic regression. New York: Wiley; 1989. Model-building strategies and methods for logistic regression. p. 83-133.
10. Monteiro CA, Nazário CL. Evolução da agenda tradicional da saúde pública: mortalidade infantil e materna. Declínio da mortalidade infantil e eqüidade social: o caso da cidade de São Paulo entre 1973 e 1993. In: Monteiro CA, organizador. Velhos e novos males da saúde no Brasil: a evolução do país e suas doenças. 2.ed. São Paulo: Hucitec; 2000. p. 173-85.
11. Monteiro CA, Nazário CL. Evolução de condicionantes ambientais da saúde na infância na cidade de São Paulo (1984-1996). Rev Saude Publica. 2000;34(6 supl.):13-8.
12. Morgenstern H. Ecologic studies in epidemiology: concepts, principles and methods. Ann Rev Public
Health. 1995;16:61-81.
13. Morgenstern H. Ecologic studies. In: Rothman K, editor. Modern epidemiology. Philadelphia: Lippincott; 1998. p. 459-80.
14. Mosley WH. Determinantes biologicos y
socioeconomicos de la sobrevivencia en la infancia.
Salud Publica Mex. 1988;30(3):312-28.
15. O Globo (editorial). O fôlego da terceira idade: segurados do INSS respondem por até 60% do movimento de pequenos mercados no interior. O Globo. Rio de Janeiro, 2004 nov 7: 33
16. Patarra NL. Mudanças em condicionantes da saúde. Mudanças na dinâmica demográfi ca. In: Monteiro CA, organizador. Velhos e novos males da saúde no Brasil: a evolução do país e de suas doenças. 2. ed. São Paulo: Hucitec; 2000. p. 61-8.
17. Population Reference Bureau. Cuadro de la poblacion mundial: datos e cálculos demográfi cos sobre los países y regiones del mundo. Washington: 2001.
18. Simões CCS, Ortiz LP. A mortalidade infantil no Brasil nos anos 80. In: Chadad J, Cervini R, editores. Crise e infância no Brasil: o impacto das políticas de ajustamento econômico. São Paulo: IPE/USP; 1988. p. 243-68.
19. Simões CCS. Perfi s de saúde e de mortalidade no Brasil: uma análise de seus condicionantes em grupos populacionais específi cos. Brasília: OPAS; 2002.
20. Susser M. The logic in ecological: II. the logic of design. Am J Public Health. 1994;84(5):830-5.
21. Szwarcwald CL, Bastos FI, Andrade CLT. Medidas de desigualdad en salud: la discusión de algunos aspectos metodológicos con una aplicación para la mortalidad neonatal en el Municipio de Rio de Janeiro, 2000. Cad
Saude Publica. 2002;18(4):959-70.