R E S E A R C H
Open Access
The variability and reproducibility of whole
genome sequencing technology for
detecting resistance to anti-tuberculous
drugs
Jody Phelan
1†, Denise M. O
’
Sullivan
2†, Diana Machado
3†, Jorge Ramos
3, Alexandra S. Whale
2, Justin O
’
Grady
4,
Keertan Dheda
5, Susana Campino
1, Ruth McNerney
5†, Miguel Viveiros
3†, Jim F. Huggett
2,6†and Taane G. Clark
1,7*†Abstract
Background:The emergence of resistance to anti-tuberculosis drugs is a serious and growing threat to public health. Next-generation sequencing is rapidly gaining traction as a diagnostic tool for investigating drug resistance inMycobacterium tuberculosisto aid treatment decisions. However, there are few little data regarding the precision of such sequencing for assigning resistance profiles.
Methods:We investigated two sequencing platforms (Illumina MiSeq, Ion Torrent PGM™) and two rapid analytic pipelines (TBProfiler,Mykrobe predictor) using a well characterised reference strain (H37Rv) and clinical isolates from patients with tuberculosis resistant to up to 13 drugs. Results were compared to phenotypic drug susceptibility testing. To assess analytical robustness individual DNA samples were subjected to repeated sequencing. Results:The MiSeq and Ion PGM systems accurately predicted drug-resistance profiles and there was high reproducibility between biological and technical sample replicates. Estimated variant error rates were low (MiSeq 1 per 77 kbp, Ion PGM 1 per 41 kbp) and genomic coverage high (MiSeq 51-fold, Ion PGM 53-fold). MiSeq provided superior coverage in GC-rich regions, which translated into incremental detection of putative genotypic drug-specific resistance, including for resistance to para-aminosalicylic acid and pyrazinamide. TheTBProfilerbioinformatics pipeline was concordant with reported phenotypic susceptibility for all drugs tested except pyrazinamide and para-aminosalicylic acid, with an overall concordance of 95.3%. When using theMykrobe predictorconcordance with phenotypic testing was 73.6%.
Conclusions:We have demonstrated high comparative reproducibility of two sequencing platforms, and high predictive ability of theTBProfilermutation library and analytical pipeline, when profiling resistance to first- and second-line anti-tuberculosis drugs. However, platform-specific variability in coverage of some genome regions may have implications for predicting resistance to specific drugs. These findings may have implications for future clinical practice and thus deserve further scrutiny, set within larger studies and using updated mutation libraries.
Keywords:Drug resistance, Tuberculosis, Diagnostics, Drug-susceptibility testing, XDR-TB, Next-generation sequencing
* Correspondence:[email protected]
†
Equal contributors
1Department of Pathogen Molecular Biology, Faculty of Infectious and
Tropical Diseases, London School of Hygiene & Tropical Medicine, Keppel Street, WC1E 7HT London, UK
7
Faculty of Epidemiology and Population Health, London School of Hygiene & Tropical Medicine, WC1E 7HT London, UK
Full list of author information is available at the end of the article
Background
Mycobacterium tuberculosis, the bacterium that causes tuberculosis disease (TB), has overtaken HIV as the world’s major cause of death from an infectious agent [1]. In recent years, control of the disease has been made more difficult by the emergence of multidrug-resistant tuberculosis (MDR-TB), which is resistant to at least ri-fampicin and isoniazid, and extensively drug-resistant (XDR-TB), which refers to additional resistance to the fluoroquinolones and second-line injectable drugs (amikacin, kanamycin and capreomycin) used to treat MDR-TB [2]. Programmatically incurable TB with resist-ance to up to 14 drugs has been reported in several parts of the world, including countries with a high TB burden such as India and South Africa [3, 4]. Phenotypic methods of determining susceptibility to anti-TB drugs take weeks or months, they are additively costly, and re-quire culture and manipulation of large numbers of highly infectious bacilli. Drug resistance in M. tubercu-losisis almost exclusively due to mutations in the circu-lar genome and so molecucircu-lar determination of resistance offers a rapid, potentially cost effective, and safer alter-native. Commercially available molecular-based tests and line probe assays cover a limited number of drugs but, with the exception of rifampicin, they have relatively low sensitivity for detecting all possible molecular targets for resistance [5]. Due to the multiplicity of drugs used in the treatment of TB, determining the full resistance pro-file for a patient suspected of having drug-resistant dis-ease requires the examination of many loci.
Next-generation whole genome sequencing offers an attractive option as it simultaneously examines all loci and provides information regarding both small and large changes in the genome [5]. This option has been widely reported as a means of identifying putative resistance-causing mutations and more recently has been used in the management of patients with drug-resistant TB to guide selection of appropriate drug regimens [6–11]. This approach is significant because the current treat-ment outcomes for MDR-TB are poor, largely due to current molecular tests being unable to guide effective individualised therapy. It also has public health implica-tions because of prolonged patient infectiousness due to suboptimal treatment.
TheM. tuberculosisgenome is challenging to sequence due to its high GC content and repetitive nature. Sur-prisingly, despite the serious consequences of misdiag-nosis, there is a paucity of data regarding the reliability of next-generation sequencing platforms or the analyt-ical methodology used for assigning resistance [5]. To address this issue we investigated the utility of two com-mercial sequencing platforms for predicting resistance to 13 anti-TB drugs. We also examined analytical algo-rithms and two rapid bioinformatics tools (TBProfiler,
Mykrobe predictor) for predicting resistance from raw se-quence data. Testing was performed with a fully suscep-tible reference strain (H37Rv) and ten clinical isolates from patients with drug-resistant TB.
Methods
Samples
M. tuberculosis clinical isolates were sourced from ten patients with known drug-resistant TB admitted to four different hospitals in Lisbon between 2007 and 2013. These samples were not part of a transmission chain and there is no epidemiological link between the pa-tients. All clinical samples and the reference strain H37Rv (ATCC 25618D-9, Lot # 60986340) were pre-pared by inoculating a single colony into Middlebrook 7H9 broth supplemented with 10% OADC (Becton Dickinson) (see Table 1 for list). Susceptibility testing for the first-line anti-TB drugs rifampicin (RIF), isoniazid (INH), ethambutol (ETB), pyrazinamide (PZA) and streptomycin (STR) and the second-line drugs rifabutin (RFB), amikacin (AMK), capreomycin (CAP), ofloxacin (OFX), moxifloxacin (MOX), ethionamide (ETH), para-aminosalicylic acid (PAS) and linezolid (LZ) was per-formed on all strains with the MGIT960 system (Becton Dickinson), according to the manufacturer’s instructions. Quantitative drug susceptibility testing (qDST) for both first- and second-line drugs was conducted using a com-bination of the MGIT960 system and the Epicenter V5.80A software equipped with the TB eXIST module (Becton Dickinson) [12, 13].
DNA was extracted and purified from the liquid cul-tures using a cetyltrimethylammonium bromide (CTAB) method [14]. The quality was assessed by fluorometric quantification, Qubit™ 3.0 Fluorometer with a dsDNA Broad Range Assay Kit (Thermo Fisher Scientific) and agarose gel electrophoresis. Triplicate DNA samples from each clinical isolate were prepared (biological repli-cates) and individual DNA extracts were subjected to re-peated sequencing (technical replicates).
Library preparation and sequencing
with an Illumina MiSeq V3 and 300-bp paired-end reads with samples randomised across two runs (each ~24 h in duration).
Ion Torrent library preparation and sequencing was performed at Thermo Fisher Scientific, UK. Sequencing was carried out with the Ion Torrent PGM™system (Ion PGM). Libraries were constructed with the Ion Xpress™
Plus Fragment Library Kit as per the manufacturer’s in-structions (MAN0009847 Revision C.0), using 100 ng of genomic DNA which was sheared with the provided Ion Shear™ Plus Reagents to an average size of 350 bp, size selection using an E-Gel® SizeSelect™2% Agarose Gel, and purification with Agencourt® AMPure® XP Reagent. Fi-nally, the libraries were quantified on the StepOnePlus™
System using the Ion Library Quantitation Kit, then diluted to 100 pM and pooled in equal volume. Purified libraries were sequenced with an Ion 318™v2 chip (400-bp kit) and the Ion PGM™ HiQ™ Chef Kit as stated in the manual (MAN0010919, revision A.0). The runtime was ~3 h per sample. The software used on both Ion PGM™ and the Ion Chef™ System was Torrent Suite™
Software version 4.6.
Bioinformatic pipeline
For the bioinformatic analysis we used a previously re-ported pipeline [10, 15, 16]. Unless stated otherwise, software was run at default settings. Reads were trimmed by Trimmomatic using a PHRED quality of 20 as the cutoff. Trimmed reads were then mapped against H37Rv (GCA_000195955.2) with BWA-mem v0.7.12 [17]. SNP and insertion and deletion (indel) variants were called with Samtools 0.1.19 [18] and GATK v3.6 [19]. We
compared the variants called by both algorithms, but also report results of the conservative and typical ap-proach of retaining the consensus polymorphisms across both methods. The genotypes of SNPs were called when an alternative allele was found in 20% of the mapped reads at a particular position. A default minimum depth of ten reads was required to call SNP genotypes, other-wise genotypes were denoted as missing data. This cutoff has been applied widely [15, 16, 20]. The robustness of the genotype calls was assessed across a range of depths of coverage of the reference and alternative alleles (depth 5–20, major allelic frequency >0.5 and >0.7). The refer-ence genome was partitioned into overlapping 300-bp sequences allowing the uniqueness of genomic regions to be determined usinggem-mappability[21]. Only 1.5% of the genome was estimated to be non-unique, and variants within these regions were discarded, leaving a set of high quality SNPs and indels. All 36 candidate drug-resistance genes [5] were found to be unique, thus removing the risk of false calling of SNPs due to inappro-priate mapping to an analogous region. A summary of the pipeline is presented in Additional file 1: Figure S1.
In silico profiling ofM. tuberculosisresistance phenotypes
We compared two informatics tools for assigning resist-ance from sequence data. Drug-resistresist-ance status across 14 drugs was called in silico from raw sequence data using the web-based TBProfiler tool (http://tbdr.lshtm.ac.uk/) [5]). This tool also generates lists of mutations in candi-date loci, and these formed the basis of identifying any additional putative novel polymorphisms. All mutations were checked by analysis of alignments and de novo
Table 1Study samples (DNA extracted from culture isolates) and their susceptibility to anti-tuberculosis drugs Sample Yeara Lineage Spoligo.
family
Drug susceptibility test phenotype
INH RIF STR ETB PZA RFB ETH AMK CAP OFX MOX PAS LZ KANb Resistance phenotype
POR1 2007 4.3.4.2 LAM4 R R R R R R R R R R R R S R XDR-TB
POR2 2007 4.1.1.1 X2 R R S S S R R S S S S S S - MDR-TB
POR3 2007 4.3.4.2 LAM1 R R R R R R R R R R R S S R XDR-TB
POR4 2007 4.3.4.2 LAM1 R R R R R R R R S R R S S R XDR-TB
POR5 2007 4.3.4.2 LAM4 R R R R R R R S S S S S S - MDR-TB
POR6 2008 4.3.4.2 LAM4 R R R R R R R R R R R S S R XDR-TB
POR7 2009 4.3.4.2 LAM4 R R R R R R R R R R R S S R XDR-TB
POR8 2012 4.3.4.2 LAM4 R R R R R R R R R R R S S R XDR-TB
POR9 2011 4.3.4.2 LAM4 R R R R R R R R R R R R S R XDR-TB
POR10 2013 4.2.1 Ural H3/4 R R R R R R R S S S S S S R MDR-TB
H37Rv - 4.9 H37RV S S S S S S S S S S S S S - Pan-susceptible
MDR-TBmultidrug-resistant TB,XDR-TBextensively drug-resistant TB,INHisoniazid,RIFrifampicin,STRstreptomycin,ETBethambutol,PZApyrazinamide,RFBrifabutin,
ETHethionamide,AMKamikacin,CAPcapreomycin,OFXofloxacin,MOXmoxifloxacin,PASpara-aminosalicylic acid,LZlinezolid,KANkanamycin,S“susceptible”,
R“resistant”
Bold indicates discrepant calls byMykrobe Predictor, underlining indicates discrepant calls byTBProfiler
aYear of collection
assembly, as well as confirmed by alternative sequencing methods (see the next section, “Confirmation of muta-tions detected by whole genome sequencing”). Resistance profiles were also generated with the Mykrobe predictor tool (version July 2016) [22].
Confirmation of mutations detected by whole genome sequencing
Genomic DNA was extracted as described above and used for PCR amplification prior to examination by line probe assay and/or DNA sequencing. The Genotype MTBDRplus (Hain Lifescience) investigates the rpoB and katG genes and inhA regulatory region and Geno-type MTBDRsl (version 1, Hain Lifescience) investigates rrs, gyrA and embB. Both kits were used according to the manufacturer’s instructions. As the line probe assays encompass a limited number of loci, we also performed Sanger sequencing for inhA, katG, tlyA,eis, gidB, pncA, gyrA, ethA, embB, embC-embA, rpsL, folC and thyX genes (see Additional file 2: Table S1 for the primers used). PCR products were purified and both strands se-quenced at StabVida (Portugal). All sequences were edi-ted and analysed with ChromasPro 2.0.0 (Technelysium, Australia), compared to the sequences ofM. tuberculosis H37Rv reference strain (GenBank AL123456.2) and aligned with Clustal Omega [23].
Results
Coverage
Triplicate “extraction” DNA samples from ten clinical isolates and a single H37Rv sample were sequenced on the MiSeq platform. Four DNA samples (from POR5, 6 and 7 and H37Rv) were each sequenced six times (“ tech-nical” replicates). Duplicate DNA samples from three clinical isolates (POR1, 2 and 6) were also sequenced on the Ion PGM. Summaries of the sequence data obtained for each platform are presented in Additional file 3: Table S2. With MiSeq sequencing the number of paired reads varied across samples (median 1.2 million, range 0.4 to 3.2 million), and on average 99% of reads mapped to the H37Rv reference, giving a median depth of cover-age of 51-fold (across sample range 18- to 79-fold). The majority of the genome (>96%) was covered to at least tenfold depth.
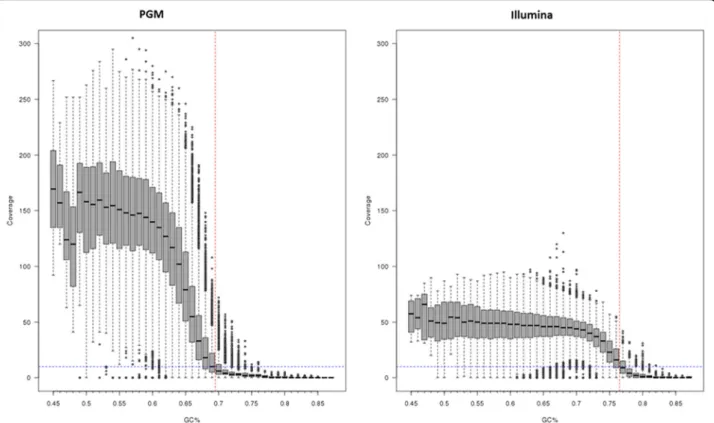
In contrast, for the Ion PGM platform the median number of reads was 990,854 (range 928,006–1,124,215) translating into a median of 53-fold (range 48- to 59-fold) genomic coverage. A large proportion of the genome (~25%) had low coverage and was attributed to regions with high GC content (Fig. 1). Whilst high coverage (100- to 200-fold) was attained for regions with GC content up to 69%, above this level coverage drops below tenfold, which was the cutoff used for calling vari-ants. For MiSeq sequence data, this drop only occurs
when the GC content reaches 75% or above. Many re-gions in the M. tuberculosis genome, especially the pe/ ppe genes [24], are high in GC content (median 69%, range 47–87%) and therefore potentially difficult to characterise. The coverage across the 36 drug-resistance candidate genes was high for MiSeq (mean ~90-fold) and exceeded the tenfold cutoff, except in thethyAgene in the three POR1 replicates (Fig. 2). These XDR-TB replicates contained doubledfrA-thyAdeletions, thought to be responsible for para-aminosalicylic acid (PAS) re-sistance [25]. A direct comparison of the POR1, 2 and 6 sample coverage across platforms highlighted greater variability in candidate genes in Ion PGM due to differ-ential GC content. Whilst there was platform-wide de-tection of the deletion-driven lower coverage in thyAin POR1 (Fig. 3; Additional file 4: Figure S2), the variable coverage in the neighbouring regions for Ion PGM could lead to less certainty in detection.
SNP variants and error rates
We estimated the variant error rates (measured as the number of sites which were discordant among repli-cates) to be low for both platforms (MiSeq 1 per 77 kbp, Ion PGM 1 per 41 kbp). Across comparable samples, the number of high quality SNPs detected using MiSeq data was higher than from Ion PGM, mostly due to low coverage in the alignments generated from the Ion PGM (Additional file 3: Table S2). We sought to investigate the effects of variant calling algorithms on the numbers of SNPs detected in unique genomic regions. From the MiSeq H37Rv data, similar numbers of SNPs were de-tected across replicates (Samtools 64–69 SNPs and GATK 69–79 SNPs, overlap 69 SNPs), supporting the existence of those variants and high sequence reproduci-bility (Additional file 5: Table S3). Across clinical isolate replicates the number of SNPs identified was similar and the overlap between variant calling algorithms was high (>90%; Additional file 5: Table S3). This observation was supported by the Ion PGM data but, due to uneven coverage, at least 120 SNPs fewer were identified when compared to matching MiSeq samples. Within platforms and calling algorithms there was variation between repli-cates in the indels detected, but there was high overlap between algorithms (>90%; Additional file 5: Table S3). Compared to SNPs the breakpoints for these variants are more difficult to characterise from alignments.
Figure S4). In general, differences in the number of SNPs between theSamtoolsandGATKalgorithms decreased as the depth of coverage and allelic frequency thresholds in-creased. For H37Rv, read depths in excess of 20-fold had no impact on variants detected. Across clinical isolates, the highest possible stringency tested consisted of using a minimum coverage of 20 and an allelic fre-quency of 0.7 and led to near identical numbers of total SNPs called by the two variant calling algorithms (Samtools 1943, GATK 1990, either 2097, both 1840 SNPs; Additional file 7: Figure S4). Much of the dis-cordance in the number of SNPs within replicate groups is due to differences in coverage leading to some polymorphisms not passing quality control fil-ters. Using SNPs for which all replicates have non-missing genotypes, all replicates had identical numbers of SNPs except POR3C, which differed by two SNPs between POR3A and POR3B. Overall, the analyses in-dicated no major differences in SNPs detected between the two calling algorithms, and this supported the use of consensus variants for downstream analysis. For ex-ample, the set of common SNP variants were used to clus-ter all samples within a phylogenetic tree usingFastTree v2.1.7 [26] (Additional file 8: Figure S5). Perfect clustering
was observed amongst isolates and their replicates. At a finer resolution, we analysed the SNP differences between the replicates, and none were identified.
Calling in silico resistance phenotypes
When the MiSeq raw sequence data were subjected to analysis using TBProfiler, agreement with phenotypic susceptibility testing was high (95.3%, 82/86; Table 1). Discrepant results were recorded for PZA (×2) and PAS (×2) where phenotypically resistant isolates not identi-fied by TBProfiler were found to have novel mutations in known candidate genes (Additional file 9: Table S4). The novel polymorphisms included a deletion in pncA of 20 bp (nucleotides 437–449) and a nucleotide inser-tion (GG) between codons 130 and 131. PAS-resistant isolates had a folC S98G mutation and a thyX G-4A, thyX I161T, dfrA-thyA deletion. Phenotypic testing of kanamycin drug susceptibility was not performed, but mutations associated with its resistance were detected in all eight isolates (Table 1; Additional file 9: Table S4). All mutations were confirmed using independent Sanger capillary sequencing and/or the line probe assays Genotype MTBDRplus and Genotype MTBDRsl (Hain).
Phenotypic resistance profiles were confirmed and quantified by the qDST method for the MGIT960 system [12, 13].
The Mykrobe predictor tool was also applied to in silico call resistance. This approach looks for mutations associated with resistance to first-line drugs (rifampicin, isoniazid, ethambutol) and second-line drugs (strepto-mycin, ciprofloxacin, ofloxacin, moxifloxacin, amikacin, kanamycin, capreomycin). Of the 72 resistance calls made, 19 (26.4%) were incorrectly called “susceptible”.
False negative calls were made for isoniazid (×1), etham-butol (×2), streptomycin (×4), amikacin (×4), and capreomycin (×3). Additionally there was a disagreement between TBprofiler and Mykrobe predictor with four samples for kanamycin, the latter program calling them as“susceptible”(Table 1).
For Ion PGM, when predicting individual drug-resistance profiles in the three isolates, in one isolate the gyrAD94A mutation associated with fluoroquinolone re-sistance could not be detected due to lack of coverage
(Additional file 5: Table S3). However, the mutation was recovered if the coverage threshold was relaxed from ten- to fourfold.
Discussion
Advances in next-generation sequencing technology have expanded opportunities for genome analysis in the clinical laboratory. Determining resistance to anti-TB drugs by whole genome sequencing has been demon-strated as feasible and is being implemented in some specialist centres [6]. For acceptance as a diagnostic tool to guide treatment of drug-resistant TB the sequencing platforms and analytical tools employed must be robust and reliable. Here we have investigated the performance of two commercial ‘bench-top’ next generation sequen-cing platforms and attempted to assess the robustness of a bioinformatics analysis pipeline with respect to variant calling, across sequencing replicates.
The MiSeq and Ion PGM both proved satisfactory for determining drug-resistance profiles. Compared to Ion PGM, MiSeq sequence coverage was more uniform and was better represented in regions with high GC con-tent. However, we did not investigate the impact of the different library preparation methods used (mechanical (MiSeq) and enzymatic (Ion PGM) processing). Sample quality and the mode or preparation have been shown to influence the depth of coverage in high GC regions [27], and further work is required to investigate this. The Ion PGM platform has previously been used to
characterise mutations in XDR-TB strains [6], but the minimum read depth used to call alleles (fourfold) were less stringent than the tenfold coverage threshold adopted here.
SamtoolsandGATK when used to process the raw se-quence data produced diverse outputs but filtering based on coverage and allelic frequency led to almost complete agreement on resistance causing SNPs. There was, how-ever, lower concordance between the final sets of indels. As previously reported, the false discovery rate for Samtoolsis higher than forGATK and rises as coverage increases [28]. A common strategy is to undertake dual analysis and consider the intersection of the Samtools and GATK derived SNPs but select only the GATK indels [16]. The high reproducibility of sequence data from replicate samples is reassuring as it affirms the validity of next-generation sequencing as a tool for in-vestigating transmission events.
Of the two rapid tools examined, the TBProfiler gave 100% concordance with phenotypic DST results for INH, RIF, STR, ETB, ETH and the fluoroquinolones. Of the nine PZA-resistant isolates, known resistance SNPs were reported for seven isolates with an insertion and deletion observed for the remaining two. Possible novel resistance mutations were also observed for both the PAS-resistant isolates. The Mykrobe predictor detected resistance for nine drugs, of which eight had DST re-sults. Concordance was 100% for RIF, OFX and MOX, but resistance was missed for one or more isolates for
the remaining five drugs. Misclassification of resistance of amikacin and capreomycin as susceptible has signifi-cant clinical implications as patients may be assigned treatment that is not effective for XDR-TB.
The identification of a PAS resistance-related dfrA-thyA double deletion in an XDR-TB sample highlights the need to look at non-SNP variants. Significantly, the laboratory platform being used may impact the detection of putative drug resistance. This is critical in XDR-TB and resistance beyond XDR-TB where use of drugs like PAS may make the difference in providing a life-saving effective regimen of at least five drugs [29]. Large dele-tions and other structural variants may be detected by applying a combination of complementary approaches (pair-end, split-read and depth of coverage) followed by a validation process involving de novo assembly of bor-dering reads and re-alignment to the reference genome [10, 16, 24]. However, high genome-wide sequence coverage is necessary to perform such analyses.
As expected the genotypic profiling was concordant with the phenotypic determination of drug-resistance levels confirming the reliability and robustness of the se-lected genes and mutations as predictors of resistance for almost all drugs tested; with discrepancies still being noticed for PZA and PAS due to lack of enough infor-mation on their mechanism of action [12, 30]. Surpris-ingly, no discrepancies were found for EMB, a drug known to have low correlation between the emb genes and phenotypic resistance [12].
Conclusions
Sequencing platforms are becoming more accessible and economical. Our work suggests that they are capable of de-livering high quality data regarding resistance to anti-TB drugs but do not all perform to the same standard and quality monitoring is advisable. Further studies are needed to evaluate these analytical tools, which as yet do not have regulatory approval for clinical use. It is expected that drug-resistance profiling using next-generation sequencing will gain accuracy and reliability with the gathering of improved knowledge of the drug-target genes and resistance-causing mutations, including for the new drugs recently approved for the treatment of MDR- and XDR-TB [29, 31]. Ultim-ately, drug resistance profiling using next-generation se-quencing offers rapid assessment of resistance-associated mutations, thus accelerating access to effective treatment.
Additional files
Additional file 1: Figure S1.Bioinformatics pipeline. (TIFF 81 kb)
Additional file 2: Table S1.Sanger sequencing primers for genomic variant confirmation. (DOCX 132 kb)
Additional file 3: Table S2.Summary of the sequencing data, coverage and SNPs for each sample. (DOCX 22 kb)
Additional file 4: Figure S2.aMean coverage for all samples for each drug resistance gene. Deletion ofdfrA-thyAis evident by the zero coverage outliers in POR1.bMean coverage across drug-resistance genes. (TIFF 273 kb)
Additional file 5: Table S3.Replicate variation across extraction and calling algorithms, and phenotypic profiles. (DOCX 20 kb)
Additional file 6: Figure S3.The changes in the number of SNPs characterised across algorithms for H37Rv. (TIFF 85 kb)
Additional file 7: Figure S4.The changes in the number of SNPs characterised across algorithms for the ten clinical isolates. (TIFF 92 kb)
Additional file 8: Figure S5.Phylogenetic tree of all the MiSeq sequenced samples. (TIFF 76 kb)
Additional file 9: Table S4.Mutations that potentially explain drug resistance in the samples. (DOCX 19 kb)
Acknowledgements
We wish to thank ThermoFisher Scientific for performing the Ion Torrent PGM™sequencing. Sequence analysis was performed on the MRC UK funded eMedlab computing resource.
Funding
This work was supported by the UK National Measurement System and the European Metrology Research Programme (EMRP) joint research project [HLT08]“Infect-Met”, which is jointly funded by the EMRP participating countries within EURAMET and the European Union. JP is the recipient of a BBSRC PhD studentship. TGC is funded by the Medical Research Council UK (grant number MR/K000551/1, MR/M01360X/1, MR/N010469/1). SC is funded by the Medical Research Council UK (grant number MR/M01360X/1). DM is supported by Fundação para a Ciência e a Tecnologia, Portugal (grant number SFRH/BPD/100688/2014). DM, JR and MV are thankful for the support of grant GHTMUID/Multi/04413/2013 from Fundação para a Ciência e a Tecnologia, Portugal. These funding bodies did not have a role in the design of the study and collection, analysis and interpretation of data and in writing the manuscript.
Availability of data and materials
All raw sequencing data for both MiSeq and Ion PGM can be accessed from the European Nucleotide Archive (ENA) Sequence Read Archive (project accession PRJEB15555). Pipeline scripts are available from http://pathogenseq.lshtm.ac.uk.
Authors’contributions
JP, DMO, MV, JFH and TGC conceived and designed the study; DMO, ASW, DM and JR performed laboratory experiments and curation of meta data for sequencing; DMO, DM, JR, ASW, JO’G, SC, MV and JFH contributed biological samples, sequencing or phenotypic data; JP performed the statistical analysis under the guidance of SC and TGC; DMO and JFH led the sequencing efforts; JP, DMO, DM, KD, RM, MV, JFH and TGC wrote/drafted and finalised the manuscript with contributions from all other authors. The final manuscript was read and approved by all authors.
Competing interests
The authors declare that they have no competing interests.
Consent for publication
Not applicable.
Ethics approval and consent to participate
Not applicable.
Author details
1Department of Pathogen Molecular Biology, Faculty of Infectious and
Tropical Diseases, London School of Hygiene & Tropical Medicine, Keppel Street, WC1E 7HT London, UK.2Molecular Biology, LGC Ltd, Queens Road, Teddington, Middlesex TW11 0LY, UK.3Unidade de Microbiologia Médica, Global Health and Tropical Medicine, GHTM, Instituto de Higiene e Medicina Tropical, IHMT, Universidade NOVA de Lisboa, UNL, Lisbon, Portugal. 4Norwich Medical School, University of East Anglia, Norwich Research Park,
Biosciences & Medicine, Faculty of Health & Medical Science, University of Surrey, Guildford GU2 7XH, UK.7Faculty of Epidemiology and Population Health, London School of Hygiene & Tropical Medicine, WC1E 7HT London, UK.
Received: 30 August 2016 Accepted: 30 November 2016
References
1. World Health Organization. Global Tuberculosis Report 2015. Geneva: World Health Organization; 2015.
2. Zignol M, Dean AS, Falzon D, van Gemert W, Wright A, van Deun A, et al. Twenty years of global surveillance of antituberculosis-drug resistance. N Engl J Med. 2016;375:1081–9.
3. Dheda K, Gumbo T, Gandhi NR, Murray M, Theron G, Udwadia Z, et al. Global control of tuberculosis: from extensively drug-resistant to untreatable tuberculosis. Lancet Respir Med. 2014;2:321–38.
4. Pietersen E, Peter J, Streicher E, Sirgel F, Rockwood N, Mastrapa B, et al. High frequency of resistance, lack of clinical benefit, and poor outcomes in capreomycin treated South African patients with extensively drug-resistant tuberculosis. PLoS One. 2015;10:e0123655.
5. Coll F, McNerney R, Preston M, Guerra-Assunção JA, Warry A, Hill-Cawthorn G, et al. Rapid determination of anti-tuberculosis drug resistance from whole-genome sequences. Genome Med. 2015;5:51.
6. Witney AA, Gould KA, Arnold A, Coleman D, Delgado R, Dhillon J, et al. Clinical application of whole-genome sequencing to inform treatment for multidrug-resistant tuberculosis cases. J Clin Microbiol. 2015;53:1473–83. 7. Zhang H, Li D, Zhao L, Fleming J, Lin N, Wang T, et al. Genome sequencing
of 161 Mycobacterium tuberculosis isolates from China identifies genes and intergenic regions associated with drug resistance. Nat Genet. 2013;45:1255–60.
8. Clark TG, Mallard K, Coll F, Preston M, Assefa S, Harris D, et al. Elucidating emergence and transmission of multidrug-resistant tuberculosis in treatment experienced patients by whole genome sequencing. PLoS One. 2013;8:e83012.
9. Farhat MR, Sultana R, Iartchouk O, Bozeman S, Galagan J, Sisk P, et al. Genetic determinants of drug resistance in mycobacterium tuberculosis and their diagnostic value. Am J Respir Crit Care Med. 2016. doi:10.1164/ rccm.201510-2091OC.
10. Phelan J, Coll F, McNerney R, Ascher DB, DE Pires V, Furnham N, et al. Mycobacterium tuberculosis whole genome sequencing and protein structure modelling provides insights into anti-tuberculosis drug resistance. BMC Med. 2016;14:31.
11. Brown AC, Bryant JM, Einer-Jensen K, Holdstock J, Houniet DT, Chan JZM, et al. Rapid Whole Genome Sequencing of M. tuberculosis directly from clinical samples. J Clin Microbiol. 2015. doi:10.1128/JCM.00486-15. 12. Cambau E, Viveiros M, Machado D, Raskine L, Ritter C, Tortoli E, et al.
Revisiting susceptibility testing in MDR-TB by a standardized quantitative phenotypic assessment in a European multicentre study. J Antimicrob Chemother. 2015;70:686–96.
13. Springer B, Lucke K, Calligaris-Maibach R, Ritter C, Bottger EC. Quantitative drug susceptibility testing of Mycobacterium tuberculosis by use of MGIT 960 and EpiCenter instrumentation. J Clin Microbiol. 2009;47:1773–80. 14. Larsen MH, Biermann K, Tandberg S, Hsu T, Jacobs WR, Larsen MH. Genetic
manipulation ofMycobacterium tuberculosis. Curr Protoc Microbiol. 2007;8:10A.2.1.
15. Benavente ED, Coll F, Furnham N, McNerney R, Glynn JR, Campino S, et al. PhyTB: Phylogenetic tree visualisation and sample positioning for M tuberculosis. BMC Bioinformatics. 2015;16:155.
16. Coll F, Preston M, Guerra-Assunção JA, Hill-Cawthorn G, Harris D, Perdigão J, et al. PolyTB: a genomic variation map for Mycobacterium tuberculosis. Tuberculosis (Edinb). 2014;94:346–54.
17. Li H. Toward better understanding of artifacts in variant calling from high-coverage samples. Bioinformatics. 2014;30:2843–51.
18. Li H. A statistical framework for SNP calling, mutation discovery, association mapping and population genetical parameter estimation from sequencing data. Bioinformatics. 2011;27:2987–93.
19. McKenna A, Hanna M, Banks E, Sivachenko A, Cibulskis K, Kernytsky A, et al. The Genome Analysis Toolkit: A MapReduce framework for analyzing next-generation DNA sequencing data. Genome Res. 2010;20:1297–303.
20. Preston MD, Campino S, Assefa SA, Echeverry DF, Ocholla H, Amambua-Ngwa A, et al. A barcode of organellar genome polymorphisms identifies the geographic origin of Plasmodium falciparum strains. Nat Commun. 2014. doi:10.1038/ ncomms5052.
21. Derrien T, Estellé J, Marco Sola S, Knowles DG, Raineri E, Guigó R, et al. Fast computation and applications of genome mappability. PLoS One. 2012;7:e30377.
22. Bradley P, Gordon NC, Walker TM, Dunn L, Heys S, Huang B, et al. Rapid antibiotic-resistance predictions from genome sequence data for Staphylococcus aureus and Mycobacterium tuberculosis. Nat Commun. 2015;6:10063.
23. Sievers F, Wilm A, Dineen D, Gibson TJ, Karplus K, Li W, et al. Fast, scalable generation of high-quality protein multiple sequence alignments using Clustal Omega. Mol Syst Biol. 2011;7:539.
24. Phelan JE, Coll F, Bergval I, Anthony RM, Warren R, Sampson SL, et al. Recombination in pe/ppe genes contributes to genetic variation in Mycobacterium tuberculosis lineages. BMC Genomics. 2015;17:151. 25. Moradigaravand D, Grandjean L, Martinez E, Li H, Zheng J, Coronel J, et al. dfrA
thyA Double deletion in para-aminosalicylic acid-resistant Mycobacterium tuberculosis Beijing strains. Antimicrob Agents Chemother. 2016;60:3864–7. 26. Price MN, Dehal PS, Arkin AP. FastTree: computing large minimum evolution
trees with profiles instead of a distance matrix. Mol Biol Evol. 2009;26:1641–50. 27. Tyler AD, Christianson S, Knox NC, Mabon P, Wolfe J, Van Domselaar G, et al.
Comparison of sample preparation methods used for the next-generation sequencing of Mycobacterium tuberculosis. PLoS One. 2016;11:e0148676. 28. Liu X, Han S, Wang Z, Gelernter J, Yang B-Z, Nielsen R, et al. Variant callers
for next-generation sequencing data: a comparison study. PLoS One. 2013;8:e75619.
29. WHO. WHO treatment guidelines for drug-resistant tuberculosis. 2016. http://www.who.int/tb/areas-of-work/drug-resistant-tb/treatment/resources/en/. Accessed 10 Oct 2016.
30. Domínguez J, Boettger EC, Cirillo D, Cobelens F, Eisenach KD, Gagneux S, et al. Clinical implications of molecular drug resistance testing for
Mycobacterium tuberculosis: a TBNET/RESIST-TB consensus statement. Int J Tuberc Lung Dis. 2016;20:24–42.
31. Papaventsis D, Casali N, Kontsevaya I, Drobniewski F, Cirillo DM, Nikolayevskyy V. Whole genome sequencing of M. tuberculosis for detection of drug resistance: a systematic review. Clin Microbiol Infect. 2016. doi:10.1016/j.cmi.2016.09.008.
• We accept pre-submission inquiries
• Our selector tool helps you to find the most relevant journal
• We provide round the clock customer support
• Convenient online submission
• Thorough peer review
• Inclusion in PubMed and all major indexing services
• Maximum visibility for your research
Submit your manuscript at www.biomedcentral.com/submit