437 437 437 437 437 Mem Inst Oswaldo Cruz, Rio de Janeiro, Vol. 92(4): 437-457, Jul./Aug. 1997
Markers, Cofactors and Staging Systems in the Study of HIV
Disease Progression: A Review
MC Portela/
+, KN Simpson
*Escola Nacional de Saúde Pública, Fundação Oswaldo Cruz, Av. Leopoldo Bulhões 1480 s/717, 21041-210 Rio de Janeiro, RJ, Brasil * University of North Carolina at Chapel Hill, CB# 7400, 1101
McGavran-Greenberg Bldg., Chapel Hill, NC 27599-7400, USA
This paper is aimed at providing a comprehensive review of markers, cofactors and staging systems used for HIV disease, focusing on some aspects that nowadays could even be considered historical, and advancing in current issues such as the prognostic value of viral load measurements, viral genotypic and phenotypic characterization, and new HIV disease treatment protocols. CD4+ cell values, com-bined with the new viral markers mentioned are promising as a parsimonious predictor set for defining both severity and progression. An adequate predictor of patient resource use for planning purposes still needs to be defined.
Key words:HIV disease progression - markers - cofactors - staging systems - AIDS classification systems
Prediction of risk, disease severity and costs of care are of concern to clinicians, researchers and policy makers involved in caring for, or paying for the care of patients with HIV disease. Many au-thors have reported on markers and cofactors that are predictive for morbidity and mortality of HIV-infected patients, but the literature is large and, in regard to some aspects, contradictory. Here we comprehensively review these findings, indicating variables that are consensually important or unim-portant for the prediction of HIV progression, vari-ables that seem important within specific risk-groups, and variables for which evidence is pre-carious to draw conclusions in relation to the role they actually play. We also review staging systems that have been proposed for classifying HIV-in-fected patients, providing comments concerning other nonstaging-oriented classification systems. Trends are observed in the sense of combining labo-ratory markers and/or important clinical conditions in survival-based indices, and the search for dif-ferentiation in the disease severity among patients with advanced disease, usually treated as a unique group in the past. In addition, we focus on some findings regarding the ability of these indices to estimate health resource utilization. This paper is aimed at summarizing relevant information for those concerned with modeling HIV disease pro-gression and those concerned with the estimation of resource use for treating HIV-infected patients.
Three major sections are presented: in the first we compare findings in the literature concerning markers and cofactors of HIV disease progression; in the second we focus on staging systems; and, in the third we provide a brief discussion of the ma-terial presented.
MARKERS AND COFACTORS
Markers of HIV disease are variables that track the disease progression, while cofactors are vari-ables that affect the disease progression (Saah et al. 1992, Brookmeyer & Gail 1994). In this sec-tion, markers and cofactors, evaluated in regard to their power of predicting the HIV disease progres-sion, are presented. The idea is not to be exhaus-tive in the sense of covering all variables already studied in the literature, but to highlight those more widely considered, pointing out their strengths and weaknesses.
The studies reviewed here include cases in which markers are just used to track the HIV dis-ease natural history, cases in which markers are employed as surrogate endpoints in the evaluation of treatment for HIV disease, as well as cases in which markers and cofactors are analyzed as prog-nostic factors for the clinical management of pa-tients. Regarding outcomes of interest in evaluat-ing the HIV disease progression, they contemplate the development of AIDS and other HIV-associ-ated conditions, survival, and CD4+ T lymphocyte depletion. Furthermore, the studies reviewed in this section allow for consideration of the use of mark-ers and cofactors of HIV disease progression among different groups of HIV-infected patients. Results reported in 34 papers published from 1987 to 1994, regarding the relationship between +Corresponding author. Fax: +55-21-290-0993
438 438 438 438
438 Markers, Cofactors and Staging Systems of HIV Disease • MC Portela, KN Simpson
some selected markers and cofactors, and HIV dis-ease progression are summarized in Table I. Through the text, however, we complement Table I with other findings concerning the prognostic role played by the markers and cofactors listed and some others not listed. Especially, we underline the significant contribution to the prediction of HIV disease progression allowed by viral load measure-ments and phenotypic and genotypic characteriza-tion of emerging viral strains, made available only more recently.
Findings of most studies included in Table I result from survival analyses (Lee 1992). More specifically, the utilization of the Kaplan-Meier method to evaluate the individual predictive power of variables, and the utilization of the Cox-propor-tional hazards model to evaluate the independent predictive power of different variables combined, are almost standard approaches. Exceptions are the use of time-dependent covariate methods to evalu-ate potential AIDS markers (Goedert et al. 1989), the use of a multivariate conditional logistic re-gression to predict subsequent AIDS (Polk et al. 1987), and the use of autoregressive models to pre-dict CD4+ T lymphocyte depletion (Muñoz et al. 1988, Alcabes et al. 1993). For studies in which multivariate analysis was performed, the statisti-cally significant associations in Table I correspond to variables found to have independent power in predicting HIV disease progression. Studies in which only univariate analyses were employed are indicated.
The markers of HIV disease progression are aggregated in three general classes: immunologi-cal, viral, and clinical (Goedert 1990). This classi-fication is used as a framework to divide this sec-tion, that still includes a fourth part addressing cofactors.
Immunological Markers
The immunological markers of HIV disease include cellular concentration and immune-activa-tion measures. Here we summarize findings con-cerning the role played by CD4+ T-lymphocyte measures, CD8+ T-lymphocyte measures, total lymphocyte count, other cellular measures, anergy, and immune-activation measures.
CD4+ T-lymphocytes - Among the immuno-logical markers of HIV disease progression, the level of “helper T-lymphocytes” or “CD4+ T-lym-phocytes”, cells that play a central role in both humoral and cell mediated immune defenses, is the strongest and the most recognized. CD4+ T-lym-phocytes are destroyed as a result of HIV infec-tion, and, among HIV-infected patients, lower lev-els of those cells are generally indicative of more serious immunodeficiency and, consequently, more
advanced disease. Table I suggests not only the high frequency in which measures of CD4+ T-lympho-cytes have been used as explanatory variables of HIV disease progression, but also the utilization of such measures as the indicators of HIV disease development themselves. Furthermore, it is mean-ingful to observe the consistency of CD4+ cell depletion power in predicting the evolution of HIV disease.
The Centers for Disease Control (CDC) (At-lanta, USA) has revised the classification system for HIV infection to emphasize the clinical impor-tance of CD4+ T-lymphocytes in the categoriza-tion of HIV-related clinical condicategoriza-tions. Since 1993, people with less than 200 CD4+ T-lymphocytes/ mm3 of blood, or a CD4+ T lymphocyte percent-age of total lymphocytes of less than 14, have been included in the AIDS surveillance case definition (CDC 1992a). Most studies concerned with the development of AIDS do not incorporate these cri-teria as AIDS-defining, but they indicate strong association between low levels of CD4+ T-lym-phocytes and the onset of the AIDS-defining op-portunistic diseases contemplated in previous docu-ments from CDC (1986, 1987).
439 439439 439439 Mem Inst Oswaldo Cruz, Rio de Janeiro, Vol. 92(4), Jul./Aug. 1997
12345 12345 12345 12345 12345 12345 12345 12345 12345 12345 12345 12345 12345 12345 12345 12345 12345 12345 12345 12345 12345 12345 12345 12345 12345 12345 12345 12345 12345 12345 12345 12345 12345 12345 12345 12345 12345 12345 12345 12345 12345 12345 12345 12345 12345 12345 12345 12345 12345 12345 12345 12345 12345 12345 12345 12345 12345 12345 12345 12345 12345 12345 12345 12345 12345 12345 12345 12345 12345 12345 12345 12345 12345 12345 12345 12345 12345 12345 12345 12345 12345 12345 12345 12345 12345 12345 12345 12345 12345 12345 12345 12345 12345 12345 12345 12345 1234 1234 1234 1234 1234 1234 1234 1234 1234 1234 1234 1234 1234 1234 1234 1234 1234 1234 1234 1234 1234 1234 1234 1234 1234 1234 1234 1234 1234 1234 1234 1234 1234 1234 1234 1234 1234 1234 1234 1234 1234 1234 1234 1234 1234 1234 1234 1234 1234 1234 1234 1234 1234 1234 1234 1234 1234 1234 1234 1234 1234 1234 1234 1234 1234 1234 1234 1234 1234 1234 1234 1234 1234 1234 1234 1234 1234 1234 1234 1234 1234 1234 1234 1234 1234 1234 1234 1234 1234 1234 1234 1234 1234 1234 1234 1234 TABLE I
Some selected markers and cofactors evaluated as predictors of the HIV disease progression
Markers/Cofactors Studies
1 2a 3 4 5 6 7 8 9a 10 11a12 13 14 15 16 17a18 Immunological markers
Anergy Y
CD4+ T Lymphocytes
Count ↓ Y Y Y Y Y Y Y Y Y Y Y N Y
Percent ↓ Y Y Y Y Y Y
Rate of Decline ↑ Y Y
CD4+:CD8+ Ratio ↓ N Y Y Y N
CD8+ T Lymphocyte -Count or Percent ↑ N Y N Y W N N Y N Y
Erythrocyte -Count or Percent ↓ N
Hemoglobin ↓ N N Y Y
Leukocyte Count ↓ N
Lymphocyte Count ↓ N Y
Packed Cell Volume ↓ Y
Platelet Count ↓ N N Y Y
Immunoglobulin A (IgA) ↑ N N Y Y Y Y
Immunoglobulin G (IgG) ↑ N N N N
Immunoglobulin M (IgM) ↑ N N N
β2-Microglobulin ↑ Y Y Y Y Y
Neopterin ↑ Y Y Y
Soluble Interleukin-2 Receptors ↑ Y N
Viral markers
HIV Antibodies ↓ N Y Y
p24 Antibodies ↓ N Y Y
HIV Antigenemia Y
p24 Core Antigenemia Y N Y
Clinical markers AIDS Diagnosis Bacterial Infections
Constitutional Symptomsb (≥ 2) Nc Nc Wc
Lymphadenopathy N N N N N
Oral Candidiasis Y
Cofactors
Age ↑ N N N N N N N Y
Cytomegalovirus N Y Y N
Medical Therapy (Non-use vs. use)
HOMOSEXUAL MEN: BLOOD TRANSFUSION RECIPIENTS:
1. Goedert et al. (1987) 9. Pedersen et al. (1989) 17. Ward et al. (1989) 2. Kaplan et al. (1987) 10. Anderson et al. (1990) 18. Blaxhult et al. (1990) 3. Polk et al. (1987) 11. Taylor et al. (1989)
4. Moss et al. (1988) 12. Fahey et al. (1990) 5. MacDonell et al. (1988) 13. Hofmann et al. (1990) 6. Muñoz et al. (1988) 14. Burcham et al. (1991) 7. Melmed et al. (1989) 15. Osmond et al. (1991) 8. Hessol et al. (1989) 16. Saah et al. (1992)
OUTCOME:
AIDS CD4+ Depletion HIV-related Death AIDS and other HIV-associated Conditions
(Y) Statistically significant assosciation (N) Not statistically significant association (W) “Weaker” association in univariate analysis; the variable was not studied in multivariate model.
Borders aggregate cases in which variables were reported to be interchangeable in predicting HIV disease progression, given their strong correlation.
a: these studies do not evaluate the independent predictive power of the variables in a multivariate analysis; b: constitutional symptoms include fatigue, persistent diarrhea, persistent fever, night sweats, and unintentional weight loss; c: oral candidiasis was included in the list of symptoms considered.
440 440 440 440
440 Markers, Cofactors and Staging Systems of HIV Disease • MC Portela, KN Simpson
12345 12345 12345 12345 12345 12345 12345 12345 12345 12345 12345 12345 12345 12345 12345 12345 12345 12345 12345 12345 12345 12345 12345 12345 12345 12345 12345 12345 12345 12345 12345 12345 12345 12345 12345 12345 12345 12345 12345 12345 12345 12345 12345 12345 12345 12345 12345 12345 12345 12345 12345 12345 12345 12345 12345 12345 12345 12345 12345 12345 12345 12345 12345 12345 12345 12345 12345 12345 12345 12345 12345 12345 12345 12345 12345 12345 12345 12345 12345 12345 12345 12345 12345 12345 12345 12345 12345 12345 12345 12345 12345 12345 12345 12345 12345 12345 12345 12345678 12345678 12345678 12345678 12345678 12345678 12345678 12345678 12345678 12345678 12345678 12345678 12345678 12345678 12345678 12345678 12345678 12345678 12345678 12345678 12345678 12345678 12345678 12345678 12345678 12345678 12345678 12345678 12345678 12345678 12345678 12345678 12345678 12345678 12345678 12345678 12345678 12345678 12345678 12345678 12345678 12345678 12345678 12345678 12345678 12345678 12345678 12345678 12345678 12345678 12345678 12345678 12345678 12345678 12345678 12345678 12345678 12345678 12345678 12345678 12345678 12345678 12345678 12345678 12345678 12345678 12345678 12345678 12345678 12345678 12345678 123 123 123 123 123 123 123 123 123 123 123 123 123 123 123 123 123 123 123 123 123 123 123 123 123 123 123 123 123 123 123 123 123 123 123 123 123 123 123 123 123 123 123 123 123 123 123 123 123 123 123 123 123 123 123 123 123 123 123 123 123 123 123 123 123 123 123 123 123 123 123 123 123 123 123 123 123 123 123 123 123 123 123 123 123 123 123 123 123 123 123 123 123 123 123 123 123 123 123 123 123 123 123 123 123 123 123 123 123 123 123 123 123 123 123 123 123 123 123 123 123 123 123 123 123 123 123 123 123 123 123 123 123 123 123 123 123 123 123 123 123 123
cont. TABLE I
Some selected markers and cofactors evaluated as predictors of the HIV disease progression
Markers/Cofactors Studies
19a20a21a22a23 24a25a26 27 28 29 30 31 32 33 34
Immunological markers
Anergy N
CD4+ T Lymphocytes
Count ↓ Y Y Y Y Y Y Y Y Y Y Y
Percent ↓ N Y Y Y N
Rate of Decline ↑ Y N Y
CD4+:CD8+ Ratio ↓ N Y
CD8+ T Lymphocyte -Count or Percent ↑ N N N
Erythrocyte -Count or Percent ↓ Y
Hemoglobin ↓ N
Leukocyte Count ↓ N N N
Lymphocyte Count ↓ Y N
Packed Cell Volume ↓
Platelet Count ↓ N N N
Immunoglobulin A (IgA) ↑ N N
Immunoglobulin G (IgG) ↑ N
Immunoglobulin M (IgM) ↑ N
β2-Microglobulin ↑ N N N N N Y
Neopterin ↑ Y Y N
Soluble Interleukin-2 Receptors ↑ Viral markers
HIV Antibodies ↓ N
p24 Antibodies ↓ Y N N
HIV Antigenemia
p24 Core Antigenemia Y Y N N N N
Clinical markers
AIDS Diagnosis Y
Bacterial Infections N Y Y
Constitutional b (≥ 2) Nc Yc N Y
Lymphadenopathy N
Oral Candidiasis Y N Y
Cofactors
Age ↑ Y Y Y N N N N N
Cytomegalovirus Y N
Medical Therapy (Non-use vs. use) Y Y N Y Y
HEMOPHILIACS: INTRAVENOUS DRUG USERS: GENERAL HIV POPULATION: 19. Goedert, Kessler, Aledort, et al. (1989) 23. Fernández-Cruz et al. (1990) 30. Jacobson et al. (1991) 20. Phillips et al. (1991) 24. Zangerle et al. (1991) 31. Rabeneck et al. (1993) 21. Lee et al. (1991) 25. Margolick et al. (1992) 32. Blatt et al. (1993) 22. Phillips et al. (1992a) 26. Muñoz et al. (1992) 33. De Gruttola et al. (1993)
27. Selwyn et al. (1992) 34. Colford et al. (1994) 28. Alcabes et al. (1993)
29. Alcabes et al. (1994) OUTCOME:
AIDS CD4+ Depletion HIV-related Death AIDS and other HIV-associated Conditions
(Y) Statistically significant assosciation (N) Not statistically significant association (W) “Weaker” association in univariate analysis; the variable was not studied in multivariate model.
Borders aggregate cases in which variables were reported to be interchangeable in predicting HIV disease progression, given their strong correlation.
a: these studies do not evaluate the independent predictive power of the variables in a multivariate analysis; b: constitutional symptoms include fatigue, persistent diarrhea, persistent fever, night sweats, and unintentional weight loss; c: oral candidiasis was included in the list of symptoms considered.
441 441441 441441 Mem Inst Oswaldo Cruz, Rio de Janeiro, Vol. 92(4), Jul./Aug. 1997
intravenous drug users, specifically, suggested that the elevated risk encountered at CD4+ lymphocyte number lower than 200/mm3 was entirely due to the high risk at less than 150 CD4+ cells/mm3 (Alcabes et al. 1994). In addition, it is of interest the fact that two studies found no other laboratory variables to be independently predictive of AIDS after controlling for CD4+ counts (Fernández-Cruz et al. 1990, Alcabes et al. 1994).
In a study not included in Table I, Farizo et al. (1992) not only pointed out that the risk of occur-rence of an AIDS-defining disease was higher among patients with less than 200 CD4+ cells/mm3, but also that it increased progressively with lower CD4+ count levels.
It has been suggested that a low CD4+ T lym-phocyte count may be a necessary and sufficient condition for the development of AIDS, and that, compared, duration of HIV infection is less rel-evant (Phillips et al. 1991). Relying on that indi-cation, a Kaplan-Meier estimation of the increas-ing risk of various AIDS-definincreas-ing conditions, based on decreasing CD4+ count, was proposed. The risk of occurrence of an AIDS-defining condition be-fore the CD4+ count’s reaching 200 cells/mm3 was shown to be low. In a cohort of hemophiliacs, it was estimated to be 21% by the time the CD4+ count falls to 100 cell/mm3, and to reach 50% only by the time CD4+ count falls to 28 cells/mm3 (Phillips et al. 1992b).
Regarding the ability of CD4+ T-lymphocytes in predicting specific opportunistic diseases, a study suggested that pneumocystis pneumonia, cytomegalovirus pneumonia, and pulmonary infec-tion caused by Cryptococcus neoformans and My-cobacterium avium-intracellulare were unlikely to occur in patients who had had a CD4+ count above 200 to 250 cells/mm3 or a CD4+ percentage above 20% to 25% in the 60 days before pulmonary evalu-ation. In contrast, HIV-infected patients with CD4+ count below 100 cells/mm3, or CD4+ percentage less than 10%, were shown to be clearly suscep-tible to the mentioned diseases (Masur et al. 1989). Another study, however, indicated that CD4+ count was of very limited predictive value for the pres-ence of opportunistic infections in HIV-infected patients with pulmonary symptoms (Orholm et al. 1990).
The idea that CD4+ T-lymphocyte numbers are predictive of AIDS-defining illnesses was again strengthened by the observation of significant dif-ferences in CD4+ levels associated with such ill-nesses, oral candidiasis, and asymptomatic infec-tion (Crowe et al. 1991). In that study, five general groups of HIV-related conditions were suggested, based on mean CD4+ count: (1) asymptomatic in-fection, CD4+ > 500 cells/mm3; (2) oral
candidi-asis and tuberculosis, CD4+ range 250-500 cells/ mm3; (3) Kaposi’s sarcoma, lymphoma, and cryptosporidiosis, CD4+ range 150-200 cells/mm3; (4) Pneumocystis carinii pneumonitis, M. avium
complex, herpes simplex ulceration, toxoplasmo-sis, cryptococcotoxoplasmo-sis, and esophageal candidiatoxoplasmo-sis, CD4+ range 75-125 cells/mm3; and (5) cytomega-lovirus retinitis, CD4+ < 50 cells/mm3.
The usefulness of CD4+ T-lymphocytes in pre-dicting still more advanced HIV-disease was shown in studies that analyzed death as outcome of inter-est (Yarchoan et al. 1991, Phillips et al. 1992a, DeGruttola et al. 1993, Colford et al. 1994).
Nearly all deaths in a cohort of patients with AIDS or AIDS-related complex, participating in long-term zidovudine based antiretroviral proto-cols, occurred among those with fewer than 50 CD4+ cells/mm3, and, for the patients who died and whose cases were assessable, the geometric mean of the last three CD4+ counts obtained be-fore death was 7.7 cells/mm3. The median survival of patients after their CD4+ count had fallen be-low 50 cell/mm3 was 12.1 months. In addition, there was indication that the drop in CD4+ cell below that level preceded the terminal opportunis-tic infection or tumor (Yarchoan et al. 1991).
The very low risk of HIV-related death for pa-tients with more than 50 CD4+ cells/mm3 was sug-gested by other studies (Phillips et al. 1992a, DeGruttola et al. 1993). Specially, DeGruttola et al. (1993) found in their research that the risk of death increased sharply when the CD4+ lympho-cyte counts fell below 50 cell/mm3, and that no other feature of the CD4+ lymphocyte trajectory added significantly in predicting a short-term risk of death. They concluded that two patients with the same current CD4+ lymphocyte count would have the same hazard of death, regardless of their CD4+ lymphocyte history.
How-442 442 442 442
442 Markers, Cofactors and Staging Systems of HIV Disease • MC Portela, KN Simpson
ever, a major discussion regarding the high vari-ability in CD4+ count measurement, caused by in-tra-individual fluctuation and technical measure-ment error (Hoover et al. 1992), has made some authors opt for using the CD4+ percentage (Saah et al. 1992), or suggest alternatives such as the use of confirmatory retesting of CD4+ cell count (Hoover et al. 1992), the use of two consecutive count mean, or other summary statistics (Dawson & Lagakos 1991), or the development of persis-tence criteria (Longini et al. 1991, 1993). Turner et al. (1994a) have proposed five strategies for dealing with CD4+ count’s variability in the clini-cal setting: (i) to draw the CD4+ count at a similar time of day; (ii) to follow the CD4+ percentage in addition to the CD4+ count; (iii) to pay meticulous attention to measurement technique; (iv) to per-form the test when a factor has been eliminated or diminished in its effect; and (v) to use information from more than one CD4+ assay.
As to the rate of CD4+ T-lymphocyte decline, evidence has been controversial in relation to whether it has independent predictive power once the level (count and/or percentage) of CD4+ cell itself is controlled. In Table I, CD4+ rate of de-cline is indicated to add significant prognostic value to CD4+ percentage, in the prediction of the onset of AIDS, by Burcham et al. (1991), and Saah et al. (1992). A contradictory result, however, is pointed out by Selwyn et al. (1992). DeGruttola et al. (1993) pointed out that, given the most current CD4+ lymphocyte level, the history of the CD4+ lympho-cyte count does not affect the short-term probabil-ity of death, but may affect the long-term survival.
CD8+ T-lymphocytes - Another cellular ele-ment of interest in the HIV disease is the “sup-pressor T-lymphocyte” or “CD8+ T-lymphocyte”. CD8+ T cells can play two roles of immune de-fense given the HIV virus presence: suppressing the cell mediated response to limit damage to host tissue, and attacking cells infected with virus di-rectly (Brookmeyer & Gail 1994). CD8+ counts were described to rise dramatically at seroconversion, to keep rising very slowly in the asymptomatic period of HIV disease, and to begin falling approximately six months before AIDS di-agnosis (Lang et al. 1989).
The use of CD8+ count or percentage as a marker of HIV disease has been evaluated and not consistently supported by the literature. A high CD8+ count was indicated to be a significant pre-dictor of steeper decline of CD4+ counts (Muñoz et al. 1988). In the prediction of AIDS, however, Table I shows that some studies have suggested the prognostic value of CD8+ measures, while oth-ers have not. Finally, in the prediction of death, the only study reviewed that accounted for CD8+
cell level found that it was not a significant ex-planatory variable.
Taking into consideration the studies that pointed out some association of CD8+ T-lympho-cytes and the development of AIDS, some com-ments are interesting. While Polk et al. (1987) found that an elevated CD8+ count was predictive of AIDS 10 to 18 months before the diagnosis, Goedert et al. (1989) found some association of CD8+ count and the onset of AIDS only less than two months before the diagnosis. In the second case, the association was negative, instead of posi-tive, and was not reported in Table I. Hofmann et al. (1990) found that CD8+ count added signifi-cant, but inferior predictive power, to CD4+ count and β2-microglobulin, in forecasting the develop-ment of AIDS within three years, and finished emphasizing only the utilization of the last two variables. Furthermore, Saah et al. (1992) found the significant association of high percentage of CD8+ lymphocytes with the risk of AIDS only af-ter stratifying their analysis on percentage and rate of decline in circulating CD4+ lymphocytes. In previous analysis developed in the same study, CD8+ was not indicated to contribute significantly to the prediction of AIDS.
Total lymphocyte count - Total lymphocyte count has not been shown to invariably have inde-pendent power in the prediction of HIV disease progression (Moss et al. 1988, Colford et al. 1994), after controlling for other variables. However, its ability in strongly predicting significant immuno-suppression, as measured by a CD4+ count less than 200 cell/mm3, or a CD4+ percentage less than 16% has made it of special interest (Blatt et al. 1993). The World Health Organization (WHO), for ex-ample, in defining its staging system for HIV dis-ease, has proposed the utilization of total lympho-cyte count as an appropriate substitute for CD4+ count or CD4+ percentage in the absence of CD4+ lymphocyte count determination (Montaner et al. 1992, WHO 1993).
statis-443 443443 443443 Mem Inst Oswaldo Cruz, Rio de Janeiro, Vol. 92(4), Jul./Aug. 1997
tically significant association of the numbers of leukocytes or monocytes with the outcomes of in-terest was indicated by the studies reviewed (Muñoz et al. 1988, Moss et al. 1988, Selwyn et al. 1992, Alcabes et al. 1994, Colford et al. 1994). Finally, packed cell volume was indicated to have independent prognostic value in the development of AIDS, but was considered in only one study (Moss et al. 1988).
Anergy - Anergy, defined as the lack of cutane-ous response to some specific antigens, has also been analyzed as a marker of HIV disease (MacDonell et al. 1988, Fernández-Cruz et al. 1990). It was used as a criterium in the Walter Reed staging system, one of the first proposed for classifyng the HIV-infected patients. According to that system, anergy is evaluated in terms of intact cutaneous response to at least two of the following four antigens: tetanus, trichophyton, mumps, and candida (Redfield et al. 1986).
MacDonell et al. (1988) developed a study to evaluate the Walter Reed staging classification, and, taking into account three of the four antigens mentioned above (tetanus was not used), they ana-lyzed the prognostic value of anergy in predicting the onset of AIDS. Their results indicated a statis-tically significant association between skin test anergy and the development of AIDS among indi-viduals with less than 300 CD4+ cells/mm3, con-trolling for CD4+ count, and the presence of lym-phadenopathy. In contrast, Fernández-Cruz et al. (1990) found that anergy, despite being a predic-tor of AIDS in univariate analysis, did not add sig-nificant predictive power to CD4+ count in stepwise multivariate analysis. Another study suggested that complete anergy is an effective marker of severe immune dysfunction, but it may not be practical in many settings, given that patients have to return within 48 hr for evaluation (Royce et al. 1991).
Immune-activation measures - The levels of IgA, IgG, and IgM serum immunoglobulins, struc-turally distinct classes of antibodies produced in lymph tissue, in response to the invasion of a for-eign substance, are some of the measures of im-mune-activation that have been studied in the search for markers of HIV disease. As can be seen in Table I, the literature suggests that IgG and IgM are not independent predictors of HIV disease pro-gression (Polk et al. 1987, Muñoz et al. 1988, Pedersen et al. 1989, Fernández-Cruz et al. 1990, Saah et al. 1992). Less obvious is the consider-ation of the prognostic value of the IgA.
All studies reviewed indicated that an elevated level of serum IgA, alone, was a significant predic-tor of the development of more advanced HIV dis-ease, but most pointed out that it was not able to add significant predictive power in multivariate
analy-sis (Polk et al. 1987, Moss et al. 1988, Fernández-Cruz et al. 1990, Muñoz et al. 1992). Specially, IgA serum level was found to have independent prog-nostic value for the onset of AIDS, but to add little predictive power beyond the level of CD4+ T-lym-phocytes (measured in terms of absolute number, percentage, or CD4+:CD8+ ratio), combined with the serum level of neopterin or β2-microglobulin (Fahey et al. 1990). An independent contribution of IgA in the prediction of AIDS was also reported by Saah et al. (1992). Moreover, it was indicated to be strongly associated with a steeper decline of CD4+ counts (Muñoz et al. 1988).
Other two immune-activation measures consid-ered for evaluation of HIV disease progression, that seem to be of especial importance, are the levels of β2-microglobulin and neopterin. Elevated β2 -microglobulin reflects stimulation of lymphoid cells and increased cell turnover. Neopterin, in turn, is a product of stimulated macrophages (Lifson et al. 1992). Changes in β2-microglobulin and neopterin levels have been indicated to be corre-lated (Fahey et al. 1990, Burcham et al. 1991), and consideration of either one or the other has consis-tently been found to add significant prognostic value for the development of AIDS, after control-ling for CD4+ cell level, in studies among homo-sexual and bihomo-sexual men (Moss et al. 1988, Melmed et al. 1989, Anderson et al. 1990, Fahey et al. 1990, Burcham et al. 1991). In addition, comparable find-ing was pointed out by a study developed among general HIV-infected patients with AIDS and AIDS-related complex using zidovudine, in which
β2-microglobulin added prognostic value to CD4+ count for predicting survival (Jacobson et al. 1991). Among intravenous drug users, however, re-sults seem less consistent, what may be attribut-able to prevalent immune stimulation due to in-jecting behavior. β2-microglobulin has been shown to have no significant independent power in pre-dicting the development of AIDS (Fernández-Cruz et al. 1990, Zangerle et al. 1991, Selwyn et al. 1992, Muñoz et al. 1992, Alcabes et al. 1994). In con-trast, neopterin level has still been indicated as an independent predictor, adding significant prognos-tic value to the absolute number of CD4+ T-lym-phocytes, and the number of constitutional symp-toms (Zangerle et al. 1991, Muñoz et al. 1992).
444 444 444 444
444 Markers, Cofactors and Staging Systems of HIV Disease • MC Portela, KN Simpson
Viral Markers
HIV-virus is constituted of antigenic glycopro-teins (e.g., gp41, gp120, gp160) and proglycopro-teins (e.g., p24, p55, p17, p66, p51, p31) that induce the pro-duction of host antibodies. It is based on the con-firmation of the presence of at least two of gp41, p24 and either gp120 or gp160, that a definitive serologic diagnosis of HIV-infection is made (Brookmeyer & Gail 1994). Here, we first con-sider the contribution of HIV antibodies or HIV antigenemia to the disease prognosis. Then, we focus on the powerful role that viral load measure-ments and the phenotypic and genotypic charac-terization of viral strains have more recently shown to play in predicting disease progression.
HIV antibodies and HIV antigenemia - Among the reviewed studies that evaluated the contribu-tion of HIV antibodies or HIV antigenemia to the disease prognosis, some did not specify the related glycoproteins or proteins taken into account, while the others explicitly focused on examining the role played by p24 antigen or p24 antibody, two corre-lated variables. In the typical course of HIV dis-ease, p24 antigen was described to appear in the blood within a week or two of infection, and be followed in about 6 to 10 weeks by the appearance of host antibodies. After years, with CD4+ cell depletion and, often in anticipation of advancing illness, p24 antibody was described to decline, and p24 antigen to reappear (Brookmeyer & Gail 1994). Specifically analyzing the p24 core protein antigenemia or antibody level, or not, studies have provided evidence regarding the association of the presence of HIV antigenemia or decline of HIV antibodies and the development of AIDS, even after controlling for CD4+ count or percentage. It is worthwhile, however, to observe that all studies that provided such evidence were developed among either homosexual and bisexual men, or hemophili-acs (Polk et al. 1987, Moss et al. 1988, Osmond et al. 1991, Lee et al. 1991). Among intravenous drug users, consideration of p24 antigenemia or p24 antibodies have not been demonstrated to add in-formation to CD4+ level (Fernández-Cruz et al. 1990, Selwyn et al. 1992, Alcabes et al. 1994).
A study of asymptomatic HIV-infected indi-viduals with less than 200 CD4+ cells/mm3 indi-cated that the presence of syncytium-inducing (SI) HIV variants, p24 antigen, and a low T cell re-sponse after stimulation with phytohaemaggluti-nin (PHA) were independent predictors of progres-sion to AIDS (Keet et al. 1994).
Concerning the prediction of a steeper decline of CD4+ counts, Table I indicates that a low level of HIV antibody has significant independent value (Muñoz et al. 1988). Moreover, neither p24
anti-gen nor p24 antibody is shown to be predictive of survival among patients with AIDS and AIDS-re-lated complex (Jacobson et al. 1991).
Viral load - Direct measurement of the levels of HIV replication has been recognized as one of the better predictors of disease progression in the last two years. Some commercially available as-says for HIV-1 nucleic acid measurements were assessed for sensitivity by 1995. The Roche PCR, a polymerase chain reaction assay, and the Chiron b-DNA, a branched chain assay, were found to be able to detect a five fold change in RNA copy num-ber with a probability of 0.90. Intra-assay stan-dard deviation was below 0.15 log10 copies/ml (Yen-Lieberman et al. 1995). The nucleic acid se-quence-based amplification assay (NASBA) was found to show a variation of quantitative results within 0.5 log10, and a dynamic range of five or-ders of magnitude. Moreover, the Amplicor method was associated with a sensitivity of 200 RNA cop-ies/ml, and a dynamic range of about 4 logs (Harrigan 1995). It is important to underline that the standardization of the commercial approaches has reduced lab-to-lab variability, and have allowed a large number of HIV RNA assessments per day. However, because absolute nucleic acid levels re-ported can vary among the assays, direct compari-sons must be made only using a single test (Harrigan 1995).
The use of RNA assays assumes that relative change is more important than absolute numbers based on evidence that the calculated half-life of HIV is short, averaging less than two days, and that it is not dependent on baseline virus burden or stage disease. Thus a decrease in plasma or pe-ripheral blood mononuclear cells (PBMCs) vire-mia signals that the virus is being cleared more rapidly that its developing, indicating remission. This interpretation is supported by the fact that CD4+ cell counts in peripheral blood usually crease as the viremia abates. Conversely, an in-crease in viremia signals that virus replication is no longer inhibited, and, predictably, increased viral load is a leading indicator of CD4+ count de-crease.
445 445445 445445 Mem Inst Oswaldo Cruz, Rio de Janeiro, Vol. 92(4), Jul./Aug. 1997
prognostic value of PBMCs viral load measure-ments, assumed to be an important information for the evaluation of immune based therapy, Ferre et al. (1995) still pointed out their independent con-tribution for predicting disease progression, even adjusting for levels of CD4+ counts. In another study, RNA-PCR (Roche) absolute levels greater than 17,000 copies/ml (4.2 log10 copies/ml) and p24 antigen greater than 20 pg/ml, the threshold of positivity, were each found to be predictive of subsequent CD4+ cell decline in vertically infected children (Zaknum et al. 1995). Welles et al. (1995), in a retrospective analysis of plasma RNA from 171 patients without prior zidovudine (AZT) therapy, found that one log10 increase in RNA copy number at baseline significantly increased the harzard of clinical progression [relative harzard: 1.75; 95% confidence interval: (0.94, 3.24)] inde-pendent of other prognostic factors such as CD4+ count and SI phenotype.
Viral load measures have been extensively used as an important marker of HIV disease in clinical trials, what is partially justified by the belief that the primary end point of any antiviral drug study should be the effect of the drug on the virus itself (Lange 1995a). But it also can be justified empiri-cally by findings showing that RNA load could predict 90% of the effect of treatment on disease, whereas CD4+ cell counts predicted only 37% of the effect (Merigan 1995).
Recent advances in the treatment of HIV dis-ease, achieved by the combination of drugs (ini-tially, two; after, three or even more) have been indicated by comparisons of the magnitude and sustainability of viral load reductions inducted by different treatment alternatives. An example is the assessment of AZT monotherapy compared with combinations of AZT/didanosine (ddI), AZT/ zalcitabine (ddC), and AZT/lamivudine (3TC) among antiretroviral naive patients. For patients treated with AZT/ddI and AZT/ddC, reductions in serum HIV-1 RNA levels were significantly greater (80-90%) than for those treated with AZT monotherapy (50%). The more marked and sus-tained superiority of the combination regimen over monotherapy was, however, shown by the AZT/ 3TC therapy (>1.8 log RNA copies/ml vs. 0.7 log RNA copies/ml after four weeks) (Harrigan 1995). Another example is the study of AZT/ddC, AZT/ saquinavir, and AZT/ddC/saquinavir therapies, that indicates the superiority of the triple regimen, fol-lowed by the AZT/ddC combination if the main concern is the reduction in viral load, or by the AZT/saquivavir combination if durability of treat-ment response is more important (Lange 1995b).
The evidence to date thus suggests that viral load measures are useful leading indicators.
Ab-solute values greater than 4.2 log10 copies/ml are predictive of clinical progression unless this mea-sure is decreasing by more than the intratest vari-ability (0.15 log10 copies/ml) over a 2 to 3 day period. Conversely, even very low absolute values do not indicate low risk of progression if the viral load is increasing.
Phenotypic and genotypic characterization of viral strains - Detection of phenotypic and geno-typic alterations of the virus, such as the appear-ance of resistappear-ance mutations or the conversion from non-syncytium-inducing to syncytium-inducing phenotype, is expected to add information to CD4+ counts and viral load in the prediction of HIV dis-ease progression. The use of these markers together has been indicated to be promising for supporting individualized therapy approaches aimed at gain-ing maximal benefit from one treatment regimen before moving to another, preventing destruction of the immune system, and, ultimately, prolonging the well-being and survival of patients with HIV infection (Merigan 1995).
Clinical Markers
The last class of markers, widely considered in the literature, include some clinical conditions typi-cal over the HIV-infection course, and of interest for the prognosis of disease progression. Here, we examine findings regarding the predictive power of the occurrence of lymphadenopathy, constitu-tional symptoms, oral candidiasis, and bacterial infections for the development of AIDS and for the depletion of CD4+ T-lymphocytes. In addition, the AIDS diagnosis is of concern in a study that analyzes predictors of survival.
Lymphadenopathy - Persistent generalized lym-phadenopathy has been extensively used in clas-sification systems of HIV disease, and the impor-tance given to this clinical manifestation probably is reflected in one of the original names of the hu-man immunodeficiency virus: huhu-man T-lymphotropic virus type III or lymphadenopathy-associated virus (Barré-Sinoussi et al. 1983, CDC 1986, 1992a, Redfield et al. 1986, WHO 1993). Despite that, evidence has been consistently pro-vided in the sense that the lymphadenopathy has no prognostic value for HIV disease progression.
symp-446 446 446 446
446 Markers, Cofactors and Staging Systems of HIV Disease • MC Portela, KN Simpson
toms. The cases in which oral candidiasis was treated as one of the symptoms are indicated.
In Table I a row was included to account for the observation of any constitutional symptom sig-nificant effect on the HIV disease prognosis. In general, the results reported are not relevant in the sense of suggesting some consistent trend. Goedert et al. (1987) found that fever and/or unintentional weight loss was associated with AIDS, while diar-rhea was not. Saah et al. (1992), in turn, indicated the independent contribution of incident fatigue to the prediction of AIDS, but observed no signifi-cant prognostic value associated with history of weight loss or fever. In addition, Kaplan et al. (1987) suggested that the presence of a constitu-tional symptom and a low CD4+ count (less than 408 cells/mm3) was associated with higher risk of AIDS, but did not account for the independent ef-fects of the variables considered. Of interest, per-haps, may be the finding that the presence of night sweats adds prognostic information to the level of CD4+ count and the presence of oral thrush in pre-dicting the onset of AIDS (Rabeneck et al. 1993). In accounting for constitutional symptoms the literature has been, however, more concerned with the report of more than one of such symptoms, being pertinent to say, for example, that the AIDS-related complex is defined by the presence of at least two constitutional symptoms, including oral candidiasis (Royce et al. 1991).
As can be seen in Table I, having two or more constitutional symptoms does not seem to be con-sistently associated with the onset of AIDS or CD4+ T-lymphocyte depletion, and it has been shown that it has much less prognostic significance than CD4+ cell measurements (Taylor et al. 1989). A study, among intravenous drug users, indicated that the presence of at least two symptoms, including oral candidiasis, added independent information to CD4+ count and neopterin level in predicting AIDS (Muñoz et al. 1992). In contrast, another study also developed among intravenous drug users found that no other clinical conditions were associated with the risk of AIDS after oral candidiasis and bacte-rial infections were controlled (Selwyn et al. 1992). In predicting CD4+ cell depletion, just one study was supportive of the prognostic value of having two or more constitutional symptoms (Alcabes et al. 1993).
Oral candidiasis - In the studies in which it was analyzed separated from HIV-infection related symptoms, oral candidiasis was found to be sig-nificantly associated with the development of AIDS (Saah et al. 1992, Selwyn et al. 1992, Rabeneck et al. 1993). But, it was not indicated to be a predic-tor of CD4+ decline rate, after controlling for the presence of at least two constitutional symptoms
and the presence of bacterial infections (Alcabes et al. 1993).
Bacterial infections - The association of bacte-rial infections with the onset of AIDS or CD4+ cell decline rate was examined among intravenous drug users, group of HIV-infected patients especially susceptible to have those infections before devel-oping AIDS. Two studies reviewed were support-ive of the idea that the presence of bacterial infec-tion has prognostic value for the disease progres-sion (Selwyn et al. 1992, Alcabes et al. 1993). In another study, although subjects who reported hav-ing at least one infectious disease other than AIDS had lower baseline CD4+ cell counts than subjects with no such diseases, there was no significant dif-ference between the two groups in regard to CD4+ cell decline rates (Margolick et al. 1992).
AIDS diagnosis - Under the label “clinical sta-tus”, having a prior AIDS-defining illness, com-pared to not having, was examined as an explana-tory variable of survival, in a study among HIV-infected men with CD4+ count lower than 100 cells/ mm3 (Colford et al. 1994). The result reported was not surprising, indicating that the harzard of death for advanced HIV-disease patients with an AIDS-defining illness was higher than for those without an AIDS-defining illness, even after controlling for variables such as absolute CD4+ count, and AZT use. An interesting finding of that work, however, was the large amount of heterogeneity not ex-plained in a group of patients that initially could be seen as homogeneous.
447 447447 447447 Mem Inst Oswaldo Cruz, Rio de Janeiro, Vol. 92(4), Jul./Aug. 1997
after the AIDS diagnosis, or physiologic deficits (Turner et al. 1989, 1991). These indices are de-scribed in the section “Staging Systems”.
The differentiation of AIDS conditions in rela-tion to expected resource utilizarela-tion is not part of the disease progression literature’s scope, and has been less explored. Any way, it is noteworthy that such differentiation is also of key concern in this work, constituting an important step in its devel-opment.
Cofactors
Many variables have been analyzed as poten-tial cofactors of HIV disease progression, but very few have been shown to have some significance. Here, we focus on these few variables: HIV-trans-mission risk group, age, duration of infection, pre-vious cytomegalovirus infection, and medical treat-ment.
Risk group - Limitations of the utilization of risk group as a cofactor of HIV disease progres-sion may be attributable to two facts. Except for blood transfusion recipients, different HIV infec-tion risk groups do not seem to be associated with different progression rates in the overall, or ad-vanced course of disease (Ward et al. 1989, Muñoz et al. 1992, Margolick et al. 1992, Colford et al. 1994, Galai et al. 1995). In addition, the faster pro-gression rates observed among blood transfusion recipients, in comparison to patients infected by other routes, would probably be accounted by char-acteristics of the HIV virus. In a study, it was shown that the sooner the blood donor developed AIDS after donation, the faster the recipient also did (Ward et al. 1989). Taking into consideration the distribution of HIV-infected patients among risk groups in a population, however, could be worthy in estimating morbidity trends, including the dis-tribution of AIDS-defining diseases (Brookmeyer & Gail 1994).
Age - Age at infection has been widely consid-ered in studies concerned with identifying variables associated with HIV disease progression, and re-sults reported seem to indicate that it is a cofactor among hemophiliacs, but not among homosexual and bisexual men, or intravenous drug users. Among blood transfusion recipients, evidence is less clear.
Goedert et al. (1989) found in their study among hemophiliacs that older adults progressed to sub-clinical immunodeficiency more quickly than younger adults or children and adolescents. They also found that the incidence of p24 antigenemia and loss of anti-p24 was much lower in adoles-cents, suggesting a lower rate of HIV replication than in younger children or adults. In addition, re-sults indicated that children and adolescents had a
much lower incidence of AIDS after the loss of anti-p24, suggesting a better tolerance of replicat-ing HIV-1 before the onset of AIDS.
Still among HIV-infected hemophiliacs, it was found that the progression to AIDS and the risk of death were, respectively, faster and higher for those aged 25 and over, compared to those aged less than 25 (Lee et al. 1991, Phillips et al. 1992a). More-over, another study indicated a tendency (p = 0.1) for older individuals (≥18) to experience a higher risk of P. carinii pneumonia at a given CD4+ count than younger individuals (<18) (Phillips et al. 1992b).
Studying HIV-infected homosexual and bi-sexual men, Moss et al. (1988) found that the harzard of AIDS was approximately twice as high for those who were 35 or over as for those under 35, without controlling for other variables. Veugelers et al. (1994) have not identified an as-sociation between increasing age and faster pro-gression to opportunistic infections, but to neo-plasms. Furthermore, all other authors of studies included in this review have failed in identifying the predictive power of age in HIV disease pro-gression (Polk et al. 1987, Goedert et al. 1987, Muñoz et al. 1988, Pedersen et al. 1989, Hessol et al. 1989, Saah et al. 1992).
Among intravenous drug users, a study reported that age was inversely associated with CD4+ count, and that there was no association between age and the progression to AIDS once the CD4+ cell count was held constant (Selwyn et al. 1992). In addi-tion, no association between age and the rate of decline of CD4+ cells was registered (Margolick et al. 1992).
For blood transfusion recipients, the compari-son between those who developed AIDS with those who did not suggested no association of age and AIDS in one of the studies reviewed (Ward et al. 1989). In contrast, another study indicated that in-dividuals older than 60 were more likely to have AIDS, HIV-related symptoms, or depletion of CD4+ T-lymphocytes to less than 200 cell/mm3, than individuals with age from 15 to 60, control-ling for sex and health status (Blaxhult et al. 1990). Finally, studies including mixed risk-group HIV-infected patients with advanced disease have not indicated that age is an important variable in predicting survival. In a study of AIDS patients, the older were found to have a higher risk of dying within three months of AIDS diagnosis, but not after surviving this interval (Turner et al. 1991). Moreover, age was not associated with survival in a cohort of HIV-infected patients with less than 100 CD4+ cells/mm3 (Colford et al. 1994).
448 448 448 448
448 Markers, Cofactors and Staging Systems of HIV Disease • MC Portela, KN Simpson
is controversial. It was suggested to be an inde-pendent predictor of CD4+ cell depletion (Muñoz et al. 1988). Also, it was found to contribute to a faster development of AIDS in the studies devel-oped by Polk et al. (1987) and Lee et al. (1991). But no other study that evaluated the variable in-dicated its prognostic value (Goedert et al. 1987, Fernández-Cruz et al. 1990, Saah et al. 1992).
According to findings of Polk et al. (1987), knowledge of prior cytomegalovirus infection added significant information to variables such as CD4+ count, and HIV antibody level, among ho-mosexual and bisexual men. Lee et al. (1991), in turn, reported that the effect of cytomegalovirus was independent of age, among hemophiliacs.
Duration of infection - The applicability of duration of infection as a cofactor of HIV disease progression in a mixed population of HIV-infected patients is strongly limited by the difficulty of de-termining when the infection occurred. However, because of the recognition that the risk of the de-velopment of more advanced HIV disease increases over time, two findings reported by the literature are noteworthy here.
Among blood transfusion recipients, duration of infection was indicated to have no association with the development of AIDS. As previously mentioned, the really important determinant of a fast progression to AIDS was if the blood donor developed AIDS soon after (Ward et al. 1989).
The other finding of interest was resulting from a study among hemophiliacs. In that study, dura-tion of HIV seropositivity, a proxy for duradura-tion of infection, was suggested to be of much less sig-nificance than the rate of CD4+ cell decline to con-sider the disease progression risk (Phillips et al. 1991).
Medical therapy - From the incorporation of AZT to the use of multiple-drug regimens, HIV disease treatment has advanced enormously, result-ing in increasresult-ingly better rates of disease progres-sion.
The efficacy of AZT, as measured by reduc-tion in mortality and frequency of opportunistic infections, was initially demonstrated among pa-tients with AIDS and AIDS-related complex (Fischl et al. 1987); as a result, in the middle of 1987, AZT was incorporated in the treatment of symptomatic patients or those with less than 200 CD4+ cell/mm3. At the very beginning of the 1990s, AZT given prophylactically was claimed to explain differences between the numbers of AIDS cases expected and observed in the late 1980s (Gail et al. 1990). Also, at that point in time, AZT was considered efficacious for the treatment of asymptomatic HIV-infected individuals with less than 500 CD4+ cells/mm3, shown to be associated
with reduced rates of progression to either AIDS or advanced AIDS-related complex (Volberding et al. 1990). In the early 90’s, AZT and other pro-phylactic treatments were largely instituted in the medical care of symptomatic and asymptomatic HIV-infected patients. Antiretroviral therapy was recommended for all HIV-infected persons with CD4+ T-lymphocyte counts of less than 500 cells/ mm3, and prophylaxis against P. carinii pneumo-nia (PCP), the most common AIDS-defining diag-nosis, has been recommended for those with CD4+ T-lymphocyte counts of less than 200 cells/mm3 (CDC 1992a, b).
Graham et al. (1991), evaluated the effect of the use of pre-AIDS AZT and PCP prophylaxis on the development of AIDS, and on the development of a first episode of PCP. Employing log-linear regression models, they found that the use of AZT accounted for significant reductions in rates of pro-gression to AIDS within transition intervals of 6, 12, 18, and 24 months, among individuals starting medical therapy with less than 350 CD4+ T-lym-phocytes/mm3. Among those with CD4+ count greater or equal to 350 cells/mm3, only non-sig-nificant protective trends were observed. PCP pro-phylaxis, in additon to AZT, was indicated to be associated with significant reduction in the prob-ability of progression to a first episode of PCP, es-pecially among HIV-infected patients with less than 200 CD4+ cells/mm3.
In Table I, two studies suggest the significance of medical therapy in considering the progression to AIDS. Lee et al. (1991) compared the risk of progression to AIDS, after the CD4+ count had fallen below certain cut off levels (50, 100, 150, and 200 cells/mm3), observed up to and after No-vember 1988, month in which they first treated asymptomatic patients with AZT. They found that, whichever cut off was chosen, there was a higher risk of progression to AIDS before November 1988. In the other study, Selwyn et al. (1992) found that the use of AZT was an independent predictor of HIV disease progression, being associated with a 63% reduction in the risk of AIDS. In addition to the indication that treatment reduces the risk of developing AIDS, the literature has suggested that untreated patients developed AIDS with signifi-cantly higher CD4+ counts than treated patients (Crowe et al. 1991, Lee et al. 1991). Crowe et al. (1991) reported, however, that AZT did not influ-ence the level of immunodeficiency (as measured by CD4+ numbers) at which the common opportu-nistic infections developed.
449 449449 449449 Mem Inst Oswaldo Cruz, Rio de Janeiro, Vol. 92(4), Jul./Aug. 1997
to cause small rises in the number of CD4+ T-lym-phocytes, but this effect was described to be tran-sient, not affecting the rates of progression to lower CD4+ counts (Graham et al. 1991). In fact, the in-dication in Table I of a non-significant effect of treatment on the depletion of CD4+ cells is not surprising (Alcabes et al. 1993). Because the au-thors used intervals six months apart in their analy-sis, even the transient effects of AZT on suppres-sion of CD4+ cell loss, likely to occur within the period of 24 weeks after beginning therapy, would have been missed.
In regard to survival, DeGruttola et al. (1993) reported a positive effect of the use of AZT, com-pared to placebo, among patients with AIDS and AIDS-related complex. The harzard of death for placebo recipients was found to be higher at all levels of CD4+ lymphocytes. As indicated in the previous paragraph, measured changes in CD4+ T-lymphocytes did not account for all observed im-provement in survival, and, consequently, the au-thors suggested that clinical endpoints would be preferable markers in considering treatment effects on survival, in populations with advanced disease. Also of interest in the work of DeGruttola et al. (1993) is the fact that the harzard of death increased steadily for the AZT recipients, even after control-ling for CD4+ lymphocytes.
The use of AZT was also indicated to be inde-pendently associated with survival in the study of Colford et al. (1994), involving HIV-infected pa-tients with less than 100 CD4+ cells/mm3. How-ever, among individuals with such degree of im-munosuppression, likely to have already been ex-posed to treatment for some time, a relevant as-pect to be considered was the ability to tolerate the medication.
The literature has provided strong indications that early AZT therapy (started while HIV disease was still stable, and CD4+ count was between 200 and 500 cells/mm3) did not differ from late therapy (started after an AIDS defining illness had devel-oped or CD4+ count had fallen below 200 cells/ mm3) regarding the effect on survival (Corey & Fleming 1992, Seligmann et al. 1994). More con-troversially, it also has suggested no differences between the two treatment policies in relation to the clinical disease progression, despite the con-sistent difference in CD4+ counts (Seligmann et al. 1994, Lipsky 1994). Because of toxicity or loss of beneficial power over time, the early use of AZT was then questioned and not encouraged (Corey & Fleming 1992, Seligmann et al. 1994). In addi-tion, the use of alternative antiretroviral agents began to be considered as an effective strategy af-ter prolonged AZT therapy (Corey & Fleming 1992).
The power of available treatment regimens on modifying HIV disease prognosis has been strongly enhanced in the last two to three years. Monotherapy treatment is not considered a reason-able option any more. Multidrug combination therapy is now accepted as the best strategy for HIV management, achieving greater suppression of viral burden and viral replication, and inhibit-ing or delayinhibit-ing the development of drug resistance (Lange 1995b). In addition, strong scientific ratio-nale exists in the sense of intervening with a com-bination of antiretroviral agents early in the course of HIV infection, while the immune system is still intact (Lange 1995b, Merigan 1995).
Combination therapy is suggested to require agents that demonstrate additive or synergistic ac-tivity, do not have similar side-effect profiles, and avoid cross-resistance (Merigan 1995). At this point, many combinations are possible, but still need to be assessed in well-designed clinical tri-als. However, there are indications that triple-drug combinations are better than two-drug combina-tions and that combinacombina-tions containing AZT are better than those not containing AZT (Merigan 1995).
Efforts are currently made by the scientific com-munity and pharmaceutical companies (Inter-com-pany collaboration on AIDS drug development) towards defining the more efficacious multidrug regimens, as well as their long-term consequences (Lange 1995b).
The next section presents eight HIV disease staging systems provided in the literature. These systems combine markers covered in this section and/or some specific clinical conditions in the defi-nition of different disease prognosis categories. Among them, while six were proposed for classi-fying HIV-infected patients in general, the other two were aimed at classifying patients with ad-vanced disease (AIDS patients). In addition to the staging systems, next section describes other HIV disease severity classification systems not staging-oriented.
STAGING SYSTEMS
cri-450 450 450 450
450 Markers, Cofactors and Staging Systems of HIV Disease • MC Portela, KN Simpson
teria, but they need to be accounted in the disease progression modelling if they affect the rate at which individuals progress from stage to stage.
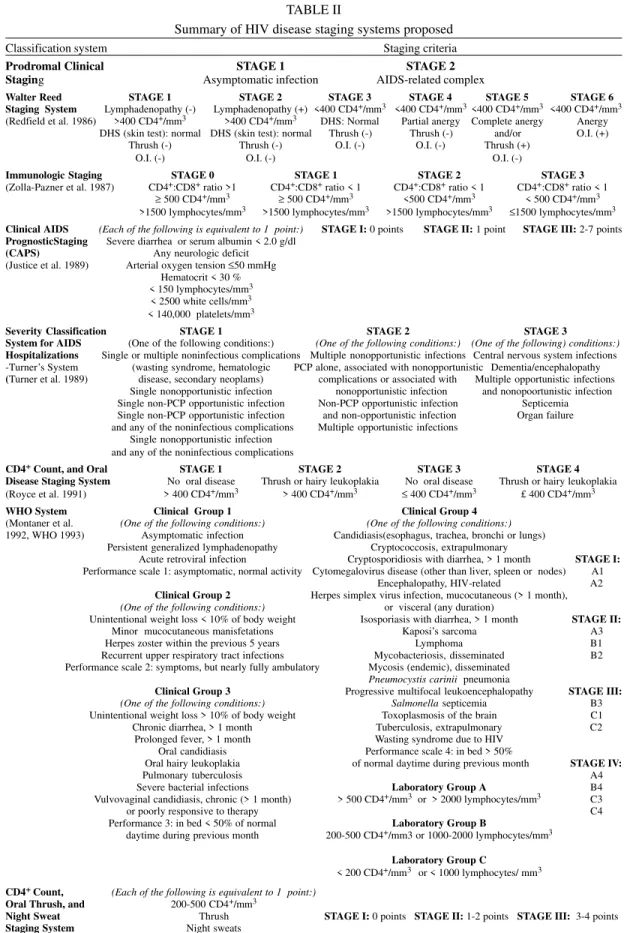
Our review of previously developed HIV dis-ease staging systems provides a summary of the related staging criteria (Table II) and findings re-garding their disease prognostic value, and, in very few cases, their ability to predict resource utiliza-tion.
The first staging system presented in Table II allows for differentiation only between an asymp-tomatic period and a period with the AIDS-related complex, characterized by the presence of signs and symptoms such as persistent fever, fatigue, diarrhea, unintentional weight loss, hairy leuko-plakia, thrush, herpes, or night sweats (Royce et al. 1991). Although the two stages have been shown to be significantly different in regard to progres-sion to death, their prognostic information is very limited, not accounting for very distinct clinical conditions within each stage. A modified version of the asymptomatic and AIDS-related complex staging system includes a stage corresponding to AIDS (Longini et al. 1989).
The Walter Reed staging system was defined by the following criteria, given the presence of HIV infection: CD4+ T-lymphocyte count (> 400, or < 400 cells/mm3); absence or presence of persistent lymphadenopathy; hypersensitivity response (skin test); absence or presence of thrush; and absence or presence of an opportunistic infection (Redfield et al. 1986). Recognized limitations of the Walter Reed staging system include the inability to clas-sify a substantial proportion of HIV-infected per-sons, and insignificant prognosis differences be-tween some adjacent stages, due, especially, to the low predictive value of lymphadenopathy, and par-tial anergy. In addition, loss of information is as-sociated with the dichotomization of CD4+ count (MacDonell et al. 1988, Royce et al. 1991).
Another HIV disease staging system found in the literature was defined based on immunologic markers: the CD4+:CD8+ ratio (> 1, or < 1), the level of CD4+ T-lymphocytes (≥ 500, or < 500 cells/mm3), and the level of lymphocytes (>1500, or ≤ 1500 cell/mm3) (Zolla-Pazner et al. 1987). This system was indicated to classify most HIV-infected individuals and its three first stages (stage 0, 1 and 2) were shown to account for increased risks of AIDS and death. The prognostic for indi-viduals in stage 3 (see Table II), however, was not found to differ significantly from that for individu-als in stage 2 (Royce et al. 1991).
Royce et al. (1991) proposed a simple staging based on oral disease (oral candidiasis and/or hairy leukoplakia) and CD4+ count (> 400, or ≤ 400cells/ mm3), the clinical and laboratory staging
compo-nents from the three systems described above which proved most useful prognostically and prac-tically. In comparing the four systems, they sug-gested that their system might be the most effec-tive for non-AIDS HIV infected individuals.
The staging system proposed by Justice et al. (1989) - the Clinical AIDS Prognostic Staging (CAPS), also included in Table II, relies on the observation of physiologic deficits, giving one point for each of the following: severe diarrhea or serum albumin level under 2.0 g/dl, any neurologic deficit, arterial oxygen tension of 50 mmHg or less, hematocrit below 30%, lymphocyte count below 150/mm3, white cell count below 2500/mm3, and platelet count below 140,000/mm3. It was designed for classifying patients with AIDS, and includes three stages defined by the total number of points registered, and found to be associated with signifi-cantly distinct survival curves: stage I (0 points), stage II (1 point) and stage III (2 to 7 points).
In studies based on hospital discharges, Justice’s system has been shown to be highly pre-dictive of survival, providing important prognos-tic discrimination for AIDS patients (Seage et al. 1993, Justice et al. 1994). It has not been indicated, however, to be a good predictor of hospitalization length of stay and cost patients (Seage et al. 1993). Designed for patients with AIDS was also the staging system developed by Turner et al. (1989). Specifically, it focuses on AIDS hospitalizations, taking into account an a priori model of the clini-cal severity of AIDS complications. Principles in-corporated by such clinical model are listed as fol-lows: morbidity and mortality should increase with rising stage; limited involvement of one organ is less severe than extensive involvement of one or-gan or the involvement of multiple oror-gans with a disease process (such as an infection); multiple complications are generally worse than single com-plications; and central nervous system disease and organ failure are associated with high mortality rates and advanced stage classifications. Twenty distinct substages of AIDS hospitalizations, asso-ciated with mortality rates ranging from 6% to 60%, were defined within three stages (see Table II).
The Severity Classification System for AIDS Hospitalizations (SCAH), name given to Turner-Kelly-Ball’s system has been extensively employed in the literature, and evidence supports its strong value in predicting inpatient mortality and long-term survival (patients (Seage et al. 1993, Justice et al. 1994, Friedman et al. 1996). In contrast to Justice’s system, SCAH has also been shown to be directly associated with longer and more costly hospitalization (Seage et al. 1993, Fortgang & Moore 1995, Friedman et al. 1996).
451 451451 451451 Mem Inst Oswaldo Cruz, Rio de Janeiro, Vol. 92(4), Jul./Aug. 1997
TABLE II
Summary of HIV disease staging systems proposed
Classification system Staging criteria
Prodromal Clinical STAGE 1 STAGE 2 Staging Asymptomatic infection AIDS-related complex
Walter Reed STAGE 1 STAGE 2 STAGE 3 STAGE 4 STAGE 5 STAGE 6 Staging System Lymphadenopathy (-) Lymphadenopathy (+) <400 CD4+/mm3 <400 CD4+/mm3<400 CD4+/mm3 <400 CD4+/mm3 (Redfield et al. 1986) >400 CD4+/mm3 >400 CD4+/mm3 DHS: Normal Partial anergy Complete anergy Anergy
DHS (skin test): normal DHS (skin test): normal Thrush (-) Thrush (-) and/or O.I. (+)
Thrush (-) Thrush (-) O.I. (-) O.I. (-) Thrush (+)
O.I. (-) O.I. (-) O.I. (-)
Immunologic Staging STAGE 0 STAGE 1 STAGE 2 STAGE 3 (Zolla-Pazner et al. 1987) CD4+:CD8+ ratio >1 CD4+:CD8+ ratio < 1 CD4+:CD8+ ratio < 1 CD4+:CD8+ ratio < 1
≥ 500 CD4+/mm3 ≥ 500 CD4+/mm3 <500 CD4+/mm3 < 500 CD4+/mm3 >1500 lymphocytes/mm3 >1500 lymphocytes/mm3 >1500 lymphocytes/mm3 ≤1500 lymphocytes/mm3 Clinical AIDS (Each of the following is equivalent to 1 point:) STAGE I: 0 points STAGE II: 1 point STAGE III: 2-7 points PrognosticStaging Severe diarrhea or serum albumin < 2.0 g/dl
(CAPS) Any neurologic deficit (Justice et al. 1989) Arterial oxygen tension ≤50 mmHg
Hematocrit < 30 % < 150 lymphocytes/mm3 < 2500 white cells/mm3 < 140,000 platelets/mm3
Severity Classification STAGE 1 STAGE 2 STAGE 3
System for AIDS (One of the following conditions:) (One of the following conditions:) (One of the following) conditions:) Hospitalizations Single or multiple noninfectious complications Multiple nonopportunistic infections Central nervous system infections -Turner’s System (wasting syndrome, hematologic PCP alone, associated with nonopportunistic Dementia/encephalopathy (Turner et al. 1989) disease, secondary neoplams) complications or associated with Multiple opportunistic infections
Single nonopportunistic infection nonopportunistic infection and nonopoortunistic infection Single non-PCP opportunistic infection Non-PCP opportunistic infection Septicemia Single non-PCP opportunistic infection and non-opportunistic infection Organ failure and any of the noninfectious complications Multiple opportunistic infections
Single nonopportunistic infection and any of the noninfectious complications
CD4+ Count, and Oral STAGE 1 STAGE 2 STAGE 3 STAGE 4 Disease Staging System No oral disease Thrush or hairy leukoplakia No oral disease Thrush or hairy leukoplakia (Royce et al. 1991) > 400 CD4+/mm3 > 400 CD4+/mm3 ≤ 400 CD4+/mm3 £ 400 CD4+/mm3 WHO System Clinical Group 1 Clinical Group 4
(Montaner et al. (One of the following conditions:) (One of the following conditions:) 1992, WHO 1993) Asymptomatic infection Candidiasis(esophagus, trachea, bronchi or lungs)
Persistent generalized lymphadenopathy Cryptococcosis, extrapulmonary
Acute retroviral infection Cryptosporidiosis with diarrhea, > 1 month STAGE I: Performance scale 1: asymptomatic, normal activity Cytomegalovirus disease (other than liver, spleen or nodes) A1
Encephalopathy, HIV-related A2 Clinical Group 2 Herpes simplex virus infection, mucocutaneous (> 1 month), (One of the following conditions:) or visceral (any duration)
Unintentional weight loss < 10% of body weight Isosporiasis with diarrhea, > 1 month STAGE II:
Minor mucocutaneous manisfetations Kaposi’s sarcoma A3
Herpes zoster within the previous 5 years Lymphoma B1
Recurrent upper respiratory tract infections Mycobacteriosis, disseminated B2 Performance scale 2: symptoms, but nearly fully ambulatory Mycosis (endemic), disseminated
Pneumocystis carinii pneumonia
Clinical Group 3 Progressive multifocal leukoencephalopathy STAGE III: (One of the following conditions:) Salmonella septicemia B3 Unintentional weight loss > 10% of body weight Toxoplasmosis of the brain C1 Chronic diarrhea, > 1 month Tuberculosis, extrapulmonary C2
Prolonged fever, > 1 month Wasting syndrome due to HIV Oral candidiasis Performance scale 4: in bed > 50%
Oral hairy leukoplakia of normal daytime during previous month STAGE IV:
Pulmonary tuberculosis A4
Severe bacterial infections Laboratory Group A B4
Vulvovaginal candidiasis, chronic (> 1 month) > 500 CD4+/mm3 or > 2000 lymphocytes/mm3 C3
or poorly responsive to therapy C4
Performance 3: in bed < 50% of normal Laboratory Group B
daytime during previous month 200-500 CD4+/mm3 or 1000-2000 lymphocytes/mm3 Laboratory Group C
< 200 CD4+/mm3 or < 1000 lymphocytes/ mm3 CD4+ Count, (Each of the following is equivalent to 1 point:)
Oral Thrush, and 200-500 CD4+/mm3
Night Sweat Thrush STAGE I: 0 points STAGE II: 1-2 points STAGE III: 3-4 points Staging System Night sweats