ABSTRACT:Mulch materials of different origins have been introduced into the agricultural sector in recent years alternatively to the standard polyethylene due to its environmental impact. This study aimed to evaluate the multivariate response of mulch materials over three consecutive years in a processing tomato (Solanum lycopersicon L.) crop in Central Spain. Two biodegrad-able plastic mulches (BD1, BD2), one oxo-biodegradbiodegrad-able material (OB), two types of paper (PP1, PP2), and one barley straw cover (BS) were compared using two control treatments (standard black polyethylene [PE] and manual weed control [MW]). A total of 17 variables relating to yield, fruit quality, and weed control were investigated. Several multivariate statistical techniques were applied, including principal component analysis, cluster analysis, and discriminant analysis. A group of mulch materials comprised of OB and BD2 was found to be comparable to black polyethylene regarding all the variables considered. The weed control variables were found to be an important source of discrimination. The two paper mulches tested did not share the same treatment group membership in any case: PP2 presented a multivariate response more similar to the biodegradable plastics, while PP1 was more similar to BS and MW. Based on our multivariate approach, the materials OB and BD2 can be used as an effective, more environmentally friendly alternative to polyethylene mulches.
Keywords: mulching, principal component analysis, cluster analysis, discriminant analysis
Introduction
Mulching is the most common worldwide tech-nique employed by vegetable growers in protected cul-tivation. Manufactured plastic films (i.e. polyethylene) have been the most widely used materials for this pur-pose. These plastics are produced from petroleum de-rivatives, which besides being non-renewable resources, are not degradable, and thus pollute the environment for periods much longer than the crop duration (Moreno and Moreno, 2008; Martín-Closas and Pelacho, 2011). Therefore, the best solution is to find a material with a lifetime similar to the crop duration time that can be later incorporated by the agricultural system through a biodegradation process (Martín-Closas and Pelacho, 2011). In this context, several biodegradable materials have been used as alternatives in the last years, includ-ing oxo-biodegradable films, biopolymer mulches, differ-ent types of papers, and crop residues (Kasirajan and Ngouajio, 2012).
The response of mulch materials as alternatives to polyethylene has been studied approaching only one variable or one specific category of variables, such as those related to weed control, crop yield, or fruit quality (Pires et al., 2006; Moreno et al., 2009). In this regard, the analysis of variance (ANOVA) has been widely used to compare independently the corresponding mean val-ues for each variable obtained in mulch materials in one or more crop cycles compared with polyethylene (Mag-nani et al., 2005; Cirujeda et al., 2012). However, the literature review conducted for this article did not reveal previous studies that considered the existence of a group of mulch materials similar to the conventional polyeth-ylene but more respectful with the environment while
simultaneously evaluating various variables of different nature.
Multivariate data analysis gives specific informa-tion about the relainforma-tionships among variables, as well as others derived from the entire data matrix (Martens and Martens, 2000; Cozzolino et al., 2009). These techniques have been widely used in specific agronomic areas such as sensory analyses (Pagés, 2004) and studies related to genetic variability or improvement (Chen et al., 2009; Leão et al., 2011).
This study aimed to find a group of mulch materi-als with a similar response to the standard polyethylene considering weed control, crop yield, and fruit quality as variables, but more environmentally friendly.
Materials and Methods
Site description and field experiment
Field experiments were conducted in Ciudad Real, Spain (39º0’ N; 3º56’ W; altitude 640 m), during 2006, 2007, and 2008 in three adjacent plots, respectively. The region is characterised by a continental Mediterranean climate. Mean temperatures during the cropping seasons were 23.9, 21.9 and 22.6 ºC in years 2006, 2007, and 2008, respectively. Damaging hailstorm took place at the beginning of the crop season in 2007.
The soil at the experimental site is classified as an Alfisol, Xeralfs, Petrocalcic Palexeralfs (USDA, 2010). Soils were loamy-clay-sandy (plot for year 1) and loamy (plots for years 2 and 3), moderately basic (pH around 8.0), non-saline, and with a low-to-normal level of or-ganic matter (18.4 to 22.0 g kg–1).
Trials were designed as randomised complete blocks with four replicates and eight treatments consist-Received January 30, 2013
Accepted April 26, 2013
1Universidad de Castilla-La Mancha/Escuela de Ingenieros
Agrónomos, Ronda de Calatrava, 7 – 13071 – Ciudad Real – Spain.
2Universidad Politécnica de Madrid – Depto. de Matemática
Aplicada a la Ingeniería Agronómica (E.T.S.I.A), Ciudad Universitaria s/n – 28040 – Madrid – Spain.
3Universidad Politécnica de Madrid/CEIGRAM, Ciudad
Universitaria s/n – 28040 – Madrid – Spain.
*Corresponding author <[email protected]>
Edited by: Thomas Kumke
Mulch materials in processing tomato: a multivariate approach
ing of mulch materials of diverse origin and properties: (i) black standard polyethylene (PE, 15 µm, Siberline); (ii) black oxo-biodegradable mulch (OB, 15 µm, Gem-plast); (iii) black biodegradable plastic mulch (BD1, corn starch, 17 µm, Barbier); (iv) black biodegradable plas-tic mulch (BD2, corn starch, 15 µm, Novamont); (v) re-cycled brown paper mulch (PP1, 140 g m–2, Saica); (vi) black paper mulch (PP2, 85 g m–2, Mimcord); (vii) barley (Hordeum vulgare L.) straw (BS, 10 t ha–1), and (viii) man-ual weeding (MW). PE and MW were used as the control treatments. In MW, weed control was performed when necessary a total of three times during each crop cycle.
Each elemental plot consisted of a crop row 23-m long, spaced 1.5 m apart, with beds 0.8-m wide and with 0.2-m plant spacing. Trial measurements were deter-mined in the 15 central meters of each elemental plot. The processing tomato cv. “Perfect Peel F1” (Seminis) was used during the three experimental seasons. Nurs-ery seedlings were transplanted in the open air on 18 May 2006 and 2007 and 04 June 2008, one to two days after mechanical mulching, and drip-irrigated daily. In 2007, there were restrictions on the irrigation water ap-plied proportionally in all mulch treatments for reasons beyond the scope of the trial. Fertilisation consisted of organic vermicompost (4,000 kg ha–1, 2.2 % N, 1.5 % P and 2.3 % K in organic forms) and organic foliar fertilis-ers (5 L ha–1, 15 % free amino acids, 3 % N).
Trial measurements
The variables analysed each year were arranged according to weed control, tomato yield and yield com-ponents, and fruit quality aspects. Weeds were tested in each treatment 63 days after transplanting. For these measurements, four 1 m × 0.2 m frames, 10 cm apart from the tomato row, were defined on each bed treat-ment (Anzalone et al., 2010). The number of weeds was counted, and the weed soil cover was measured by im-age processing of digital photographs of the mulch sur-face and then expressed as a percentage. Additionally, aboveground dry weed biomass was determined at a temperature of 60 ºC.
The tomato fruits were harvested independently in each treatment (five plants per elemental plot) when ripe fruits accounted for approximately 80 % of the total healthy fruits in each treatment. The crop cycles lasted from 101 to 119 days, depending on both the season and mulch treatment. Fruits were classified as red market-able fruits, healthy green fruits with a diameter superior to 25 mm or non-marketable fruits, and then counted and weighed. For yield calculations, the marketable (i.e., the sum of red and large green fruits) and total yield as well as their components (i.e., fruit number and mean fruit weight) were considered. At harvest, several quality variables for processing tomatoes were measured in 20 marketable fruits selected at random from each elemen-tal plot, including toelemen-tal soluble solids (ºBrix), pH and titratable acidity, firmness , juice content , dry weight and external fruit colour (Hunter L, a, b colour space).
The colour variable L is correlated with lightness and scaled from 0 (black) to 100 (white), while a represents a green-to-red, negative-to-positive scale. Finally, b repre-sents a blue-to-yellow, negative-to-positive scale.
Statistical procedure: Multivariate analysis meth-ods
The statistical procedure proposed by Lebart et al. (2006) was applied, which combines factorial methods with cluster analysis. The procedure was complemented with cluster discrimination determined from the explor-atory data analysis. Average yields were approximately 30 % lower in 2007 than in 2006 and 2008 (data not shown), as result of the irrigation water restrictions and the hailstorm accounted at the beginning of the crop sea-son. However, certain fruit quality variables (i.e., fruit dry matter and total soluble solids) were approximately 10 % higher in 2007 compared with the mean of the other two years. For these reasons, and when consider-ing simultaneously such a large number of variables of different nature, a multivariate study was independently developed for each of the three years of the trial. Then, the following procedure was implemented with respect to the 17 variables analysed here. First, dimensionality reduction of the variable space was conducted through the principal component analysis (PCA). The number of extracted PCs each year was determined by using scree plots, where the number of components was represent-ed in the X axis, and the corresponding eigenvalue of the correlation matrix in the Y axis. Thus, the number of extracted PCs corresponded to the number of compo-nents with eigenvalues in the sharply descending part of the plot and explained more than 70 % of the total variance. The factor matrices were rotated orthogonally (normalized Varimax method). Second, for the set of 32 observations (i.e., eight treatments x four replicates) de-fined by the extracted PC each year, a cluster analysis (CA) was performed to form possible clusters of mulch treatments (method UPGMA, Unweighted Pair Group Method using Arithmetic Mean), resulting in the cor-responding dendrograms. To obtain the optimal cluster solution, a reference value of approximately 50 % of the root node distance was used in the dendrograms. It was assumed that a mulch treatment belonged to a certain cluster when it obtained at least 75 % of its observations, analyzing in detail the case of 50 % of them.
mean fruit weight were excluded from the initial study because of low sampling adequacy, less than 0.5 (Kaiser, 1974).
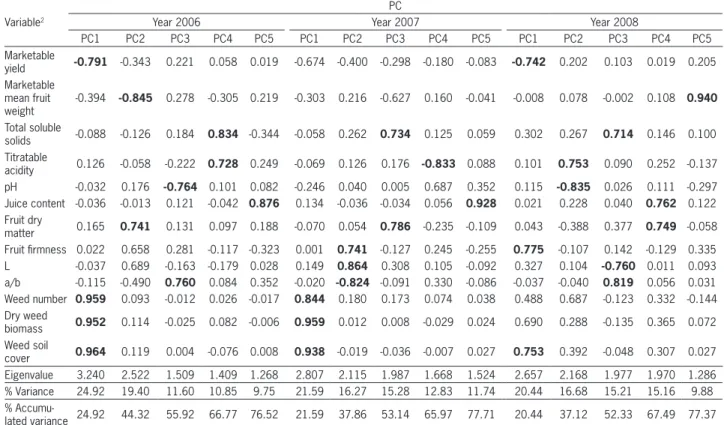
The scree plot obtained as in Hair et al. (2009) sug-gested that the first five principle axes represented each year a sufficient amount of variance (76.52 %, 77.71 % and 77.37 %, respectively, Table 1). For this reason, the biplots with the first two axes did not show a great deal of patterns.
The main information derived from Table 1 is the importance of weed variables on the total variability of data in each of the three years of the study and their opposition to any yield components. Weed variables presented high coefficients in the first principal compo-nent (PC1) each year (24.92 %, 21.59 % and 20.44 % of the total variance, respectively). In these PC1, any yield variables appear with coefficients of opposite sign. As expected, the negative impact of weeds on yield compo-nents is exhibited in PC1 each year.
The effect of the colour variables on the total vari-ability of the set of variables is clear, always appearing among the first three PCs. These findings are in line with those reported by Ordóñez-Santos et al. (2008), who de-scribed the variability in tomato products by using the multivariate statistical tools of principal components and hierarchical analysis. L was opposed to a/b in each year (see the high coefficients of opposite sign in PC2 in both similar is localized. The first discriminating function (in
the X axis of the discriminant space) corresponds to the highest eigenvalue of W–1B, where W and B are the re-sidual and inter-group covariance matrices, respectively. This function is responsible of the maximum separation among the mean group vectors. The maximum number of discriminant functions obtained on each occasion was equal to the minimum {k-1, n}, where k is the number of groups and n is the number of discriminating variables reviewed (Fisher, 1936; Hair et al., 2009). The discrimi-nation of the function corresponding to the λj eigenvalue is (λj/Σλj)×100.
All these analyses will give indications of simi-larities and differences between the mulches. Statistical analyses were implemented using SPSS v.19 statistical software and Infostat professional v.2007.
Results and Discussion
Characterisation of groups of mulch materials with homogeneous behaviour
Dimensionality reduction and factor interpretation in the reduced space
Tomato production was expressed through both marketable yield and marketable mean fruit weight; marketable and total fruit number, total yield and total
Table 1 –Rotated component analysis factor matrix1. Principal component (PC) extraction method. Years 2006, 2007, 2008.
Variable2
PC
Year 2006 Year 2007 Year 2008
PC1 PC2 PC3 PC4 PC5 PC1 PC2 PC3 PC4 PC5 PC1 PC2 PC3 PC4 PC5
Marketable
yield -0.791 -0.343 0.221 0.058 0.019 -0.674 -0.400 -0.298 -0.180 -0.083 -0.742 0.202 0.103 0.019 0.205 Marketable
mean fruit weight
-0.394 -0.845 0.278 -0.305 0.219 -0.303 0.216 -0.627 0.160 -0.041 -0.008 0.078 -0.002 0.108 0.940
Total soluble
solids -0.088 -0.126 0.184 0.834 -0.344 -0.058 0.262 0.734 0.125 0.059 0.302 0.267 0.714 0.146 0.100 Titratable
acidity 0.126 -0.058 -0.222 0.728 0.249 -0.069 0.126 0.176 -0.833 0.088 0.101 0.753 0.090 0.252 -0.137 pH -0.032 0.176 -0.764 0.101 0.082 -0.246 0.040 0.005 0.687 0.352 0.115 -0.835 0.026 0.111 -0.297 Juice content -0.036 -0.013 0.121 -0.042 0.876 0.134 -0.036 -0.034 0.056 0.928 0.021 0.228 0.040 0.762 0.122 Fruit dry
matter 0.165 0.741 0.131 0.097 0.188 -0.070 0.054 0.786 -0.235 -0.109 0.043 -0.388 0.377 0.749 -0.058 Fruit firmness 0.022 0.658 0.281 -0.117 -0.323 0.001 0.741 -0.127 0.245 -0.255 0.775 -0.107 0.142 -0.129 0.335 L -0.037 0.689 -0.163 -0.179 0.028 0.149 0.864 0.308 0.105 -0.092 0.327 0.104 -0.760 0.011 0.093 a/b -0.115 -0.490 0.760 0.084 0.352 -0.020 -0.824 -0.091 0.330 -0.086 -0.037 -0.040 0.819 0.056 0.031 Weed number 0.959 0.093 -0.012 0.026 -0.017 0.844 0.180 0.173 0.074 0.038 0.488 0.687 -0.123 0.332 -0.144 Dry weed
biomass 0.952 0.114 -0.025 0.082 -0.006 0.959 0.012 0.008 -0.029 0.024 0.690 0.288 -0.135 0.365 0.072 Weed soil
cover 0.964 0.119 0.004 -0.076 0.008 0.938 -0.019 -0.036 -0.007 0.027 0.753 0.392 -0.048 0.307 0.027 Eigenvalue 3.240 2.522 1.509 1.409 1.268 2.807 2.115 1.987 1.668 1.524 2.657 2.168 1.977 1.970 1.286 % Variance 24.92 19.40 11.60 10.85 9.75 21.59 16.27 15.28 12.83 11.74 20.44 16.68 15.21 15.16 9.88 %
Accumu-lated variance 24.92 44.32 55.92 66.77 76.52 21.59 37.86 53.14 65.97 77.71 20.44 37.12 52.33 67.49 77.37
1Orthogonal Varimax rotation, Kaiser normalisation, convergence in 6, 11 and 9 iterations; 2Revised variables. In bold, coefficients > 0.7 (absolute value) in the
2006 and 2007 and PC3 in 2008), in accordance with the results obtained by Carli et al. (2009), and indicates that the red colour intensification in tomato fruits led to a decrease in the lightness of the fruit.
Fruit dry matter, firmness, and the L colour vari-ables were opposite to the marketable yield (PC2) in 2006. Also in 2008, marketable yield was inversely cor-related to fruit firmness (coefficients with opposite sign in PC1). In 2007, marketable mean fruit weight was opposite to the total soluble solids and fruit dry mat-ter (PC3) (Table 1), in agreement with Molyneux et al. (2004) and Ignatova et al. (2008). However, these find-ings differ from those obtained by Carli et al. (2009), who found a positive correlation between yield and fruit dry matter content. Particularly in 2007 (PC3, Table 1), a strong positive correlation between total soluble sol-ids and fruit dry matter was observed (Pearson correla-tion coefficient, 0.71), in agreement with Candido et al. (2006) when comparing the effect of soil solarisation on a tomato crop.
Establishment of groups of mulch materials with ho-mogeneous behaviour
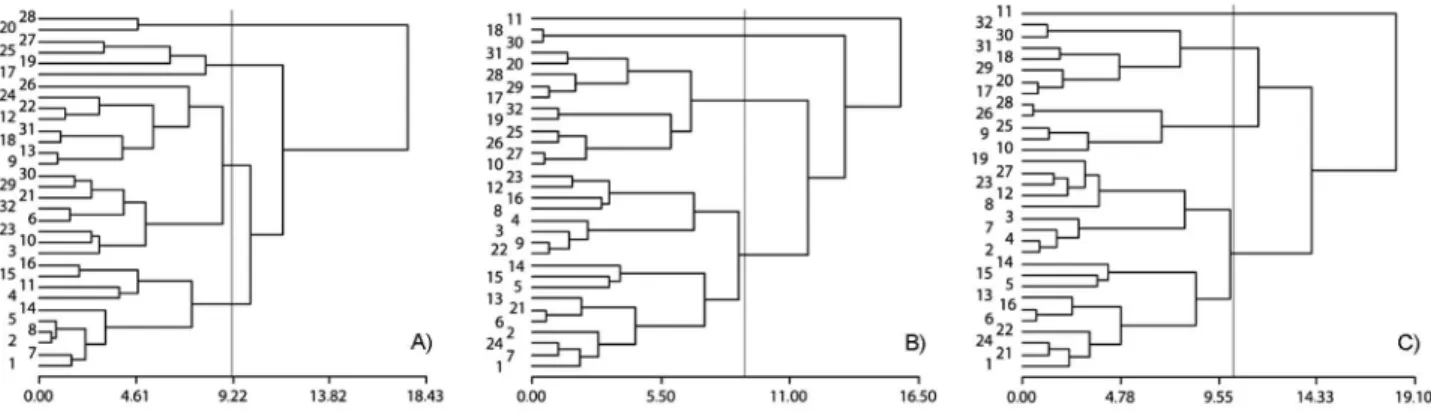
Dendrograms related to CA of the observations defined through the retained PCs (76.52 %, 77.71 % and 77.37 % of the variance, respectively, Table 1) were obtained (Figure 1). In 2006, the corresponding dendro-gram (Figure 1A) showed that most of the observations for the BD1, PP2 and MW treatments were included in a single cluster, with proximity between both BD1 and PP2 as well as between PP2 and MW. A second cluster incorporated 75 % of the observations for the PE, OB and BD2 treatments; in addition, a third cluster suggested an association between PP1 and BS mulch treatments.
The dendrogram for 2007 (Figure 1B) suggested an initial two-cluster solution. In the first, larger cluster, the observations corresponding to the plastic mulches and
PP2 were very close, and as in the previous season, a close association between the latter and the BD1 was observed. In the second cluster, the observations corre-sponding to the PP1 and MW showed close proximity; BS was also incorporated into this cluster.
For 2008 (Figure 1C), a three-cluster solution was obtained. The largest cluster included all observations corresponding to PE, OB, BD2 and PP2. A second cluster incorporated 75 % of the observations of BS and 50 % of those of BD1; a third cluster clearly associated PP1 and MW (75 % and 100 % of the observations, respectively).
In summary, we considered three groups in 2006 (Group 1: PE, OB and BD2; Group 2: BD1, PP2 and MW; Group 3: PP1 and BS), two groups in 2007 (Group 1: PE, OB, BD1, BD2 and PP2; Group 2: PP1, BS and MW), and three groups in 2008 (Group 1: PE, OB, BD2 and PP2; Group 2: BD1 and BS; Group 3: PP1 and MW).
Discrimination among groups of treatments
A review of the PCs that defined the observations each year was performed (Table 1). By season, the re-vised variables with discriminatory power among groups (F-test, p < 0.05) for the corresponding DA were: PC1, PC2, PC4, and PC5 in 2006; PC1 and PC2 in 2007; PC1, PC2, and PC4 in 2008.
The discriminant functions obtained each year and the discrimination percentage provided by them are shown in Table 2. The mean scores of the different groups of treatments (group centroid coordinates), along with the correct classification rate for each year, were obtained (Table 3). A high percentage of observations were classified correctly (93.80 %, 96.90 % and 93.80 % in 2006, 2007, and 2008, respectively) (Table 3).
The PC1 extracted in the three years of the trial (i.e., weeds as opposed to any yield component) present-ed high coefficients in the discriminant functions. These coefficients and the centroid location of Groups 1 (PE
groups) explain that these groups obtained the highest yield and weed control each year (Tables 1, 2, 3).
From the general analysis of Tables 1, 2, 3, other specific interpretations are derived. As example, in 2006, the discriminant power exercised by the fruit quality variables was associated with PC5 (juice content), given its high coefficient in the first discriminant function, PC2 (fruit dry matter, firmness, L colour variable) and PC4 (ºBrix and acidity). This finding explains the lower fruit acidity and juice content obtained in Group 2 (centroid abscissa of -1.291) and the higher fruit dry matter and L colour variable obtained in Group 3 (centroid abscissa of 1.113) (Tables 1, 2, 3). That year, the weed variables (and opposite to them, the yield variables), were very influ-ential on the second discriminant function (see the high PC1 coefficient in this function, Table 2). As the centroid ordinate corresponding to Group 1 was very low in rela-tion to the other groups (-1.106, Table 3), then this Group was characterized by low PC1 values, which means that the PE group presented fewer weeds and higher yield than the other groups of treatments.
Presentation of characteristic groups of mulch ma-terials
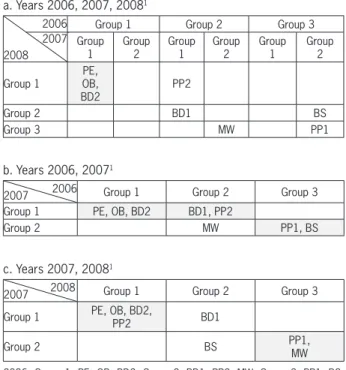
As the main result regarding the response of the treatments considered, the PE, the oxo-biodegradable OB, and the biodegradable BD2 belonged to the same group of mulch treatments over the three years of the study, leading to affirm the conclusion that they form a
characteristic group of mulch materials in a processing tomato crop (Table 4a).
The presence of the oxo-biodegradable material (OB) in the PE group was expected as result of its pet-rochemical origin. Across the three years of study, the biodegradable BD2 and the PE films stood out for having the highest mean marketable yields (12.1 and 11.7 kg m–2, respectively).
A good yield response in BD2 was also observed in previous univariate studies on tomato crops (Martín-Closas et al., 2003). In the same way, the proper effect of both biodegradable film and paper mulches on weed control has also been widely documented (Weber, 2003; Magnani et al., 2005; Cirujeda et al., 2012). In this study, however, straw mulch controlled weeds more poorly, allowing for the appearance of 12 plants m–2 (3-yr av-erage), which was 15 % greater than in polyethylene mulch.
PP1 and BS had the lowest marketable yields (10.26 and 10.52 kg m–2, respectively), while PP2 paper produced similar yields as PE (11.58 kg m–2). The groups that contained BS in both 2006 (BS and PP1) and 2008 (BS and BD1) had high values for soluble solid and fruit dry matter contents (Tables 1, 2, 3). This difference could be explained by an extra supply of nutrients from the straw to the soil, which could increase the biological activity, available phosphorous and exchangeable soil potassium (Pinamonti, 1998). Consequently, the soil salinity could suffer a slight increase, favouring the fruit dry matter Table 2 –Canonical discriminant functions, discriminant variables, discrimination percentages and significance levels relative to discriminant
analysis. Years 2006, 2007, 2008.
Year 2006 Year 2007 Year 2008
Variable1 Function
2
Variable1 Function 2
Variable1 Function 2
1 2 1 1 2
PC1 -0.224 0.968 PC1 0.730 PC1 0.501 0.853
PC2 0.537 0.232 PC2 0.999 PC2 0.926 0.273
PC4 0.621 -0.072 PC4 -0.606 0.738
PC5 0.901 0.179
% Discrim. 56.10 43.90 100 75.20 24.80
Sign. level < 0.001 0.001 < 0.001 < 0.001 < 0.001
1Principal components (PC) revised from the previous Principal component analysis (PCA) each year; 2Standardised coefficients from the linear combination.
Table 3 – Discriminant function scores of the treatment group means (group centroid coordinates) and percentages of the observations correctly classified. Discriminant variables revised from the previous factorial analyses. Years 2006, 2007, 2008.
Year Group Function 1 Function 2 Observ. correctly classified
(%)
% Total correct classification
2006
1: PE, OB, BD2 0.749 -1.106 91.7
93.80
2: BD1, PP2, MW -1.291 0.259 100
3: PP1, BS 1.113 1.270 87.5
2007 1: PE, OB, BD1, BD2, PP2 -0.872 95.0 96.90
2: PP1, BS, MW 1.454 100
2008
1: PE, OB, BD2, PP2 -0.421 -0.992 100
93.80
2: BD1, BS -2.088 1.377 75
3: PP1, MW 2.929 0.680 100
accumulation (Dorais et al., 2001) and the fruit soluble solids concentration (Cuartero and Fernández-Muñoz, 1999).
The results obtained for each of the two cropping seasons (2006-2007 and 2007-2008) were analysed inde-pendently (Table 4b,c). The 2006-2008 combination is not included because it offered the same information as Table 4a. The two combined studies reported that the PP2 paper, contrary to initial expectations, was more closely associated with PE and biodegradable films (BD1 or BD2, depending on the case) than with the other pa-per tested (PP1) and the remaining treatments studied. PP1 was more closely associated with MW or BS, shar-ing group membership with them dependshar-ing on the two-year combination considered (Table 4b,c). In any case, the group/s where PP1 paper, BS and MW appeared each year resulted to be different to the group that met at the same time the treatments PE, OB, and BD2 (Table 4a,b,c).
Conclusions
The variables related to weed control were an •
important source of discrimination, and they can be summarised in a single one (the first principal component, PC1, in each year).
OB (oxo-biodegradable) and BD2 (biodegradable) •
films were comparable to black polyethylene. The PE, OB and BD2 group was clearly differentiated •
from the other clusters that contained PP1 paper, BS, and MW.
OB and BD2 could be considered as an effective, more •
environmentally friendly alternative to polyethylene mulches.
Acknowledgements
Materials were generously provided by Novamont S.p.A., Saica S.A., Mimcord S.A., Barbier S.A. and Gen-plast S.A companies. Project INIA RTA2005-00189-C05-04, Spain. The authors would like to thank Ramón Meco, Jaime Villena, Ignacio Mancebo, Lorenzo Gómez and Javi-er Casanova for their contribution ovJavi-er the study pJavi-eriod.
References
Anzalone, A.; Cirujeda, A.; Aibar, J.; Pardo, G.; Zaragoza, C. 2010. Effect of biodegradable mulch materials on weed control in processing tomatoes. Weed Technology 24: 369-377.
Candido, V.; Miccolis, V.; Castronuovo, D.; Manera, C.; Margiotta, S. 2006. Mulching studies in greenhouse by using eco-compatible plastic films on fresh tomato crop. Acta Horticulturae 710: 415-420.
Carli, P.; Arima, S.; Fogliano, V.; Tardella, L.; Frusciante, L.; Ercolano, M.R. 2009. Use of network analysis to capture key traits affecting tomato organoleptic quality. Journal of Experimental Botany 60: 3379-3386.
Chen, J.; Wang, H.; Shen, H.; Chai, M.; Li, J.; Qi, M.; Yang, W. 2009. Genetic variation in tomato populations from four breeding programs revealed by single nucleotide polymorphism and simple sequence repeat markers. Scientia Horticulturae 122: 6-16.
Cirujeda, A.; Aibar, J.; Anzalone, A.; Martín-Closas, L.; Meco, R.; Moreno, M.M.; Pardo, A.; Pelacho, A.M.; Rojo, F.; Royo-Esnal, A.; Suso, M.L.; Zaragoza, C. 2012. Biodegradable mulch instead of polyethylene for weed control of processing tomato production. Agronomy for Sustainable Development 32: 889-897.
Cozzolino, D.; Cynkar, W.U.; Shah, N.; Damberg, R.G.; Smith, P.A. 2009. A brief introduction to multivariate methods in grape and wine analysis. International Journal of Wine Research 1: 123-130.
Cuartero, J.; Fernández-Muñoz, R. 1999. Tomato and salinity. Scientia Horticulturae 78: 83-125.
Dorais, M.; Papadopoulus, A.P.; Gosselin, A. 2001. Greenhouse tomato fruit quality. The influence of environmental and cultural factors. Horticultural Reviews 26: 239-349.
Fisher, R.A. 1936. The use of multiple measurements in taxonomy problems. Annals of Eugenics 7: 179-188.
Hair, J.F.; Anderson, R.E.; Tatham, R.L.; Black, W.C. 2009. Multivariate data analysis. Prentice Hall, New York, NY, USA. Ignatova, S.I.; Zagidullina, N.F.; Golubkina, N.A. 2008. Biological
value of greenhouse tomatoes grown in Moscow suburbs. Acta Horticulturae 789: 235-238.
Table 4 – Characteristic groups of mulch materials.
a. Years 2006, 2007, 20081
2006 2007 2008
Group 1 Group 2 Group 3
Group 1
Group 2
Group 1
Group 2
Group 1
Group 2
Group 1
PE, OB, BD2
PP2
Group 2 BD1 BS
Group 3 MW PP1
b. Years 2006, 20071
2006
2007 Group 1 Group 2 Group 3
Group 1 PE, OB, BD2 BD1, PP2
Group 2 MW PP1, BS
c. Years 2007, 20081
2008
2007 Group 1 Group 2 Group 3
Group 1 PE, OB, BD2, PP2 BD1
Group 2 BS PP1,MW
2006: Group 1: PE, OB, BD2; Group 2: BD1, PP2, MW; Group 3: PP1, BS. 2007: Group 1: PE, OB, BD1, BD2, PP2; Group 2: PP1, BS, MW. 2008: Group 1: PE, OB, BD2, PP2; Group 2: BD1, BS; Group 3: PP1, MW.
1Treatments in table cells indicate coincidence in the same group of mulch
Kaiser, H. 1974. An index of factorial simplicity. Psychometrika 39: 30-45.
Kasirajan, S.; Ngouajio, M. 2012. Polyethylene and biodegradable mulches for agricultural applications: a review. Agronomy for Sustainable Development 32: 501-529.
Leão, P.C.S.; Cruz, C.D.; Motoike, S.Y. 2011. Genetic diversity of table grape based on morphoagronomic traits. Scientia Agricola 68: 42-49.
Lebart, L.; Mirineau, A.; Piron, M. 2006. Statistique Exploratoire Multidimensionelle. 4ed. Dound, Paris, France.
Magnani, G.; Filippi, F.; Graifenberg, A.; Bertikaccu, M. 2005. Agronomic evaluation of biodegradable mulch films. Colture Protette 34: 59-68.
Martens, H.; Martens, M. 2000. Multivariate Analysis of Quality: An Introduction. Wiley, New York, NY, USA.
Martín-Closas, L.; Pelacho, A.M. 2011. Agronomic potential of biopolymer films. p. 277-299. In: Plackett, D., ed. New materials for sustainable films and coating. Biopolymers. Wiley, New York, NY, USA.
Martín-Closas, L.; Soler, J.; Pelacho, A.M. 2003. Effect of different biodegradable mulch materials on an organic tomato production system. p. 78-85. In: Biodegradable materials and natural fibre composites. KTBL, Darmstadt, Germany.
Molyneux, S.L.; Lister, C.E.; Savage, G.P. 2004. An investigation of the antioxidant properties and colour of glasshouse grown tomatoes. International Journal of Food Sciences and Nutrition 55: 537-545.
Moreno, M.M.; Moreno, A. 2008. Effect of different biodegradable and polyethylene mulches on productivity and soil thermal and biological properties in a tomato crop. Scientia Horticulturae 116: 256-263.
Moreno, M.M.; Moreno, A.; Mancebo, I. 2009. Comparison of different mulch materials in a tomato (Solanum lycopersicum L.) crop. Spanish Journal of Agriculture Research 7: 454-464. Ordóñez-Santos, L.E.; Arbones, E.; Vázquez-Oderiz, L.;
Romero-Rodríguez, A.; Gómez, J.; López, M. 2008. Use of physical and chemical properties of commercial tomato (Lycopersicon esculentum Mill.) products for monitoring their quality. Journal of the Association of Official Agricultural Chemists 91: 112-122. Pagés, J. 2004. Multiple factor analysis: main features and
application to sensory data. Revista Colombiana de Estadística 27: 1-26.
Pinamonti, F. 1998. Compost mulch effects on soil fertility, nutritional status and performance of grapevine. Nutrient Cycling in Agroecosystems 51: 239-248.
Pires, R.C.M.; Folegatti, M.V.; Passos, F.A.; Arruda, F.B.; Sakai, E. 2006. Genetic diversity of table grape based on morphoagronomic traits. Scientia Agricola 63: 417-425. United States Department of Agriculture [USDA]. 2010. Keys
to Soil Taxonomy. USDA-Soil Survey Staff, Washington, DC, USA.