ABSTRACT: Melon plants (Cucumis melo L.) are grown in the state of Rio Grande do Norte (RN), the largest producer of melons in Brazil, with plastic mulch and agrotextiles. Studies of crop evapotranspiration (ET) under these conditions are required to ensure adequate irrigation. This study aimed to determine the crop coefficients (Kc) of irrigated melon plants grown with mulch and agrotextiles in the region of Mossoró, RN, based on the Bowen Ratio Energy Balance (BREB) method. Two experiments were conducted at different times during the 2009/2010 season in a melon producing area (4°59'52" S, 37°23'09" W, and 54 m elevation) to define ET and Kc. Due to the plastic cover and reduced precipitation during the experiments, the Kc obtained by the BREB method was considered the basal Kc - KcbBREB. The results were compared with the Kcb from the FAO 56 Bulletin. There was close agreement between BREB and FAO ET measurements (12 % underestimation by the FAO method for the entire crop season), with sizeable differences only during the initial phenological stage. The mean KcbBREB values of the two field campaigns were 0.26, 0.96 and 0.63 for the initial, midseason and late stages, respectively. The high KcbBREB value in the initial growth phase may be related to the effect of the plastic mulch and agrotextiles on the energy balance at the surface. The relationship between KcbBREB and fc had high correlation, making possible an estimation of the melon Kcb based on the level of crop ground cover.
Keywords:Cucumis melo (L.), Bowen Ratio, crop coefficients
been obtained under different conditions (Campos et al., 2010; Inman-Bamber and McGlinchey, 2003; Lovelli et al., 2005). Melon production in Mossoró involves specific practices; therefore, local studies are important for pro-viding information regarding the efficient use of water.
Methods for obtaining evapotranspiration based on energy balance are potentially interesting for analyzing the impact of crop management practices on energy fluxes and, thus, the loss of water from the plant surface. Among the methods for estimating ET based on energy balance, the Bowen Ratio Energy Balance (BREB) has been well evaluated and is recommended by several authors for dif-ferent crops (Irmak, et al., 2013; Hou et al., 2010; Zhang et al., 2010; Zeggaf et al., 2008).
This study applied the BREB method to determine the crop coefficients of irrigated melon grown with plastic mulch and agrotextiles in the region of Mossoró, state of Rio Grande do Norte, Brazil, to provide more locally ap-propriate information to irrigators to maintain high yields with more efficient use of water.
Materials and Methods
Characteristics of the experimental site and crop practices
Two field experiments were conducted in a melon-producing field in the municipality of Mossoró, in the 1Federal University of Paraíba – Dept. of Soil and Rural
Engineering, Rod. PB 079, km 12 –58397-000 – Areia, PB – Brazil.
²Federal University of Campina Grande – Academic Unit of Atmospheric Sciences – R. Aprígio Veloso, 882 – 58429900 – Campina Grande, PB – Brazil.
3Federal Rural University of Semiárido – Dept. of Environmental and Technological Sciences, Av. Francisco Mota, 572 – 59625-900 – Mossoró, RN – Brazil. 4Federal Rural University of Semiárido – Dept. of Exact, Technological and Human Sciences, R. Padre Felix, 169 – 59515-000 – Angicos, RN – Brazil.
5Brazilian Agricultural Research Corporation – Agricultural Research Center of Cerrado Environment, Rod. BR 020, km 18, C.P. 08223 – 73310-970 – Planaltina, DF – Brazil. *Corresponding author <[email protected]>
Edited by: Gerrit Hoogenboom
Energy balance and evapotranspiration of melon grown with plastic mulch in the
Valéria Peixoto Borges1*, Bernardo Barbosa da Silva2, José Espínola Sobrinho3, Rafael da Costa Ferreira4, Alexsandra Duarte de
Oliveira5, José Francismar de Medeiros3
Brazilian semiarid region
Introduction
The municipality of Mossoró, located in a semiarid region of northeastern Brazil, is the leading melon ( Cu-cumis melo L.) producer in the country, with production primarily for the foreign market (IBGE, 2013). Studies on the water requirements of melon produced in Mossoró are important not only due to the local climatic conditions but also to the specific cultural practices. Similar to other mel-on-producing regions worldwide, plastic mulch (polyethyl-ene film) is used on the beds where the plants are grown. In addition, polypropylene webs – agrotextiles – are in-stalled over the plant rows to minimize insectattacks, es-pecially by the silverleaf whitefly and the leaf miner fly. Both plastic mulch and polypropylene webs influence the microclimate near plants, including temperature, net ra-diation, relative humidity, wind speed and accumulated degree-days (Diaz-Perez, 2009; Gimenez et al., 2002), and this microclimate affects evapotranspiration and water use of plants (Lovelli et al., 2008, Qin et al., 2014).
Evapotranspiration, which is the water required by a crop, is often determined in irrigation management by the FAO-56 method (Allen et al., 1998) using the reference evapotranspiration (ET0) and crop coefficients (Kc). De-spite the practicality and reliability of this method, many Kc values available in the literature do not reflect the lo-cal conditions where they are applied, as they may have Received April 07, 2014
state of Rio Grande do Norte, Brazil (4°59'52" S, 37°23'09" W, and 54 m elevation). According to Koppen, the climate classification of the region is BSwh (very hot and dry, with rainfall in the summer and early autumn), with an aver-age temperature of 27.2 °C, total annual rainfall of 766 mm and average relative humidity of 69 %.
To determine the evapotranspiration of the melon plants according to the BREB method, two experiments were conducted at different times: Experiment 1 (Exp. 1), with planting on Aug 12, 2009 and harvest on Oct 19, 2009, and Experiment 2 (Exp. 2), with planting on Nov 3, 2009 and harvest on Jan 11, 2010. Both the experi-mental fields were cultivated with the 'Sancho' variety. The plants were grown in rows in the center of beds that were 0.6 m wide and covered with light gray polyethyl-ene film. The beds were placed 1.4 m apart (bare soil), making a total of 2.0 m spacing between the plant rows. Plants were separated by 0.5 m resulting in 1 plant m–1.
The soil was sandy because it consists of more than 80 % sand at depths from 0.0 to 0.4 m. Each experiment was conducted on a 5.74 ha plot: 200 m in the NW-SE direc-tion and 287 m in the NE-SW direcdirec-tion. Previous analysis had shown that the two prevailing wind directions were eastward and northeastward. The micrometeorological tower was installed and oriented toward the prevailing wind direction to achieve adequate fetch. The tower was positioned 120 m from the end of the plots near the west-southwest corner, ensuring a fetch distance of 223 m to the northeast and 215 m to the east. Other irrigated fields (east) and natural vegetation - Caatinga (northwest and west) were located around the experimental plots.
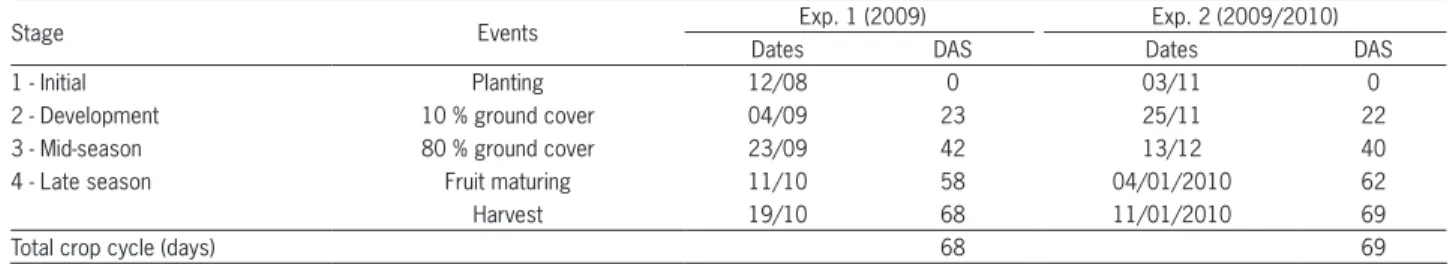
The growth stages of the melon plant were divided into four phases: 1 – initial stage, 2 – vegetative growth stage, 3 – midseason stage (fruit growth) and 4 – late sea-son stage (maturity) according to Miranda et al. (2008). Table 1 shows the dates and lengths of the crops’ physi-ological phases. Plant emergence occurred seven days af-ter sowing (DAS), when the agrotextiles were installed on the rows. The agrotextile is a white, thin, woven material that is made from long polypropylene filaments. This fab-ric is applied on a support structure (plastic arches firmly anchored in the furrows), forming a tunnel over the culti-vated beds, which ensures free plant growth and minimal resistance to gas exchange. For the melon crop, the agro-textile is used from the time of emergence to flowering. Therefore, the agrotextile was used in Exp. 1 from Aug 19 to Sep 10 and in Exp. 2 from Nov 17 to Dec 1. The crop
development was monitored by growth analysis with weekly samples beginning 15 DAS. The leaf area index (LAI) was determined using a leaf area integrator. Ground level cover (fc) assessments were made using pictures of the field that were taken with a digital camera aimed downward. Software to image analysis was conducted to determine the fc in m2 m−2, discriminating between live
vegetation and the soil background. The fc samples were collected weekly, and the data were interpolated between the measurements to complete the series.
Surface drip irrigation below the mulch, with emitters with a flow rate of 1.2 L h–1 was used. Each
planting row irrigation line was located on the bed sur-face under the mulch with emitters spaced at 0.5 m (one dripper per plant). The irrigation management adopted by farmers in this area is based on agrotextile use and phenological stages. The irrigation rate is fixed during the period of agrotextile use but is increased continu-ously from the day the agrotextile is removed. Maximum irrigation is applied during fruit formation, even when the fruit has reached the ideal size. During the matura-tion phase, water applied is gradually decreased until harvest. Daily irrigation requirements were divided into three small applications to maintain adequate soil water without deep percolation loss. Total irrigation was 325.2 mm in Exp. 1 and 339.6 mm in Exp. 2.
Melon evapotranspiration
The BREB method (Bowen, 1926), used to estimate plant evapotranspiration, determines the latent heat flux (LE) based on the following equation:
(1)
where: Rn is the net surface radiation, G is the soil heat flux (both in W m−2),and β is the ratio
between sensible heat flux and latent heat flux (Bowen Ratio), given by the following equation:
(2)
where: γ is the psychrometric factor (kPa °C−1), ΔT is
the vertical gradient of temperature (°C), and Δe is the vertical gradient of water vapor pressure (kPa), both de-termined above the crop canopy using psychrometers. This relationship is valid assuming that the coefficients
Table 1 − Length of the phenological stages of melon plants from Experiment 1 and Experiment 2 (Mossoró, RN, Brazil). DAS: days after sowing.
Stage Events Exp. 1 (2009) Exp. 2 (2009/2010)
Dates DAS Dates DAS
1 - Initial Planting 12/08 0 03/11 0
2 - Development 10 % ground cover 04/09 23 25/11 22
3 - Mid-season 80 % ground cover 23/09 42 13/12 40
4 - Late season Fruit maturing 11/10 58 04/01/2010 62
Harvest 19/10 68 11/01/2010 69
of turbulent diffusion of water vapor and heat are equal (Peres et al., 1999). The LE values (Wm−2) were
convert-ed into ET (mm) – ETBREB – by integrating the average instantaneous values of every half hour and dividing the result by the latent heat of vaporization.
Micrometeorological data were obtained during the period corresponding to the crop cycle in both experi-ments. Only daytime data were considered for the cal-culation of fluxes, as indicated by Perez et al. (1999). The following sensors were used: a net radiometer installed at a height of 2.20 m and two soil heat flux plates buried at 0.02 m, one under the mulch in the planting row and the other between rows. The vertical gradients of tem-perature and water vapor pressure were determined from measurements of wet and dry copper-constantan ther-mocouplestemperatures in fan-aspirated psychrometers. The psychrometers were installed 0.3 m (z1) and 1.8 m (z2) above the plant canopy and were elevated as the crop developed. The data were stored on a CR1000 data acqui-sition system programmed to make measurements every 5 s with averages stored every 30 min. The thermocouples were calibrated in a closed environment without solar ra-diation or air flow by immersing them in a container of water and obtaining measurements each second and aver-ages each minute for 24 h with the same data acquisition system that was used in the field.
ET0 and Kc curve
The crop coefficients (Kc) were determined by the ratio between the plant evapotranspiration from the BREB method (ETBREB) and the ET0. The ET0 was com-puted according to the FAO Penman-Monteith equation (Allen et al., 1998) from data collected at the weather station of the National Institute of Meteorology (IN-MET), which is located 10 km from the experiment site (5°4'54" S, 37°22'7" W, and 36 m elevation), according to the following equation:
(3)
where: Rn is the net radiation, G is the soil heat flux (both in MJ m−2 d−1), T is the average daily air
tempera-ture (°C), u2 is the wind speed averaged daily at a height
of 2 m (m s−1), es is the saturation vapor pressure (kPa),
ea is the actual vapor pressure (kPa), es-ea is the vapor pressure deficit (kPa), Δ is the slope of the vapor pressure curve (kPa °C−1), and γ is the psychrometric constant
(kPa °C−1).
In this study, we considered that the crop coeffi-cients refer primarily to plant transpiration under the following assumptions: (i) due to the plastic bed cover and the drip irrigation systems, the soilevaporation was small, occurring only through the hole of seedling emer-gence, which ceased a few days after planting; (ii) most of the period of data collection occurred during the dry season, with a total rainfall of 38 mm between Aug 12, 2009 and Jan 11, 2010 of which 25 mm was recorded in Jan, when the fraction of soil covered by the crop was greater than 0.90. Thus, the Kcb values were obtained from the BREB experiments.
The Kcb curve was constructed according to the phenological phases shown in Table 1. The values were compared with the corresponding Kcb from the FAO 56 paper – the KcbFAO was adjusted for local experimental conditions (Allen et al., 1998). For crops growing on plastic mulch, the FAO 56 paper recommends a 5-15 % reduction in Kcb; therefore, we applied a reduction of 10 %. The KcbFAO values for the middle and final stages were also adjusted to the local wind speed and humidity conditions, where the minimum relative humidity dif-fers from 45 % and the wind speed difdif-fers by 2 m s−1
(Equation 4).
(4)
where: Kcbtab is the melon crop basal coefficient from FAO 56, RHmin is the average daily minimum relative hu-midity, u2 is the average daily wind speed at a height of 2.0 m, and h is the plant height in m. The maximum height of the plants was 0.30 m.
Results and Discussion
Weather data and plant growth
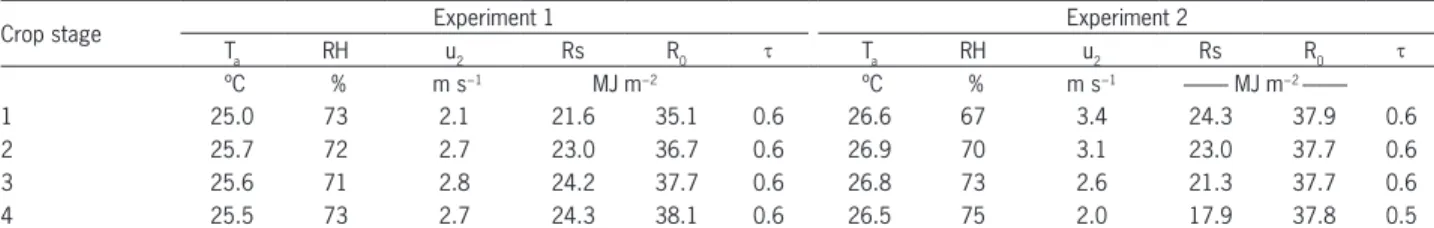
Table 2 shows the average daily values of air tem-perature (Ta), relative humidity (RH), wind speed at a 2 m height (u2) and global solar radiation (Rs) recorded in the experimental area for each crop phenological phase.
Table 2 − Daily averages of weather data for each phenological stage of the melon crops recorded in the experimental site during Experiment 1 (Aug 12 to Oct 19, 2009) and Experiment 2 (Nov 3, 2009 to Jan 11, 2010).
Crop stage Experiment 1 Experiment 2
Ta RH u2 Rs R0 τ Ta RH u2 Rs R0 τ
ºC % m s−1 MJ m−2 ºC % m s−1 --- MJ m−2 ---
1 25.0 73 2.1 21.6 35.1 0.6 26.6 67 3.4 24.3 37.9 0.6
2 25.7 72 2.7 23.0 36.7 0.6 26.9 70 3.1 23.0 37.7 0.6
3 25.6 71 2.8 24.2 37.7 0.6 26.8 73 2.6 21.3 37.7 0.6
4 25.5 73 2.7 24.3 38.1 0.6 26.5 75 2.0 17.9 37.8 0.5
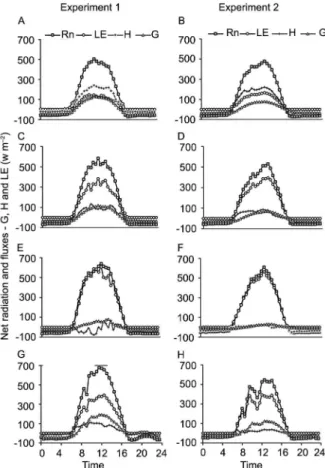
month of Oct, which is the month of maximum radia-tion incidence in the region. However, the proporradia-tion of fluxes in each stage was similar in both of the experi-ments. The soil heat flux (G) began at 20 % of Rn during the initial crop stage, decreasing to less than 10 % in the fruit growth phase, during which negative daytime val-ues were recorded. Teixeira et al. (2008) identified high LAI and intermittent irrigation as possible causes of the negative G conditions observed in the experimental field.
In the initial crop stage, approximately 40 % of the available energy (Rn – G) was used for evapotranspira-tion. During the fruit growth phase (mid-season), the latent heat flux (LE) accounted for almost all of the avail-able energy during the daytime, even exceeding the net radiation (Figure 2 E and F) when the sensible heat flux (H) was negative. In the late stage, LE accounted for 77 and 89 % of the energy available in Exp. 1 and Exp. 2, respectively.
The maximum percentage of available energy used to heat the air (H) was 61 % which occurred during the During the study period, the daily Ta and RH average
values remained fairly stable. The Ta ranged from 25 °C (Aug) to 26.8 °C (Dec), and the RH ranged from 67 % in Nov to 75 % in Jan 2010. The wind speed peaked (> 3.0 m s−2) during the period of lowest RH, i.e., Nov and Dec
(Stages 1 and 2 in Exp. 2).
Daily global radiation (Rs; MJ m−2) varied little
from Aug to Nov. Lower Rs was recorded during the last phenological phase of Exp. 2 in Jan (17.9 MJ m−2) due to
increased cloudiness beginning in Dec, which is typical of the local climatic conditions. The daily atmospheric transmissivity values (τ) showed this increased cloudi-ness because τ was relatively stable from Aug – Nov 2009 and decreased in Dec and Jan, reaching 0.47 in Jan 2010.
The rainfall and ET0 that were computed with the INMET weather data are presented in Figure 1. The rain-fall amount during the period of Aug 2009 to Jan 2010 was low (38 mm), mainly concentrated in the months of Aug 2009 and Jan 2010. Total ET0 was 928 mm, and the month with maximum water demand was Nov, with an average daily ET0 of 6.7 mm. Maximum ET0 value was 8.2 mm which occurred on Nov 1.
The crops had similar leaf area evolution in both experiments. LAI values at the end of the development stage were 1.9 m² m−2 (DAS 41) in Exp. 1 and 1.8 m² m−2
(DAS 39) in Exp. 2. At 40 DAS, the crop reached 80 % coverage of the planted area with associated increased water demand. Maximum LAI was recorded in the early stage of fruit maturity at 50 DAS in Exp. 1 (2.9 m2 m−2)
and 57 DAS in Exp. 2 (2.8 m2 m−2). Near harvest, LAI
decreased slightly. A cubic equation fit the LAI variation well, with LAI = –1E-4DAS3 + 0.01DAS2 – 0.31DAS +
2.41 (R² = 0.9899) for Exp. 1 and LAI= – 1E-4DAS3 +
0.01DAS2 – 0.27DAS + 1.91 (R² = 0.9728) for Exp. 2.
Bowen Ratio Energy Balance
The average daily variation in the energy balance components is shown in Figure 2 for each crop pheno-logical stage. At harvest, the Rn was higher in Exp. 1 because the end of the plant cycle coincided with the
Figure 2 – Average hourly values of the energy balance components determined by the BREB in two field experiments (Mossoró, RN, Brazil) during the phenological stages of melon plants: A and B, initial phase; C and D, vegetative growth phase; E and F, fruit growth phase (midseason); and G and H, harvest day. Rn: net radiation, G: soil heat flux, H: sensible heat flux, LE: latent heat flux.
initial crop phase. During the intermediate phase, H val-ues less than 100 W m−2 were recorded and were often
near zero or negative, as previously described (Figure 2 E and F). At the end of the crop cycle, with decreased irriga-tion depth and decreased leaf area, H was approximately 21 % of Rn – G. Hernandez-Ramirez et al. (2010) found an LE that was greater than 80 % Rn for soybean and corn crops in complete development, as recorded by Holland et al. (2013) in vine plants and Teixeira et al. (2008) in mango trees (with records of negative H values).
Some authors suggest that LE/Rn> 1 can occur due to the advection of sensible heat over the irrigated area, which comprises an input of energy from outside the system that would contribute to plant evapotrans-piration (Payero et al., 2003; Gavilán and Berengena, 2007). Moreover, Penman et al. (1967) indicated that in situations in which a crop that covers the ground is under suitable and intermittent irrigation, the air tem-perature near the canopy can be lower than the tempera-ture at the level slightly above the canopy. In this case, sensible heat flux is negative (vertically downward), as opposed to the water vapor flux, generating negative β values. β values between -0.7 and -0.01 were observed when the LE was higher than Rnduring daytime. Similar results were obtained by Zeggaf et al. (2008) in an irri-gated corn crop and Hernandez-Ramirez et al. (2010) in a soybean crop. This explanation can be applied to both experiments because the fetch was adequate and the crop LAI reached 2.8 m² m−2 during mid-season. In 77
and 50 % of days corresponding to the fruit growth stage (maximum LAI) in Exp. 1 and Exp. 2, respectively, β < 0 was observed during daytime in the same situations in which the air temperature recorded at 1.80 m was greater than the temperature closer to the plant canopy.
Melon ETc and basal crop coefficients
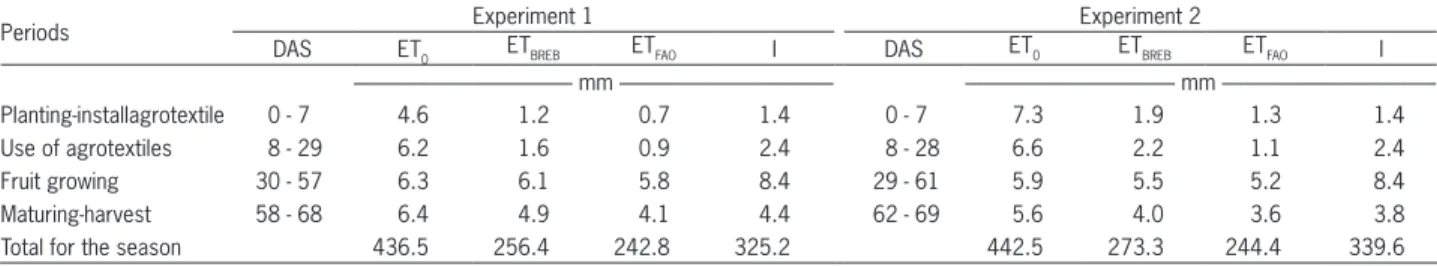
The total plant evapotranspiration was 256 mm in Exp. 1 and 273.3 mm in Exp. 2. The higher value in Exp. 2 occurred because of the greater ET0 of 443 mm during this period relative to 436 mm during Exp. 1. Moreover, the phase of maximum water demand (fruit growth) was longer in Exp. 2 (Table 1). The averaged ETBREB data for each phenological stage are presented in Table 3. The maximum ETBREB values were 7.9 mm (53 DAS) and 7.0 mm (47 DAS) for Exp. 1 and Exp. 2, respectively.
The amount of water applied exceeded the ETBREB except during the initial stage of plants in Exp. 2 and the final phase in both of the experiments (Table 3). Common irrigation practice in the region is to decrease irrigation before harvest to promote fruit maturation and prevent cracking due to excess water. Throughout the entire cycle, total water application exceeded crop evapotranspiration by approximately 25 %, indicating over-irrigation and the importance of improving irrigation management.
Close agreement between the ETBREB and ETFAO val-ues was observed in both of the experiments, especially after 40 DAS. The greatest divergence occurred during the crops’ initial phase and when the plants were under the agrotextile, in which the ETBREB was 56 % higher than the ETFAO in Exp. 1 and 61 % in Exp. 2. However, for the entire crop period, close agreement between the mea-sured and estimated data was observed, and there was an underestimation by the FAO method of only 6 % in Exp. 1 and 12 % in Exp. 2. Lovelli et al. (2005) reported an underestimation of 32 % for ETFAO compared with lysimeter data from melon plants grown with plastic mulch for the entire crop cycle.
Allen et al. (2011) proposed that, despite the transfer of sensible heat by convection or advection to the evapo-rating surface, there is an upper ET limit caused by limita-tions in aerodynamic transport and the balance of forces that are involved in the plant canopy. Allen et al. (2011) consider that this limit is well represented by the reference evapotranspiration calculated for alfalfa, which is greater than the ET0 based on a grass surface. Thus, despite the occurrence of LE values that arehigher than (Rn – G), as previously discussed, the ETBREB was not higher than the ET0 (Table 3), demonstrating consistency in the results.
After the adjustments for the local climatic con-ditions and use of plastic mulch, the initial KcbFAO was 0.14 for Exp. 1 and 0.16 for Exp. 2; the midseason and late season KcbFAO values were the same in both of the experiments, at 0.93 and 0.64, respectively. The crop coefficients determined using the BREB method for the initial, middle and late season stages in Exp. 1 were 0.25, 0.98 and 0.62, respectively; in Exp. 2, these values were 0.26, 0.94 and 0.64, respectively. Marked differences were observed in the initial Kcb for both of the periods (Figure 3), whereas during the other phases, the values suggested by the FAO were comparable with the values
Table 3 − Daily average reference evapotranspiration values (ET0), melon plant evapotranspiration (ETBREB), ETc estimated by the FAO 56 (ETFAO) and irrigation applications (I) for the irrigation management phases of melon crops in the two experimental fields (Mossoró, RN, Brazil) during the 2009/ 2010 season.DAS: days after sowing.
Periods Experiment 1 Experiment 2
DAS ET0 ETBREB ETFAO I DAS ET0 ETBREB ETFAO I
--- mm --- --- mm
---Planting-installagrotextile 0 - 7 4.6 1.2 0.7 1.4 0 - 7 7.3 1.9 1.3 1.4
Use of agrotextiles 8 - 29 6.2 1.6 0.9 2.4 8 - 28 6.6 2.2 1.1 2.4
Fruit growing 30 - 57 6.3 6.1 5.8 8.4 29 - 61 5.9 5.5 5.2 8.4
Maturing-harvest 58 - 68 6.4 4.9 4.1 4.4 62 - 69 5.6 4.0 3.6 3.8
measured, resulting in a high linear regression determi-nation coefficient between the methods (R² = 0.9135 for Exp. 1, and R² = 0.8558 for Exp. 2).
Table 4 presents the melon crop coefficients and phenological stage lengths that were determined in this study, from FAO 56 and in other reports. During the initial stage, our Kcb value differed considerably from the val-ues in other studies using plastic mulches to grow melons. Miranda et al. (1999) reported for the initial phase a Kc of approximately 0.2 and a mid-season Kc value > 1.0 under conditions without plastic mulch. Melo et al. (2013) re-ported a 30 % underestimation of KcbFAO compared with Kcb by lysimeter measurements. These authors suggested that the plastic mulch favored the increase in plant tran-spiration, which explains the much higher Kc value.
High evapotranspiration and KcbBREB values for the initial crop phase may be associated with increased air temperature around the lower psychrometer due to the plastic mulch. Due to its characteristics (color and mate-rial), the plastic mulch absorbs much of the solar radia-tion and transfers heat to the adjacent air layer, which is corroborated by the high surface temperatures dur-ing the initial crop phase (approximately 40 °C, data not shown). The β value decreased with large differences in the wet-bulb temperature between the two levels, and lower β values are associated with greater latent heat flux values. Cho et al. (2012) found a positive relation-ship between β and the total resistance to vapor flow in a vegetated area, concluding that higher temperature near the surface resulted in lower β values. Thus, even with-out significant water vapor flux during the initial phase, the BREB predicts otherwise because of the higher tem-peratures near the beds during the initial phenologi-cal phase. The high reflectance of the agrotextiles may also have caused the same problem by increasing the incidence of radiation on the psychrometers, thereby in-creasing the temperature of the air inside.
In this study, the length of the phenological phases and the total crop cycle differs greatly from that pro-posed in FAO Manual 56. For the Mediterranean region, Allen et al. (1998) reported a 120-day cycle for melon without mulch, and Lovelli et al. (2005) a 75-day cycle
for melon with plastic mulch. In this study, in both ex-periments, the crop cycle was 68 days. The local climatic conditions and the use of plastic mulch accelerate crop development (Qin et al., 2014), including fruit matura-tion (Lovelli et al., 2008). Such adjustments in the dura-tion of phases must be considered in the irrigadura-tion man-agementto avoid excess applications.
The crop coefficient evolution was related to both the DAS and the amount of ground that was shaded by the canopy. The following quadratic equations were found to model KcbBREB as a func-tion of DAS: Kcb = – 5E-05x2 + 0.0195x – 0.0685
(R² = 0.8214) in Exp. 1 and Kcb = – 0.0003x2 + 0.0339x – 0.1068
(R² = 0.9071) in Exp. 2. Several studies have demonstrat-ed the relationship between Kcb and ground cover level (fc). Transpiration is related to light interception by the canopy, i.e., the ground that is covered by the canopy. Aspects that are related to fc (vegetation indices, crop height and age) are applied in models that use fc to es-timate basal crop coefficients (Allen and Pereira, 2009; Johnson and Trout, 2012).
The KcbBREB, LAI and fc curves exhibited similar development (Figure 4), except during the initial stage, in which KcbBREB deviated from the LAI trend, when major differences with KcFAO were found. From the twentieth day after sowing, the KcbBREB related well
Figure 3 − Basal crop coefficients for melon measured by the BREB (KcbBREB) and estimated by FAO-56 (Allen et al., 1998) in two field experiments (Mossoró, RN, Brazil). The continuous line represents the KcbBREB curve, whereas the dashed line is the Kcb by the FAO method. DAS: days after sowing.
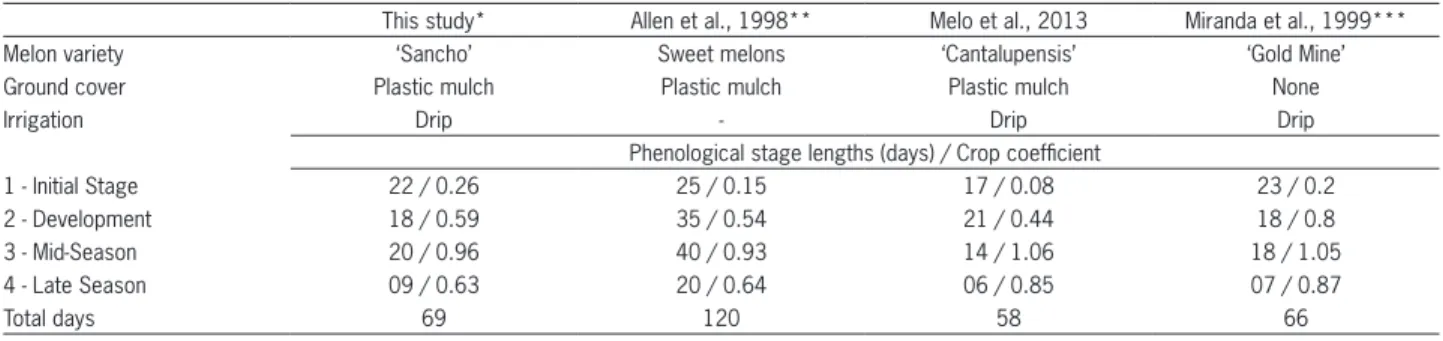
Table 4 – Comparison of the melon crop coefficients and phenological stage lengths with those reported by Allen et al. (1998), Melo et al. (2013) and Miranda et al. (1999).
This study* Allen et al., 1998** Melo et al., 2013 Miranda et al., 1999***
Melon variety ‘Sancho’ Sweet melons ‘Cantalupensis’ ‘Gold Mine’
Ground cover Plastic mulch Plastic mulch Plastic mulch None
Irrigation Drip - Drip Drip
Phenological stage lengths (days) / Crop coefficient
1 - Initial Stage 22 / 0.26 25 / 0.15 17 / 0.08 23 / 0.2
2 - Development 18 / 0.59 35 / 0.54 21 / 0.44 18 / 0.8
3 - Mid-Season 20 / 0.96 40 / 0.93 14 / 1.06 18 / 1.05
4 - Late Season 09 / 0.63 20 / 0.64 06 / 0.85 07 / 0.87
Total days 69 120 58 66
to crop development, with maximum values occurring during the middle stage and decreasing values during the fruit maturation. Similar results were reported by Shrestha and Shukla (2014), who investigated water-melon plants grown on plastic mulch and observed that Kcb followed the increase in fc and transpiration increased with plant growth, becoming the main com-ponent of the ETc.
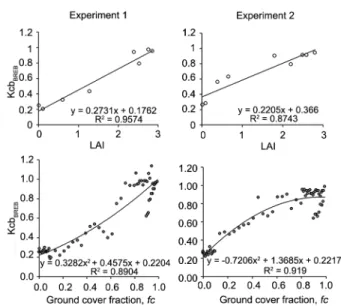
Bryla et al. (2010) used a quadratic regression equation to identify the relationship between Kcb and fc.In both of the experiments, the relationship fitted well (Figure 5) with the following equations: Exp. 1 - Kcb = 0.3282 fc² + 0.4575 fc + 0.2204 (R² = 0.8904) and Exp. 2 - Kcb = – 0.7206 fc2 + 1.3685 fc + 0.2217 (R² = 0.919).
The data scatter of the relationship between Kcb and fc suggests that not only the height and plant coverage but also the stomatal conductance affects the Kc (Allen and Pereira, 2009; Marsal et al., 2014).
The linear relationship between LAI and KcbBREB (Figure 5) also resulted in a high coefficient of determi-nation: Kcb = 0.273 LAI + 0.1762 (R² = 0.9574) in Exp. 1, and Kcb = 0.220 LAI + 0.366 (R² = 0.8743) in Exp.
2. This result indicates that with plastic mulch, drip ir-rigation and little rainfall, the water lost by melon crops primarily occurs through plant transpiration and that the Kcb can be estimated under these conditions based on the extent of the crop canopy expressed by the LAI or fc. Therefore, it is possible to estimate the Kcb of crops under these conditions with drip irrigation based on the crop LAI or fc.
Conclusions
The Kc obtained by the BREB was considered the basal Kc due to the plastic bed cover, drip irrigation and lowprecipitation during the crop cycles. The initial KcbBREB also exceeded the results reported in the litera-ture, even for crops without plastic mulch. For the rest of the melon season, the BREB and FAO-56 predictions matched well.
The curve of KcbBREB followed the evolution of the LAI and ground cover very well. The relationships involving the KcbBREB, LAI and fc presented high coef-ficients of determination and can be applied to estima-tions of Kcb for melon from the analysis of the ground cover level.
Acknowledgments
The authors would like to thank the Coordina-tion for the Improvement of Higher Level Personnel (CAPES) Foundation for granting the PhD scholarship, the owners and employees of the 'Fruta Vida' Farm for their permission to conduct the work and The Federal University of Campina Grande and The Federal Rural University of the Semi-Arid Region for implementation and support.
Figure 4 − Evolution of the basal crop coefficient (KcbBREB), leaf area index (LAI) and ground cover fraction (fc) during the melon crop cycle (Mossoró, RN, Brazil). DAS: days after sowing.
References
Allen, R.G.; Pereira, L.S.; Raes, D.; Smith, M. 1998. Crop Evapotranspiration. Guidelines for Computing Crop Water Requirements. FAO, Rome, Italy. (FAO Irrigation and Drainage Paper, 56).
Allen, R.G.; Pereira, L.S. 2009. Estimating crop coefficients from fraction of ground cover and height. Irrigation Science 28: 17-34. Allen, R.G.; Pereira, L.S.; Howell, T.A.; Jensen, M.E. 2011.
Evapotranspiration information reporting. I. Factors governing measurement accuracy. Agricultural Water Management 98: 899-920.
Bowen, J.S. 1926. The ratio of heat losses by conduction and by evaporation from any water surface. Physical Review 27: 779-787. Bryla, D.R.; Trout, T.J.; Ayars, J.E. 2010. Weighing lysimeters for
developing crop coefficients and efficient irrigation practices for vegetable crops. HortScience 45: 1597-1604.
Campos, I.; Neale, C.M.U.; Calera, A.; Balbontín, C.; Piqueras, J.G. 2010. Assessing satellite-based basal crop coefficients for irrigated grapes (Vitis vinifera L.). Agricultural Water Management 98: 45-54.
Cho, J.; Oki, T.; Yeh, P.J.F.; Kim, W.; Kanae, S.; Otsuki, K. 2012. On the relationship between the Bowen ratio and the near-surface air temperature. Theoretical and Applied Climatology 108: 135-145. Diaz-Pérez, J. 2009. Root zone temperature, plant growth and yield
of broccoli [Brassica oleracea (Plenck) var. italica] as affected by plastic film mulches. Scientia Horticulturae 123: 156–163. Gavilán, P.; Berengena, J. 2007. Accuracy of the Bowen ratio-energy
balance method for measuring latent heat flux in a semiarid advective environment. Irrigation Science 52: 127-140.
Gimenez, C.; Otto, R.F.; Castilla, N. 2002. Productivity of leaf and root vegetables crops under direct cover. Scientia Horticulturae 91: 1-11. Hernandez-Ramirez, G.; Hatfield, J.L.; Prueger, J.H.; Sauer,
T. 2010. Energy balance and turbulent flux partitioning in a corn-soybean rotation in the Midwestern US. Theoretical and Applied Meteorology 100: 79-92.
Holland, S.; Heitman, J.L.; Howard, A.; Sauer, T.J.; Giese, W.; Ben-Gal, A.; Agam, N.; Kool, D.; Havlin, J. 2013. Micro-Bowen ratio system for measuring evapotranspiration in a vineyard interrow. Agricultural and Forest Meteorology 177: 93-100. Hou, L.G.; Xiao, H.L.; Si, J.H.; Xiao, S.C.; Zhou, M.X.; Yang,
Y.G. 2010. Evapotranspiration and crop coefficient of Populus euphratica Olive forest during the growing season in the extreme arid region northwest China. Agricultural Water Management 97: 351–356.
Inman-Bamber, N.G.; McGlinchey, M.G. 2003. Crop-coefficients and water-use estimates for sugarcane based on long-term Bowen ratio energy balance measurements. Field Crops Research 83: 125–138. Instituto Brasileiro de Geografia e Estatística [IBGE]. 2013.
Municipal crop production. = Produção agrícola municipal. Available at: ftp://ftp.ibge.gov.br/Producao_Agricola/Producao_ Agricola_Municipal_%5Banual%5D/2013/pam2013.pdf [Accessed Dec. 20, 2013] (in Portuguese).
Irmak, S.; Kabenge, I.; Rudnick, D.; Knezevic, S.; Woodward, D.; Moravek, M. 2013. Evapotranspiration crop coefficients for mixed riparian plant community and transpiration crop coefficients for Common reed, Cottonwood and Peach-leaf willow in the Platte River Basin, Nebraska-USA. Journal of Hydrology 481: 177-190.
Johnson, L.F.; Trout, T.J. 2012. Satellite NDVI assisted monitoring of vegetable crop evapotranspiration in California’s San Joaquin Valley. Remote Sensing 4: 439-455.
Lovelli, S.; Pizza, S.; Caponio, T.; Rivelli, A.R.; Perniola, M. 2005. Lysimetric determination of muskmelon crop coefficients cultivated under plastic mulches. Agricultural Water Management 72: 147–159.
Lovelli, S.; Perniola, M.; Arcieri, M.; Rivelli, A.R.; Tommaso, T. Di. 2008. Water use assessment in muskmelon by the Penman–Monteith ‘‘one-step’’ approach. Agricultural Water Management 95: 1153-1160.
Marsal, J.; Johnson, S.; Casadesus, J.; Lopez, G.; Girona, J.; Stöckle, C. 2014. Fraction of canopy intercepted radiation relates differently with crop coefficient depending on the season and the fruit tree species. Agricultural and Forest Meteorology 184: 1-11.
Melo, T.K.; Medeiros, J.F.; Sobrinho, J.E.; Figueredo, V.B.; Souza, P.S. 2013. Evapotranspiration and crop coefficients of melon plants measured by lysimeter and estimated according to FAO 56 methodology. Engenharia Agrícola 34: 929-939.
Miranda, F.R.; Souza, F.; Ribeiro, R.S.F. 1999. Estimation of evapotranspiration and crop coefficients for melon crop cultivated in the coastal region, Ceará state. Engenharia Agrícola 18: 63-70 (in Portuguese, with abstract in English). Miranda, F.R.; Gondim, R.S.; Freitas, J.A.D.; Pinheiro Neto, L.G.
2008. Melon crop irrigation. p. 153-166. In: Braga Sobrinho, R.; Guimarães, J.A.; Freitas, J.A.D.; Terao, D., eds. Integrated production of melon. Embrapa Agroindústria Tropical, Fortaleza, CE, Brazil (in Portuguese).
Payero, J.O.; Neale, C.M.U.; Wright, J.L.; Allen, R.G. 2003. Guidelines for validating Bowen ratio data. Transactions of the ASAE 46: 1051-1060.
Penman, H.L.; Angus, D.E.; Bavel, C.H.M. 1967. Microclimatic factors affecting evaporation and transpiration. p. 483-505. In: Hagan, R.M.; Haise, H.R.; Edminster, T.W., eds. Irrigation of agricultural lands. American Society of Agronomy, Madison, WI, USA.
Perez, P.J.; Castellvi, F.; Ibañez, M.; Rosell, J.I. 1999. Assessment of reliability of Bowen ratio method for partitioning fluxes. Agricultural and Forest Meteorology 97: 141-150.
QIN, S.; Zhang, J.; Dai, H.; Wang, D.; Li, D. 2014. Effect of ridge–furrow and plastic-mulching planting patterns on yield formation and water movement of potato in a semi-arid area. Agricultural Water Management 131: 87-94.
Shrestha, N.K.; Shukla, S. 2014. Basal crop coefficients for vine and erect crops with plastic mulch in a sub-tropical region. Agricultural Water Management 143: 29-37.
Teixeira, A.H.C.; Bastiaanssen, W.G.M.; Moura, M.S.B.; Soares, J.M.; Ahmad, M.D.; Bos, M.G. 2008. Energy and water balance measurements for water productivity analysis in irrigated mango trees, northeast Brazil. Agricultural and Forest Meteorology 148: 1524-1537.
Zhang, B.; Kang, S.; Li, F.; Tong, L.; Du, T. 2010. Variation in vineyard evapotranspiration in an arid region of northwest China. Agricultural Water Management 97: 1898-1904. Zeggaf, A.T.; Takeuchi, S.; Dehghanisanij, H.; Anyoji, H.; Yano, T.