Correlations between pulse oximetry and
peak expiratory flow in acute asthma
1Departamento de Pediatria, Faculdade de Medicina,
Universidade Federal de Minas Gerais, Belo Horizonte, MG, Brasil
2Departamento de Saúde Materna e Infantil, Faculdade de Medicina,
Universidade Federal de Juiz de Fora, Juiz de Fora, MG, Brasil C. Ribeiro de Andrade1,
M.C. Duarte2
and P. Camargos1
Abstract
Few studies are available concerning correlations between pulse oximetry and peak expiratory flow in children and adolescents with acute asthma. Although the Global Initiative for Asthma states that measurements of lung function and oximetry are critical for the assessment of patients, it is not clear if both methods should necessar-ily be included in their evaluation. Since there is a significant differ-ence in cost between pulse oximetry equipment and peak expiratory flow devices, we determined whether clinical findings and peak expiratory flow measurements are sufficient to determine the severity of acute asthma. The present prospective observational study was carried out to determine if there is correlation between pulse oximetry and peak expiratory flow determination in 196 patients with acute asthma aged 4 to 15 years diagnosed according to the Global Initiative for Asthma criteria. Patients experiencing their first or second wheez-ing episode, with fever, related acute or chronic diseases, and unable to perform the peak expiratory flow maneuver were excluded. Meas-urements of peak expiratory flow and pulse oximetrywere performed at admission and after 15 min of each inhaled salbutamol cycle. Correlations obtained by linear regression using the Pearson correla-tion coefficients (r) were 0.41 (P < 0.0001), 0.53 (P < 0.0001), 0.51 (P < 0.0001), and 0.61 (P < 0.0001) at admission and after the first, second and third cycles of salbutamol, respectively. These correla-tions showed that one measure cannot substitute the other (Pearson’s coefficient <0.7), probably because they evaluate different aspects in the airways, suggesting that peak expiratory flow should not be used alone in the assessment of acute asthma in children and adolescents. Correspondence
P. Camargos
Departamento de Pediatria Faculdade de Medicina, UFMG Av. Alfredo Balena, 190, Sala 4061 30130-100 Belo Horizonte, MG Brasil
Fax: +55-31-3248-9664
E-mail: [email protected]
Received March 28, 2006 Accepted January 15, 2007
Key words
•Acute asthma •Pulse oximetry •Peak expiratory flow
Introduction
Clinical findings are usually insufficient to properly determine the severity of acute
asthma (1-9).Significant changes in lung
function may be present despite the lack of clinical manifestations (1,2,6), as first
re-ported in the 1970’s (1) and confirmed by subsequent studies (2-9). The severity of acute asthma is classified as mild, moderate, severe, and very severe based on clinical and functionalcriteria (10), the most widely used being pulse oximetry (SpO2) and peak
Few reports are available about possible correlations between these two methods in children and adolescents. Although the Glo-bal Initiative for Asthma (GINA) states that measurements of lung function and oxim-etry are critical for patient assessment (10),it is not clear whether both methods should be included in the evaluation of acute asthma, since no critical comparison of the two meas-urements has been done.
Since there is a significant difference in costs between SpO2 equipment and PEF
de-vices, with SpO2 being about 20 times more
expensive, it seems reasonable to determine whether clinical findings and PEF measure-ments are sufficient to assess the severity of acute asthma. Thus, the objective of the present study was to determine the correla-tion between SpO2 and PEF in children and
adolescents with acute asthma in order to
determine whether SpO2, the more
expen-sive procedure, could be avoided in the evalu-ation of exacerbevalu-ations. The answer may be particularly relevant in low-income coun-tries, where the two measurements are not performed routinely in emergency depart-ments.
Material and Methods
In this prospective cohort study, 196 con-secutive patients with acute asthma were evaluated. The patients were admitted to an emergency room where they were treated with standard doses of inhaled salbutamol.
Inclusion and exclusion criteria
Since most asthma exacerbations are clas-sified as mild or moderate (10),patients with this level of severity, aged 4 to 15 years, and with PEF between 50 and 80% of the pre-dicted value at admission were studied. Pa-tients experiencing their first or second wheezing episode, patients with axillary tem-perature of 38ºC or higher, with related acute or chronic diseases, and patients unable to
perform the PEF maneuver were excluded. Each patient was included only once in the study protocol.
Pulse oximetry and peak expiratory flow
SpO2 was measured with a Palco
oxime-ter model 30 (Palco Laboratories, Inc., Santa Cruz, CA, USA) at admission to the emer-gency room and after 15 min of each bron-chodilator cycle. The sensor was adapted to the patient’s left thumb. Single point values were recorded in order to ensure a high-quality pulse signal and no movement arti-facts.
PEF was measured with a peak flow meter (Mini Wright Peak Flow Meter; Clem-ent Clarke International Ltd., Harlow, Essex, England) on a non-linear scale ranging from 30 to 400 L/min. The best of three standing PEF values was recorded and the results were compared to the reference values de-scribed by Godfrey et al. (11).
Measurements were performed at admis-sion and after 15 min of each inhaled
salbu-tamol cycle. PEF and SpO2 were measured
by an observer unaware of the study aims.
Acute asthma treatment
Patients received up to three cycles of salbutamol delivered either by an oxygen-driven nebulizer or by a pressurized me-tered-dose inhaler attached to a spacer. Those treated with the oxygen-driven nebulizer re-ceived 0.15 mg kg-1 dose-1 (minimum: 1.25
mg/dose; maximum: 5 mg/dose). The drug was diluted in 0.9% sodium chloride to a final volume of 4 mL. Nebulization was performed up to 15 min, with the device connected to the oxygen source and at a flow of 6 L/min. Those treated with the pressur-ized metered-dose inhaler attached to a valved spacer received 5 puffs (500 µg) in each treatment cycle.
measure-ments, approximately 15 min after each sal-butamol cycle. Emergency room discharge was conditioned to a satisfactory therapeutic response represented by improvement of one or more of the following factors: cough, wheezing, shortness of breath, decreased respiratory frequency, respiratory effort, and increased SpO2 and PEF values.
Statistical analysis
Sample size. Since in three previous stud-iesthe correlation coefficient (r) ranged from -0.16 to 0.43 for SpO2 and PEF (12-14),an
intermediate value was taken (r = 0.25) for the calculation of sample size. Assuming an alpha error of 0.05 and a beta error of 0.10 (power equal to 90%), a sample size of 164 patients was required (15).
Analysis. Descriptive statistics were cal-culated on the basis of frequency distribu-tion and by the Student t-test. Linear regres-sion analysis was used to determine the
rela-tionship between SpO2 measurements and
predicted PEF values at admission and after each bronchodilator cycle. A P value <0.05 was considered significant.
Ethics
The study protocol was approved by the Research Ethics Committee of the Federal University of Minas Gerais and the parents or persons responsible for the children gave written informed consent.
Results
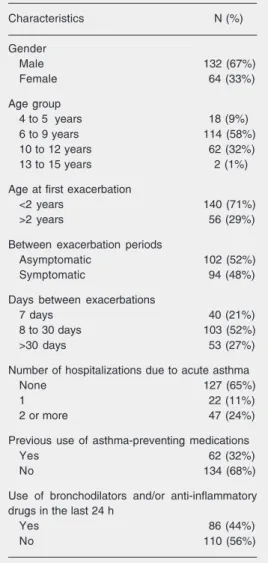
Table 1 presents the demographic and clinical characteristics of the 196 patients studied. Boys predominated in the study population with a 2:1 ratio. Age ranged from 4 to 15 years (mean ± SD: 8.7 ± 2.19 years). Regarding asthma characteristics, the first exacerbation occurred before two years of age in 71.4% of the patients and only ap-proximately 50% of the subjects were
asymp-Table 1. Characteristics of the study population.
Characteristics N (%)
Gender
Male 132 (67%)
Female 64 (33%)
Age group
4 to 5 years 18 (9%)
6 to 9 years 114 (58%)
10 to 12 years 62 (32%)
13 to 15 years 2 (1%)
Age at first exacerbation
<2 years 140 (71%)
>2 years 56 (29%)
Between exacerbation periods
Asymptomatic 102 (52%)
Symptomatic 94 (48%)
Days between exacerbations
7 days 40 (21%)
8 to 30 days 103 (52%)
>30 days 53 (27%)
Number of hospitalizations due to acute asthma
None 127 (65%)
1 22 (11%)
2 or more 47 (24%)
Previous use of asthma-preventing medications
Yes 62 (32%)
No 134 (68%)
Use of bronchodilators and/or anti-inflammatory drugs in the last 24 h
Yes 86 (44%)
No 110 (56%)
Data are reported as number of patients with per-cent in parentheses.
tomatic between exacerbations and had acute attacks at 8- to 30-day intervals. Previous asthma hospitalization and use of antiasth-matic medicines was reported by about one third of the patients. Bronchodilators and/or antibiotics had been used within 24 h pre-ceding emergency room admission by 86 patients, although none within 8 h or less.
Table 2 shows SpO2 and PEF values at
admission and after three cycles of
bron-chodilator treatment. The mean ± SD SpO2
The mean PEF was 61.8 ± 10.60 at admis-sion and 80.2 ± 13.09% after the first treat-ment cycle (P < 0.001). In the present study, only 4% of the subjects showed a decrease in SpO2 after the first salbutamol cycle.
All correlations between SpO2 and PEF
(% predicted value) determined by the
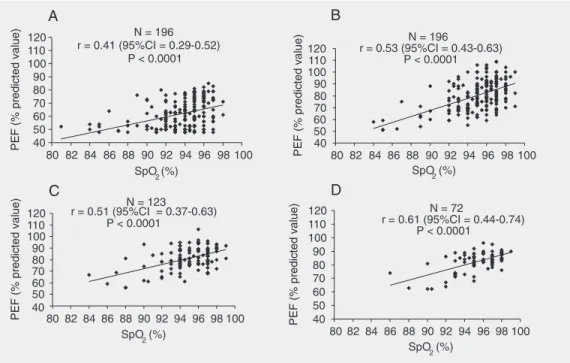
Pear-son coefficient were statistically significant during any phase of treatment (P < 0.001) but to a moderate extent, with “r” values of 0.41, 0.53, 0.51, and 0.61 at admission and after the first, second and third salbutamol cycle, respectively. Regarding the determi-nation coefficient (R2), the values obtained
were statistically significant (P < 0.0001) at admission and after each salbutamol cycle. Values found at admission and after the first, second, and third cycles were 0.17, 0.29, 0.26, and 0.37, respectively, as shown in Figure 1.
Figure 1 shows the four scattergrams corresponding to each assessment. The Pear-son coefficients with their respective P val-ues and 95% confidence intervals are also shown.
A positive correlation can be observed between the two measurements at admission and after each salbutamol cycle. Since only patients suffering from mild to moderate acute asthma were admitted to the study, most points observed in the scattergrams were concentrated in values ranging from 92
to 98% and from 70 to 95% for SpO2 and
PEF, respectively. However, in 25% of the
Figure 1. Scattergrams plotting pulse oximetry and peak expira-tory flow. A, At admission (N = 196). B, First cycle (N = 196). C, Second cycle (N = 123). D, Third cycle (N = 72). PEF = peak expi-ratory flow; SpO2 = pulse
oxim-etry; r = Pearson correlation co-efficients; CI = confidence inter-val.
Table 2. Pulse oximetry and peak expiratory flow reported as percent predicted values at admission and after each of the three salbutamol cycles.
Mean ± SD
Admission (N = 196)
SpO2 93.6 ± 2.9
PEF 61.8 ± 10.6
After 1st cycle (N = 196)
SpO2 95.0 ± 2.7
PEF 80.2 ± 13.1
After 2nd cycle (N = 123)
SpO2 94.8 ± 2.7
PEF 81.0 ± 9.9
After 3rd cycle (N = 72)
SpO2 95.2 ± 2.4
PEF 82.1 ± 7.6
SpO2 = pulse oximetry; PEF = peak expiratory
subjects discrepancies were observed for both SpO2 <95% and PEF ≥80% of the predicted
value and vice versa. Some patients with PEF values above 70% of the predicted value
showed low SpO2 values. Furthermore, 6%
of the patients presented SpO2 <90% and
PEF ≥60% of the predicted value.
Discussion
The correlations between SpO2 and PEF
values obtained in the present study were statistically significant in every salbutamol cycle. There are few reports in the literature concerning the use of both measurements in acute asthma, although GINA and most Bra-zilian asthma guidelines recommend both for the management of patients with acute asthma in emergency rooms.
Only three studies have measured the correlation between SpO2 and PEF in acute
asthma in childhood and adolescence (12-14). All of them have different methodolo-gies compared with the present study and in only one study the investigators performed sequential assessments of SpO2 and PEF (13) as we did. Kano and Nishima (13) de-tected a correlation in only 52 patients aged 6 to 16 years before and after one bronchodi-lator cycle, obtaining r = 0.47 and 0.52, respectively (P < 0.0001). Their limited num-ber of subjects should be taken into consid-eration. Yamamoto et al. (14), in a study of 632 patients aged 5 to 20 years with acute wheezing episodes, obtained r = 0.41 at ad-mission, a value similar to that obtained in the present study (P < 0.0001). However, these investigators included subjects who did not have asthma. Patients with viral
res-piratory infections and Mycoplasma
pneu-moniae, croup, chronic lung disease, and bronchopulmonary dysplasia were enrolled in their study, which could cause different physiopathological processes, for instance, similar abnormalities in proximal and distal airways, resulting in different correlations
between SpO2 and PEF. Finally, Connett
and Lenney(12)assessed only 26 children
with severe acute asthma and obtained nega-tive correlation coefficients, i.e., r = -0.16 and -0.10, with no statistical significance. Because in their study mean predicted PEF value at admission was only 28.3%, its ex-ternal validity can be questioned, consider-ing that most patients sufferconsider-ing from acute asthma admitted in emergency rooms did not present such low PEF values.
We found patients with high values of PEF and less than 91% SpO2 and vice versa.
These findings conflict with the values pro-posed by GINA to classify asthma severity and may make some contribution to the un-derstanding of these values in acute asthma. The lack of a higher correlation between PEF and SpO2 may be ascribed to the type of
events assessed by the two methods. Some investigators have suggested that PEF may partially reflect phenomena observed in acute asthma, i.e., only changes observed in the proximal airways (5,16). In contrast, SpO2
may indirectly reflect the ventilation/perfu-sion mismatch, expressing alterations ob-served in both proximal and distal airways (5,16). Therefore, the presence of normal PEF values in patients with acute asthma does not exclude the possibility of important abnormalities that may go unnoticed by pa-tients and physicians.
This view is substantiated by the differ-ent patterns observed for the two measure-ments throughout the treatment of acute asthma. Generally, PEF improvement can be more pronounced and faster than SpO2.
needed to heal the inflammatory process, which has a rather more indolent behavior.
Mihatsch et al. (19), assessing 28 chil-dren with acute asthma aged 4 to 14 years, observed that PEF was stabilized 12 h before SpO2, which was normalized 48 h later. In
addition, Wagner et al. (20) reported a poor association between spirometric alterations and abnormalities in gas exchanges in acute asthma. These investigators stated that the correlation between these parameters tends to improve gradually as the treatment pro-gresses, and concluded that the degree of obstruction in the small airways may differ
from those in medium and large airways, explaining the r values detected in the pres-ent study.
The moderate correlation between SpO2
and PEF measurements found in the present study supports the view that PEF partially reflects the complex physiopathological find-ings observed in acute asthma. Therefore, when assessing a patient suffering from an acute attack, the physician should be
en-couraged to perform both SpO2 and PEF
tests in order to define the most adequate treatment.
References
1. McFadden ER Jr, Kiser R, deGroot WJ. Acute bronchial asthma. Relations between clinical and physiologic manifestations. N Engl J Med 1973; 288: 221-225.
2. Rodrigo G, Rodrigo C. Assessment of the patient with acute asthma in the emergency department. A factor analytic study. Chest 1993; 104: 1325-1328.
3. Bishop J, Carlin J, Nolan T. Evaluation of the properties and reliabil-ity of a clinical severreliabil-ity scale for acute asthma in children. J Clin Epidemiol 1992; 45: 71-76.
4. van der Windt DA, Nagelkerke AF, Bouter LM, Dankert-Roelse JE, Veerman AJ. Clinical scores for acute asthma in pre-school chil-dren. A review of the literature. J Clin Epidemiol 1994; 47: 635-646. 5. Kerem E, Canny G, Tibshirani R, Reisman J, Bentur L, Schuh S, et al. Clinical-physiologic correlations in acute asthma of childhood.
Pediatrics 1991; 87: 481-486.
6. Luaces CC, Garcia Garcia JJ, Garron TP, Sanchez Mora ML, Camacho DE. The usefulness of a clinical scoring system and pulse oximetry (SaO2) in assessing the severity of asthmatic crises. An Esp Pediatr 1996; 44: 429-432.
7. Rahnama’i MS, Geilen RP, Singhi S, van den Akker M, Chavannes NH. Which clinical signs and symptoms predict hypoxemia in acute childhood asthma? Indian J Pediatr 2006; 73: 771-775.
8. Boychuk RB, Yamamoto LG, Demesa CJ, Kiyabu KM. Correlation of initial emergency department pulse oximetry values in asthma se-verity classes (steps) with the risk of hospitalization. Am J Emerg Med 2006; 24: 48-52.
9. Cabral AL, Conceicao GM, Saldiva PH, Martins MA. Effect of asthma severity on symptom perception in childhood asthma. Braz J Med Biol Res 2002; 35: 319-327.
10. National Heart LaBI. Global initiative for asthma. Global strategy for
asthma management and prevention. Bethesda: National Institutes of Health; 2002.
11. Godfrey S, Kamburoff PL, Nairn JR. Spirometry, lung volumes and airway resistance in normal children aged 5 to 18 years. Br J Dis Chest 1970; 64: 15-24.
12. Connett GJ, Lenney W. Use of pulse oximetry in the hospital man-agement of acute asthma in childhood. Pediatr Pulmonol 1993; 15: 345-349.
13. Kano S, Nishima S. Relationship between PEF and SpO2 on acute
asthma attack in children. Arerugi 1997; 46: 1265-1272.
14. Yamamoto LG, Wiebe RA, Anaya C, Chang RK, Chang MA, Terada AM, et al. Pulse oximetry and peak flow as indicators of wheezing severity in children and improvement following bronchodilator treat-ments. Am J Emerg Med 1992; 10: 519-524.
15. Hulley SB, Cummings SR. Designing clinical research. Baltimore: Williams & Wilkins; 1988.
16. Roca J, Ramis L, Rodriguez-Roisin R, Ballester E, Montserrat JM, Wagner PD. Serial relationships between ventilation-perfusion in-equality and spirometry in acute severe asthma requiring hospital-ization. Am Rev Respir Dis 1988; 137: 1055-1061.
17. McFadden ER Jr. Clinical physiologic correlates in asthma. J Allergy Clin Immunol 1986; 77: 1-5.
18. Male I, Richter H, Seddon P. Children’s perception of breathless-ness in acute asthma. Arch Dis Child 2000; 83: 325-329.
19. Mihatsch W, Geelhoed GC, Landau LI, LeSouef PN. Time course of change in oxygen saturation and peak expiratory flow in children admitted to hospital with acute asthma. Thorax 1990; 45: 438-441. 20. Wagner PD, Hedenstierna G, Rodriguez-Roisin R. Gas exchange,