Rev Bras Ter Intensiva. 2009; 21(4):349-352
Comparison between respiratory pulse oximetry
plethysmographic waveform amplitude and
arterial pulse pressure variations among patients
with and without norepinephrine use
Comparação entre as variações respiratórias da amplitude de
onda pletismográica da oximetria de pulso e do pulso arterial em
pacientes com e sem uso de norepinefrina
ORIGINAL ARTICLE
INTRODUCTION
Cardiovascular shock is a condition that results from inadequate blood low. he standard therapeutic approach is venous hydration, which has proven to alter mortality in patients with septic shock when initiated early.(1) However, a
substantial number of patients with shock are non-responsive to luid replace-ment therapy,(2) and the excess luids can generate pulmonary and peripheral
edema, which can negatively afect prognosis, particularly in patients with in-creased pulmonary permeability.(3)
Fluid responsiveness is determined by the change in cardiac output caused by volume infusion. By deinition, a patient responds to a luid challenge when the cardiac output rises 15% after infusion of 500 ml of colloid solution.(4) Historically,
Guilherme Loures de Araújo Penna1, Paula Araujo Rosa2, Pedro
Martins Pereira Kurtz1, Fabricio
Braga2, Gustavo Ferreira Almeida2,
Marcia Freitas2, Luis Eduardo
Drumond2, Ronaldo Vegni e Souza2,
Michel Schatkin Cukier2, André
Salgado2, Clóvis Faria2, José Kezen2,
André Miguel Japiassú2, Marcelo
Kalichsztein2, Gustavo Nobre2
1- Physician – Master in Internal Medicine - Casa de Saúde São José – Intensive Care Service – Rio de Janeiro (RJ), Brazil.
2- Physician - Casa de Saúde São José – Intensive Care Service – Rio de Janeiro - (RJ), Brasil.
ABSTRACT
Objectives: Arterial pulse pressure respiratory variation is a good predictor of luid response in ventilated patients. Recently, it was shown that respiratory variation in arterial pulse pressure cor-relates with variation in pulse oximetry plethysmographic waveform amplitude. We wanted to evaluate the correlation between respiratory variation in arte-rial pulse pressure and respiratory varia-tion in pulse oximetry plethysmographic waveform amplitude, and to determine whether this correlation was inluenced by norepinephrine administration.
Methods: Prospective study of sixty patients with normal sinus rhythm on me-chanical ventilation, profoundly sedated and with stable hemodynamics. Oxygen-ation index and invasive arterial pressure were monitored. Respiratory variation in arterial pulse pressure and respiratory vari-ation in pulse oximetry plethysmographic waveform amplitude were recorded simul-taneously in a beat-to-beat evaluation, and
were compared using the Pearson coef-icient of agreement and linear regression.
Results: hirty patients (50%) re-quired norepinephrine. here was a sig-niicant correlation (K = 0.66; p < 0.001) between respiratory variation in arterial pulse pressure and respiratory variation in pulse oximetry plethysmographic wave-form amplitude. Area under the ROC curve was 0.88 (range, 0.79 – 0.97), with a best cutof value of 14% to predict a respiratory variation in arterial pulse pres-sure of 13. he use of norepinephrine did not inluence the correlation (K = 0.63, p
= 0.001, respectively).
Conclusions: Respiratory variation in arterial pulse pressure above 13% can be accurately predicted by a respiratory variation in pulse oximetry plethysmo-graphic waveform amplitude of 14%. he use of norepinephrine does not alter this relationship.
Keywords: Hemodynamic; Oxim-etry; Blood pressure; Plethysmography; Respiration, artiicial; Norepinephrine
Received from Casa de Saúde São José – Rio de Janeiro (RJ), Brazil.
No disclosures.
Submitted on May 16, 2008 Accepted on October 27, 2009
Author for correspondence: Guilherme Loures de Araújo Penna Rua Dona Mariana 143, sala B31 – Botafogo
CEP: 22280-020 – Rio de Janeiro (RJ), Brazil.
350 Penna GLA, Rosa PA, Kurtz PMP, Braga F, Almeida GF, Freitas M et al.
Rev Bras Ter Intensiva. 2009; 21(4):349-352
studies have attempted to demonstrate luid responsiveness with diferent hemodynamic monitoring methods. However, measurements of venous central pressure, pulmonary capil-lary wedge pressure, or their variations, did not forecast re-sponsiveness to volume.(5) On the other hand, measurements
of respiratory variations in systemic pulse pressure (∆PP) has proven to be a reliable method for predicting the outcome of luid challenge, with a predictive cutof value of 13%.(6)
However, in order to measure ∆PP, invasive monitoring of the mean arterial pressure is necessary, which is associated with complications inherent to the procedure itself. In addi-tion, most patients do not have an intra-arterial catheter in place when hemodynamic instability manifests.
Pulse oximetry is a useful and universal tool at all intensive and emergency care units. he use of this curve as an instru-ment of hemodynamic analysis has been reported in previ-ous studies,(7-9) and a recent study has reported a relationship
between ∆PP and the pulse oximetry curve.(10) herefore, we
wanted to evaluate the relationship between ∆PP and respi-ratory variations in pulse oximetry plethysmographic wave-form amplitude (∆POP), and to determine the inluence of norepinephrine infusion on this relationship.
METHODS
he ethics committee of Casa de Saúde São José, Rio de Janeiro, Brazil, approved the protocol used in this study. Inclusion criteria were profoundly sedated patients or those under the efects of neuromuscular blockers in controlled mechanical ventilation, sinus rhythm, hemo-dynamic stability during the 15 minutes preceding the measurements, and pre-established invasive arterial pres-sure monitoring. he tidal volume for all patients was set to 8 mL/kg, according to Michard et al.(6)
Exclusion criteria were spontaneous ventilation, cardiac arrhythmia, and an inadequate pulse oximetry signal. POP waveform quality was considered suitable when the curve amplitude was superior to the minimum size for reliable SpO2 value (Figure 1). According to our protocol, the pulse oxymeter was placed on the fourth inger of the left hand and patients were positioned supine, with a zero degree incline.
Systolic and diastolic arterial pressures were measured us-ing a standard monitor (IntelliVueTM Patient Monitor MP60,
Phillips®) on a beat-to-beat basis, and PP was calculated as the
diference between systolic and diastolic pressures. Maximal and minimal values for systolic PP (PPmax and PPmin) were de-termined over a single respiratory cycle. ∆PP was calculated as follows(6): ∆PP = 100 ∆ (PP
max - PPmin) / [(PPmax + PPmin)/2].
POP waveforms were obtained using the oxymeter module of the same monitor. POP waveform amplitude was
mea-sured on a beat-to-beat basis as the vertical distance between the peak and the preceding valley trough in the waveform, and was expressed in millimeters (mm). Maximam POP (POPmax) and minimum POP (POPmin) were determined over the same respiratory cycle. he plethysmographic gain factor was constant throughout the procedure. ∆POP was calculated using a formula similar to that for ∆PP: ∆POP (%) = 100 × (POPmax – POPmin)/ [(POPmax + POPmin)/2]). PP and POP waveforms were printed and ∆PP and ∆POP were evaluated over three consecutive respiratory cycles.
Statistical analysis
Continuous variables were expressed as the median ± standard deviation (SD) and categories were expressed as percentages. For comparison of continuous variables, we used the Student’s t-test and the Mann Whitney test. he correlation between ∆PP and ∆POP was analyzed using the Pearson coeicient of agreement and linear regres-sion. ROC curves were constructed to determinate the best ∆POP cutof for a ∆PP of 13%. Kappa coeicient of agreement(11) (K) was estimated for the correlation
be-tween ∆PP >13% and the ∆POP above the best cutof value. he diagnostic utility was determined according to this value. K was calculated for one subgroup according to the use of norepinephrine.
RESULTS
he study group consisted of sixty patients with a mean age of 65 ± 17 years, who were on mechanical ventilation (Table 1). Among them, 30 patients (50%) required nor-epinephrine infusion (doses ranged from 0.01 mg/kg/min to 1.6 mg/kg/min).
Comparison between respiratory variations in patients with and without norepinephrine 351
Rev Bras Ter Intensiva. 2009; 21(4):349-352
was 0.88 (range, 0.79 – 0.97) with a best cutof value of 14% to predict a ∆PP of 13%. Kappa index of agreement was 0.66 (p < 0.001). Nineteen (31%) patients had ∆PP above 13% and 21 (35%) showed ∆POP above 14%.
In patients receiving norepinephrine, the ∆POP cutof of 14% had a sensitivity of 71.4%, a speciicity of 91.3%, a PPV of 71.4%, and an NPV of 91.3%, to predict ∆PP above 13% (K = 0.63; p = 0.001). In the group of patients who did not receive norepinephrine, sensitivity was 90.9%, speciic-ity was 78.9%, PPV was 71.4%, and NPV was 93.8% (K = 0.66; p < 0.001). Results are summarized in table 2.
DISCUSSION
Michard et al.(6) showed that in profoundly sedated patients
on controlled mechanical ventilation, with sinus rhythm, a ∆PP above 13% predicts responsiveness to luid challenge, de-ined as a raise in the cardiac output of 15% after the infusion of 500 ml of colloid solution, with a sensitivity of 94% and a speciicity of 96%. However, luid responsiveness does not necessarily imply hypovolemia, so not all patients who can re-spond to luid infusion actually need volume.
he rationale for luid challenge is based on the physi-ological consequences of the respiratory cycle in the ve-nous return during mechanical ventilation. When inspi-ration begins, the intra-thoracic pressure rises, causing venous return to the right atrium to decrease.(12) Cardiac
output of the right heart decreases so less blood reaches
the left heart. As a result, left heart output decreases, but this happens during expiration because inspiration ends when the blood ejected through the right ventricle is still in the pulmonary circulation.(13)
One advantage of using the ∆PP measurement is that it is minimally invasive. Patients in circulatory shock usually have arterial pressure monitored by an invasive means; how-ever, patients who develop shock rapidly or unexpectedly may not have an arterial line in place yet, despite already be-ing in an intensive care environment. he predictive value of ∆PP can be very valuable when deciding the therapeutic course of action for these patients. Our study demonstrated a signiicant correlation between ∆PP and ∆POP. he best value of ∆POP to predict a ∆PP of 13% was 14%. Since pulse oximetry is in widespread use in intensive care centers, no additional costs are incurred when seeking the relevant information to predict luid responsiveness.
One limitation to this method is that it depends on a good quality oximetry curve, which is not always pos-sible, especially in patients with compromised peripheral perfusion. However, when an adequate oximetry signal is obtained, the infusion of norepinephrine does not inlu-ence the agreement between ∆PP and ∆POP.
Moreover, although current technologies do not pro-vide for direct determination of ∆POP, which might lim-its lim-its use, the simple calculations required to determine ∆POP are an easy and efective means for predicting luid responsiveness.
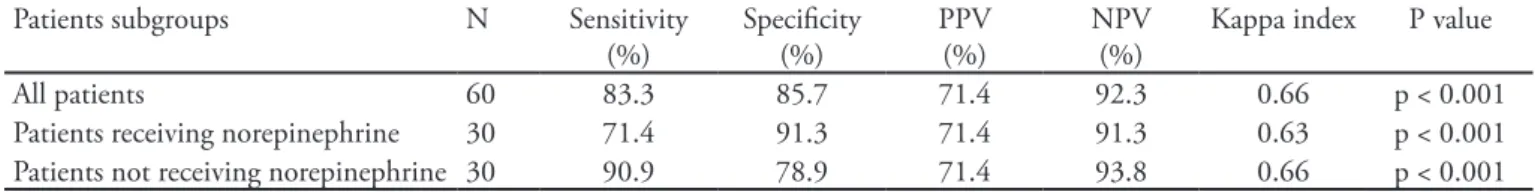
Table 2- Agreement between respiratory variations in pulse pressure and respiratory variations in pulse oximetry plethysmo-graphic waveform amplitude among all patients and diferent subgroups
Patients subgroups N Sensitivity (%)
Speciicity (%)
PPV (%)
NPV (%)
Kappa index P value
All patients 60 83.3 85.7 71.4 92.3 0.66 p < 0.001
Patients receiving norepinephrine 30 71.4 91.3 71.4 91.3 0.63 p < 0.001 Patients not receiving norepinephrine 30 90.9 78.9 71.4 93.8 0.66 p < 0.001
N - number of patients; ∆POP - respiratory variations in pulse oximetry plethysmographic waveform amplitude; ∆PP - respiratory variations in pulse pressure; PPV - positive predictive value; NPV - negative predictive value.
Table 1 - Demographic data and baseline values of hemodynamic, plethysmographic, and respiratory parameters
Parameter Value Range
Age (year) 65 ± 17 18 - 94
Weight (kg) 63 ± 13 45 - 85
Height (cm) 165 ± 10 150 - 182
Mean arterial pressure (mmHg) 83 ± 12 59 - 118
Heart beats/min 89 ± 18 51 - 145
∆PP (%) 12 ± 11 0 - 52
∆POP (%) 12 ± 11 0 - 66
352 Penna GLA, Rosa PA, Kurtz PMP, Braga F, Almeida GF, Freitas M et al.
Rev Bras Ter Intensiva. 2009; 21(4):349-352 CONCLUSION
In intensive care patients, a ∆POP value of 14% can efectively predict a ∆PP value of 13%. his method could be useful for evaluating patients without an arterial cath-eter in place. Norepinephrine administration does not afect the relationship between ∆PP and ∆POP, preserv-ing the predictive value of ∆POP in patients who have received norepinephrine.
RESUMO
Objetivos: A variação respiratória da pressão arterial é um bom preditor da resposta a luidos em pacientes ventilados. Foi recentemente demonstrado que a variação respiratória na pres-são arterial de pulso se correlaciona com a variação da amplitude da onda pletismográica da oximetria de pulso. Nossa intenção foi avaliar a correlação entre a variação respiratória da pressão arterial de pulso e a variação respiratória na amplitude da onda pletismográica da oximetria de pulso, e determinar se esta cor-relação foi inluenciada pela administração de norepinefrina.
Métodos: Estudo prospectivo de sessenta pacientes com
rit-mo sinusal normal sob ventilação mecânica, profundamente seda-dos e hemodinamicamente estáveis. Foram monitoraseda-dos o índice de oxigenação e pressão arterial invasiva. A variação respiratória da pressão do pulso e a variação respiratória da amplitude da onda pletismográica na oximetria de pulso foram registradas simulta-neamente batimento a batimento, e foram comparadas utilizando o coeiciente de concordância de Pearson e regressão linear.
Resultados: Trinta pacientes (50%) necessitaram de norepi-nefrina. Ocorreu uma correlação signiicante (K=0,66; p<0,001) entre a variação respiratória na pressão arterial de pulso e a va-riação respiratória na amplitude de onda pletismográica na oxi-metria de pulso. A área sob a curva ROC foi de 0,88 (variando de 0,79-0,97) com melhor valor de corte de 14% para prever uma variação respiratória na pressão arterial de pulso de 13. O uso de norepinefrina não inluenciou esta correlação (K=0,63; p=0,001, respectivamente).
Conclusões: Uma variação respiratória na pressão do pulso arterial acima de 13% pode ser prevista com precisão por meio de uma variação respiratória da amplitude de onda pletismográ-ica na oximetria de pulso de 14%. O uso de norepinefrina não modiica este relacionamento.
Descritores: Hemodinâmica; Oximetria; Pressão arterial; Pletismograia; Respiração artiicial; Norepinefrina
REFERENCES
1. Rivers E, Nguyen B, Havstad S, Ressler J, Muzzin A, Kno-blich B, Peterson E, Tomlanovich M; Early Goal-Directed herapy Collaborative Group. Early goal-directed therapy in the treatment of severe sepsis and septic shock. N Engl J Med. 2001;345(19):1368-77.
2. Pinsky MR, Teboul JL. Assessment of indices of pre-load and volume responsiveness Curr Opin Crit Care. 2005;11(3):235-9. Erratum in: Curr Opin Crit Care. 2005;11(4):400. Teboul, Jean-Louise [added].
3. National Heart, Lung, and Blood Institute Acute Res-piratory Distress Syndrome (ARDS) Clinical Trials Network, Wiedemann HP, Wheeler AP, Bernard GR, hompson BT, Hayden D, deBoisblanc B, Connors AF Jr, Hite RD, Harabin AL. Comparison of two luid-ma-nagement strategies in acute lung injury. N Engl J Med. 2006;354(24):2564-75.
4. Stetz CW, Miller RG, Kelly GE, Rain TA. Reliabili-ty of thermodilution method in the determination of cardiac output in clinical practice. Am Rev Respir Dis. 1982;126(6):1001-4.
5. Kumar A, Anel R, Bunnell E, Habet K, Zanotti S, Marshall S, et al. Pulmonary artery occlusion pressure and central venous pressure fail to predict ventricular illing volume, cardiac performance, or the response to volume infusion in normal subjects. Crit Care Med. 2004;32(3):691-9.
6. Michard F, Boussat S, Chemla D, Anguel N, Mercat A, Lecarpentier Y, et al. Relation between respiratory changes in arterial pulse pressure and luid responsiveness in septic patients with acute circulatory failure. Am J Respir Crit Care Med. 2000;162(1):134-8.
7. Hertzman AB, Spealman CR. Observations on the inger volume pulse recorded photo-electrically. Am J Physiol. 1937;119:334-5.
8. Partridge BL. Use of pulse oximetry as a noninvasive in-dicator of intravascular volume status. J Clin Monit. 1987;3(4):263-8.
9. Lima A, Bakker J. Noninvasive monitoring of peripheral perfusion. Intensive Care Med. 2005;31(10):1316-26. 10. Cannesson M, Besnard C, Pierre G, Duran PG, Bohé J,
Jacques D. Relation between respiratory variations in pulse oximetry plethysmographic waveform amplitude and ar-terial pulse pressure in ventilated patients. Critical Care. 2005;9(5):R562-8.
11. Landis JR, Koch GG. he measurement of observer agree-ment for categorical data. Biometrics. 1977;33(1):159-74. 12. Morgab BC, Martin WE, Hornbein TF, Crawford
EW, Guntheroth WG. Hemodynamic efects of inter-mittent positive pressure respiration. Anesthesiology. 1966;27(5):584-90.