Printed in Brazil - ©2005 Sociedade Brasileira de Química 0103 - 5053 $6.00+0.00
Article
* e-mail: [email protected]
Solvent and Molecular Weight Effects on Fluorescence Emission of MEH-PPV
R. F. Cossielloa, L. Akcelrudb,c and T. D. Z. Atvars*,a
a
Instituto de Química, Universidade Estadual de Campinas, CP 6154, 13084-971 Campinas - SP, Brazil
b
Departamento de Química, Universidade Federal do Paraná, CP 19081, 81531-990 Curitiba - PR, Brazil
c
Instituto de Tecnologia para o Desenvolvimento, LACTEC, CP 19067, 81531-990 Curitiba - PR, Brazil
Nesse trabalho se estudou sistematicamente o efeito de dois bons solventes sobre os espectros de excitação e de fluorescência em condições fotoestacionárias do MEH-PPV com três massas molares diferentes, —Mn = 51 kg mol-1, —M
n = 86 kg mol
-1 and —M
n = 125 kg mol
-1, em soluções com
várias concentrações, desde muito diluídas, e em estado sólido, na forma de filmes produzidos a partir da evaporação de solventes. Dois bons solventes (clorofórmio e tolueno) foram escolhidos a partir da comparação dos seus parâmetros de solubilidade com o do MEH-PPV estimado a partir dos modelos de Small, de van Krevelen e de Hoy. Os espectros de fluorescência foram obtidos para soluções em várias concentrações (10-8 mol L-1 – 10-4 mol L-1) e em filmes produzidos por espalhamento
de soluções, mostrando diferenças que decorrem da diferente forma de solvatação das cadeias pelos diferentes solventes. Um deslocamento espectral para o vermelho foi observado em concentrações mais altas 10-6 mol L-1 e pode ser explicado pela regra de Kasha para uma orientação anti-paralela dos
momentos de transição dos dois cromóforos. As conformações em solução são parcialmente mantidas no estado sólido alem do fato de que os espectros se deslocam para o vermelho e são atribuídos à formação de agregados. Recozimento dos filmes em temperaturas acima da transição vítrea elimina as conformações mais tensionadas das cadeias, apaga o efeito de memória e leva a espectros de fluorescência mais finos.
Here we systematically studied the excitation and the fluorescence steady-state spectroscopy of poly(2-methoxy-5(2’-ethylhexyloxy)-1,4-phenylenevinylene) (MEH-PPV) with three molecular weights, —Mn = 51 kg mol-1, —M
n = 86 kg mol
-1 and —M
n = 125 kg mol
-1, in two equally good solvents
and several concentrations, from dilute solutions to solid-state films produced by casting. The appropriateness of the two solvents was established by comparing their solubility parameters and the solubility parameter of the MEH-PPV estimated using the Small, the Van Krevelen and the Hoy models. Thus, chloroform and toluene were chosen. Fluorescence spectra were recorded for solutions in several concentrations (10-8 mol L-1 to 10-4 mol L-1) and films produced by casting, showing that
chloroform and toluene solvate the polymer chain differently. Diluted solutions (10-8 mol L-1) in
chloroform exhibit broader fluorescence spectra. A red-shift of the fluorescence spectra was observed for concentrations higher than 10-6 mol L-1 that can be explained using Kasha’s rule for the sandwich
anti-parallel orientation of the transition moments of the two chromophores. The conformations observed in solutions are partially retained in the solid films in addition to the broader red-shift spectra attributed to aggregated forms of the macromolecular segments. Annealing of the polymer films at the glass transition temperature eliminates the more stressed conformations, erases the memory and leads to sharper fluorescence spectra.
Keywords: MEH-PPV, solvent effects, fluorescence, aggregation
Introduction
Electroluminescent organic molecules are a new class of compounds with very interesting properties since they undergo emission over a wide spectral range, from the
violet to the red.1 They can also be combined in several different forms to produce white light. One category of organic material with electroluminescence properties is conjugated organic polymers, in particular poly(1,4-phenylvinylene), PPV.2,3
conjugated soluble electroluminescent polymers that combine the wide spectral emission range common to the organic molecular compounds, with easy processability and good mechanical properties. Solubility after deriva-tization is due to the lowering of the interchain interactions. One of the first soluble PPV derivatives, reported in 1991 was poly(2-methoxy-5(2’-ethyl-hexyloxy)-1,4-phenylenevinylene) (MEH-PPV) (Scheme 1).4,5 Since then, this polymer has been extensively explored regarding various aspects of its physical properties.6 One important aspect of the emission properties of MEH-PPV is the assignment of its emissive centers. Apart from the intrinsic chemical composition and macro-molecular architecture, the emission wavelength and electroluminescence efficiency depend on two main parameters: (i) the torsion angle of the conjugated backbone, which determines the conjugation length;7 (ii) the occurrence of interchain interactions, leading to the formation of excimers, aggregates, and/or polaron pairs (here we adopt the same definitions proposed by T-Q Nguyen et al.10 for excimers and aggregates in MEH-PPV films: “a species in the electronic state, involving intra- or inter-chains interactions, that modifies the fluorescence spectrum and decrease true photoluminescence quantum yield”). Electroluminescence efficiency of these species is depleted since they generate alternative pathways for light emission due to energy or charge migration to non-radiative states.8-21 In addition, films processed by different techniques are also morphologically different22,23 and performance reproducibility requires further studies.
Several studies with MEH-PPV are reported showing the photoluminescence in solutions and in films prepared by distinct techniques (spin coating and casting from solutions) in an attempt to understand the morphology of the films and to optimize the performance of the electroluminescent device.24-28 The role of the solvent depends on its solvation power as a whole, as well as on its selectivity: it has been shown that some solvents, like THF and chloroform, have a preference for MEH-PPV ramifications, while others, like chlorobenzene, xylene and toluene, mainly solvate the polymer backbone, resulting in different macromolecular conformations.8,29-32 This way,
the distribution of the effective conjugation length and, consequently, the emission profile are changed. Moreover, the conformations in solution are partially maintained in the polymer films prepared from distinct solvents (memory effect).22,23,33
Here we report the systematic study of the concentration on the photophysical properties of MEH-PPV films with three molecular weights in an attempt to describe the evolution of the aggregation process. We have systematically studied the photophysical properties of MEH-PPV films produced by solutions of different concentrations to follow the sequential aggregation and to explain the memory effect in films. Using two equally good solvents, we have attempted to explain why they were able to produce morphologically different films and why the differences found in solution persisted in the films of these MEH-PPV samples. The criterion to select the solvents (chloroform and toluene) was the solubility parameter for MEH-PPV, which has been evaluated. Some physical characteristics of the solid state were also compared in order to correlate with the different molecular weights.
Experimental
Materials
Three MEH-PPV with different molar weights (and polydispersities) were employed: —Mn = 51 kg mol-1 (—Mn
/
—Mw = 8.8) (M51), —Mn = 86 kg mol-1 (—Mn
/
—Mw = 4.9) (M86), —M
n = 125 kg mol
-1 (—M
n
/
—M
w = 5.2) (M125), all from Sigma-Aldrich Chemical Co. They were used as received (data from the supplier). Toluene and chloroform, spectrophotometric grade from Acros, were also used as received. Molecular weights (—Mn) were employed for calculation of the molar concentration of all of the polymer solutions, in units of mol L-1.
Photoluminescence studies of solutions of the MEH-PPV with three molecular weights in toluene and chloroform were prepared in the concentration range from 10-8 mol L-1 to 10-4 mol L-1. Films were prepared by casting of the solutions in both solvents on a Petri dish, with slow evaporation under a saturated solvent atmosphere, at room temperature, for 30 hours. Later, the films were dried in an oven at a temperature of ca. 50 °C for 1 day. Film thicknesses were ca. 30-40 mm.
Small pieces of these films were also annealed at 70 °C for 5 min in an oven under dynamic vacuum to evaluate possible morphological changes. This temperature is roughly at the glass transition, previously determined by DSC, but below the onset of the decomposition temperature estimated by TGA under a non-oxidative atmosphere.
Methods
We determined the crystallinity of the neat polymer samples and of the films by X-ray diffraction using a model XD-3A X-ray diffractrometer, with CuKa radiation, in the range ca. 2° < 2θ < 50°, operating at 20 mA and 30 kV. Samples were supported on aluminum plates. The degree of crystallinity was determined by deconvolution of the diffraction peaks measured relative to the scattering band, which defines the χRX value.
Decomposition temperatures were determined by thermogravimetic analysis (TGA) under an argon atmosphere (Thermogravimetric Analyzer Hi-Res, TA Instruments, model 29500), performed at a heating rate of 10 °C/min.
We also determined the glass transition by differential scanning calorimetry. DSC was performed using a DuPont 2910 differential scanning calorimeter (DSC) controlled by module 2000, calibrated with indium as standard, with a heating rate of 10 °C/min. Two runs were scanned: the first from room temperature to 170 °C, then the sample was cooled down at a rate of 20 °C/min to –150 °C and, heated at the same rate to 170 °C. The glass transition temperatures were determined using the data from the second heating cycle.
Fluorescence measurements were performed in a PC1TM Photon Counting Spectrofluorimeter from ISS Inc. Fluorescence spectra of polymer solutions and polymer films were obtained. The polymer for these solutions was dissolved under stirring, during several hours and then, the solution was maintained in dark in a sealed flask. The spectral range was from 360 to 500 nm for the excitation spectra and from 500 to 700 nm for emission spectra. Slits were selected for a spectral resolution of ±0.5 nm.
MEH-PPV solubility parameter
In order to select good solvents for MEH-PPV we initially estimated its solubility parameter d (cal1/2 cm3/2) since, to our knowledge, it has not been determined experimentally. The method of group contribution35 was used, according to:
(1)
where: δ is the solubility parameter, εco is the cohesive energy,
F
istands for the contribution of each group in the repeating unit and V for the molar volume. Using the values tabulated,35 the following values were found for d of MEH-PPV, respectively: 9.1 cal1/2 cm3/2, 9.4 cal1/2 cm3/2 and 8.9 cal1/2 cm3/2.
The solvents with the closest delta values to these were toluene (8.9 cal1/2 cm3/2) and chloroform (9.3 cal1/2 cm3/2).36 Although we employed here only these two solvents, several others were tested allowing us to classify: good solvents (nitrobenzene 10.0 cal1/2 cm3/2, o-xylene 8.8 cal1/2 cm3/2, carbon tetrachloride 8.6 cal1/2 cm3/2, tetrahydrofuran 9.1 cal1/2 cm3/2), poor solvents (1,4-dioxane 10.0 cal1/2 cm3/2, ethyl acetate 9.1 cal1/2 cm3/2, tetrachloroethylene 9.3 cal1/2 cm3/2) and non-solvents (n-hexane 7.3 cal1/2 cm3/2, n-heptane 7.4 cal1/2 cm3/2, methylcyclohexane 7.8 cal1/2 cm3/2, dimehyl sufoxide 12.0 cal1/2 cm3/2, acetronitrile 11.9 cal1/2 cm3/2, 2-ethyl hexanol 9.5 cal1/2 cm3/2)..
Results and Discussion
Characterization of the polymers
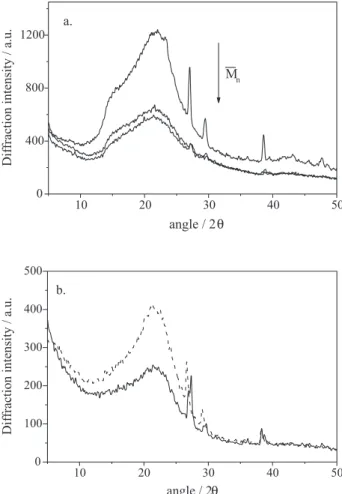
X-ray diffraction of MEH-PPV shows some crystalline peaks in pristine form that decrease in films (Figure 1a). The value for a M125 pristine sample was ca. 5% while those for M51 and M86, as well as for all films cast from their solutions, were lower and could not be precisely determined
(Table 1). Although the crystallinity degrees for films prepared by casting using both solvents are lower and can not be precisely determined (they seem to be lower than 1%), the weak diffraction peaks are located in the same diffraction angles in agreement with the orthorhombic structure23 (Figure 1b). Compared to other reports, the crystallinity is lower, probably due to the lower molecular weight employed here. In addition, films of MEH-PPV produced from chloroform solutions seem to exhibit lower crystallinity than films from toluene solutions.
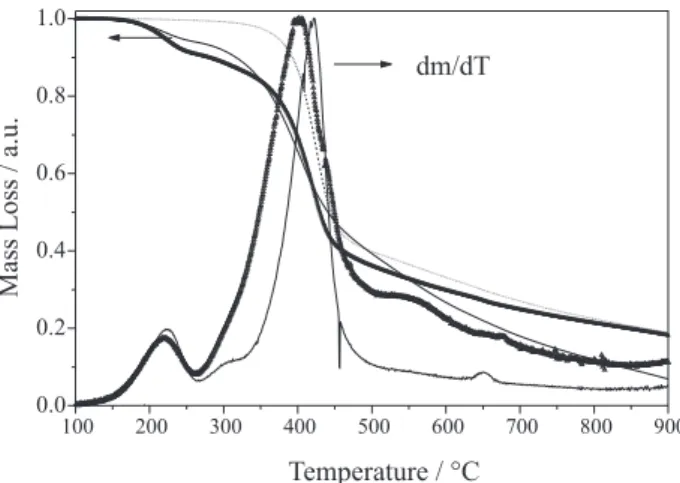
Decomposition temperatures were determined by thermogravimetric analysis (TGA) (Table 1). Samples M86 and M51 undergo thermal decomposition in two steps (at 250 °C and at 380-400 °C) with a 10% mass loss in the first step (Figure 2). On the other hand, MEH-PPV M125 degraded in a single step peaking at 427 °C. Since O2 enhances efficiency of the decomposition,37 to prevent or at least minimize the thermal degradation, we performed the annealing processes at mild conditions (near the glass transition) and under a dynamic vacuum.
The second DSC scan of MEH-PPV samples showed the glass transition temperature (Figure 3) in the range of
ca. 60-70 °C. Although X-ray diffraction showed some
crystallinity, no relevant transitions could be assigned to melting in the DSC curves.
Photoluminescence in dilute solutions
UV-Vis electronic absorption spectra of MEH-PPV solutions show an intense absorption band at 490 nm (2.51 eV) whose peak position is practically independent of the solvent. Absorbances of solutions with several concentrations show a deviation from Lambert-Beer´s law for concentrations greater than 10-6 mol L-1. Samples with higher molecular weights are less soluble undergoing deviations of the Beer-Lambert law at lower concentrations. On the other hand, for dilute samples, the excitation band peaked at 470 nm, which differs from the maximum of the absorption spectra.
Steady-state fluorescence spectroscopy using three excitation wavelengths: at the blue-edge (λexc = 390 nm), at the peak (λexc = 470 nm) and at the red-edge (λexc = 540 nm) of the excitation band, was performed at several concentrations (from 10-8 mol L-1 to 10-4 mol L-1), in solutions of toluene and chloroform as well as with films of MEH-PPV.
Figure 3. DSC heating thermograms (10 °C/min) of MEH-PPV M125 (---), M86 (—) and M51 (-∆-∆-) cast from chloroform (a) and toluene (b).
Figure 2. Normalized mass loss and dm/dt curves from thermogravimetric analysis (TGA) for MEH-PPV M125 (---), M86 (____) and M51 (-∆-∆-).
Table 1. Some physical properties of MEH-PPV having three dif-ferent molecular weights
—
Mn/(kg mol -1) χ
RX (%)
a T
d / °C
b T
g / °C c
5 1 < 1% 217 and 401 53±5
8 6 < 1% 227 and 422 48±5
125 5 425 54±5
aχ
RX is the crystallinity degree from the X-ray diffractogram; b T
d is
the decomposition temperature from TGA at the peak maximum;
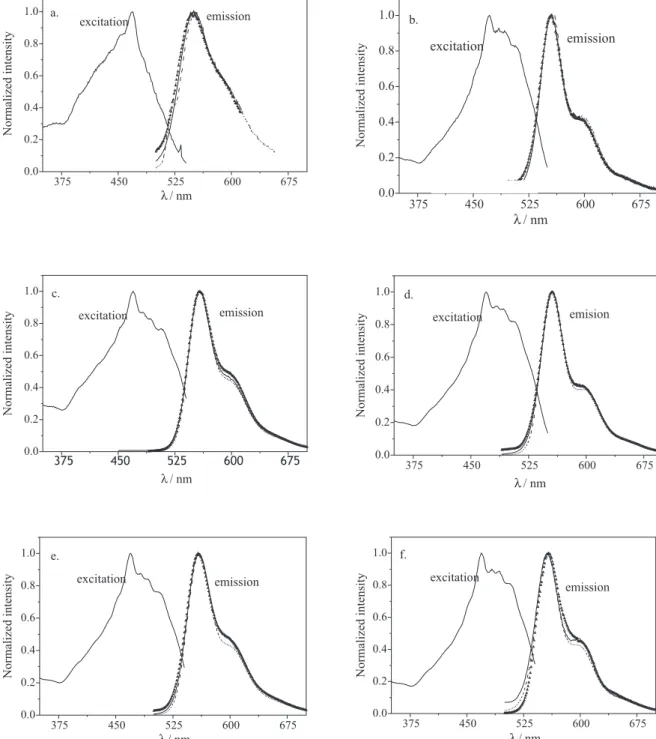
Figure 4. Normalized fluorescence (λexc = 390 nm ---, λexc = 470 nm —, λexc = 540 nm -∆-∆-) and excitation (λem = 556 nm) spectra of MEH-PPV:
a., b. M51; c., d. M86 and e., f. M125, in toluene and chloroform respectively. Concentration 10-8 mol L-1.
Figure 4 shows the excitation and fluorescence emission spectra of MEH-PPV, at the lowest concentration, 10-8 mol L-1, in both solvents. As noted, the emission band is virtually independent of the excitation wavelengths characteristic of the emission from an isolated excited state singlet intrachain exciton.10 Fluorescence peaks lie at 552
MEH-PPV in comparison with the stabilization of the electronic excited state.32,38
In addition, the excitation/absorption and the fluorescence spectra are only roughly mirror images, which can be theoretically explained when the relative intensity of the first vibronic band is significantly enhanced in the fluorescence spectrum.39 The corresponding Stokes´s shifts, taken from the maxima of the excitation and of the fluorescence spectra in toluene and chloroform are 3078 cm-1 and 5401 cm-1, respectively. There are, some plausible reasons for the difference of the Stokes´s shift in these two solvents: (i) it is associated with the polymer/solvent interaction through the solvent´s optical parameters (refractive index and dielectric constant); (ii) it is related to the magnitude of the change of dipole moment of the electronic ground state and the excited state; (iii) there are some conformational changes induced by the solvent that modify the effective conjugation lengths of the emitting chromophore.10,23,40,41
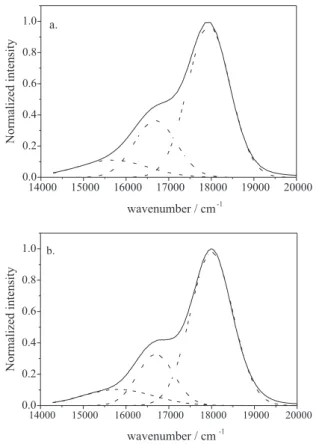
Figure 4 also shows that the emission band is broader for the chloroform solution, which can be explained by greater conformational disorder. It can be deconvoluted in three vibronic bands (Figure 5) using the software Origin version 6.0 with the spectrum in wavenumber scale and fitting the peak profile with gaussian functions. For comparison, the full width at the half maximum (FWHM) of the 0-0 vibronic band (at 556 nm) for MEH-PPV M51 was determined by deconvolution with values of 1110 cm-1 and 1126 cm-1 for films spun from toluene and chloroform, respectively. Although the deconvolution of the spectra is always an arbitrary procedure because we can choose the type of the functions (gaussian or lorentizian or combined functions), we define the initial values of FWHM and the maximum of the peaks, there is no doubt that the relative intensities of the 0-0 and 0-1 bands are different for chloroform and toluene solutions. Deconvolution results in three vibronic bands designated as 0-0 (556 nm), 0-1 (599 nm) and 0-2 (634 nm), whose differences are approximately coincident with the vibrational stretching modes of the C=C bonds. The relative intensities of the 0-0 and 0-1 vibronic bands are taken form the experimental curves, the solution in toluene (I0-0/ I0-1 = 2.37) being distinct from that for chloroform (I0-0/I0-1 = 2.09). Here I0-0 and I0-1 are the intensities taken at λem (0-0) = 556 nm and λem (0-1) = 594 nm, respectively. Taking these values, the Huang-Rhys parameter, S, (equation 2) and geometrical relaxation energy (equation 3) can be determined.16
(2)
(3)
where: In is the intensity of the n manifold, Er is the geometrical relaxation energy and ν0 is the vibrational frequency (cm-1).
The geometrical relaxation energies are, 136 meV and 121 meV for chloroform and toluene solutions, respectively. These values are slightly larger than those reported for MEH-PPV blended with polyethylene, ca. 86 meV, which can be associated with the larger possibility of relaxation in fluid solvents.42
Thus the higher intensity ratio for chloroform is attributed to the preferential solvation of the lateral groups while toluene preferentially solvates the backbone. Moreover, the solvation layer formed by chloroform molecules surrounding the lateral groups tightens the polymer chain to maximize the solvent-moiety interactions. Since the lateral groups can display several possible special orientations, several types of partially folded conformations can take place and, as a consequence, the fluorescence spectra are broadened. Differently, toluene and other aromatic solvents undergo preferential interaction with the conjugated polymer backbone
Figure 5. Normalized fluorescence spectra of MEH-PPV M86: (—) experimental curve, deconvoluted curves (---). Concentration: 10-8 mol L-1 in a. chloroform and b. toluene, λ
(vinylene-phenylene groups), which adopt more planar conformations.7,9,10,14,21-23,26,28,32,43,44 One unequivocal experimental demonstration of the preferential solvation of the lateral groups by non-aromatic solvents was the orientation of these groups perpendicular to the macromolecular back-bone making the film surface more polar whereas the coplanar orientation were observed when the film was spun using aromatic solvents.9 Consequently, greater constraints are imposed on the backbone that limit the possible number of conformations. More limited distributions of conformers always lead to narrower fluorescence bands because the number of emissive Franck-Condon (FC) states is more limited.34
In general, preferential solvation is analyzed in terms of planarity instead of the solubility parameters or other representations of polymer/solvent interactions. The solubility parameters for toluene and chloroform are relatively similar, 8.9 and 9.3 cal1/2 cm3/2, 36 respectively, and, in principle, they could be equally good solvents for MEH-PPV. However, their components are quite distinct: although the dispersive components are very similar (δd = 8.82 and 8.65 cal1/2 cm3/2 for toluene and choroform, respectively) the polar components are distinct (δp = 0.7
and 1.5 cal1/2 cm3/2 for toluene and choroform,
respectively).36 In conclusion, although planarity can be an important condition, specific interactions play an important role for the preferential solvation, which is a very complex phenomenon. The appropriateness of a solvent can not be easily represented by a single solubility parameter. Additional complexity is introduced when solvents induce conformational changes of the conjugated polymer chain that modify the effective lengths and the size distribution of the conjugated emissive segments. Consequently, the solvatochromism and the spectral profile of the fluorescence and of the absorption band depend on several factors: on the overlap of the vibronic progression, on the configurational imperfections extrinsically imposed by the solvent and intrinsically imposed by chemical defects, on the configurational disorder, on the dynamics of polymer relaxation and on the dynamics of photophysical processes.
Photoluminescence in concentrated solutions
Fluorescence spectra of MEH-PPV in more concentrated solutions, 10-7 mol L-1 (Figure 6), are slightly red-shifted (2-3 nm) compared with the spectra of a 10-8 mol L-1 solution (Figure 5). This red-shift is independent of the excitation wavelengths and is attributed to the inner-filter effect, as often observed for concentrated solutions.34 The excitation spectra at the emission peak (557-560 nm)
are also similar to those obtained at 10-8 mol L-1 (data not shown). However, some evidence of preliminary aggregation of the polymer is revealed by the small change of the relative intensity of vibronic bands 0-0 and 0-1, I0-0/I0-1, compared with that for the 10-8 mol L-1 solutions. For example, taking the experimental intensities at 556 nm and 599 nm for MEH-PPV M86 in chloroform and toluene solutions we obtained I0-0/I0-1 = 1.89 and 1.92, respectively, which are lower than previously values (2.37 and 2.09). The aggregates of MEH-PPV emit at 600 nm in coincidence with the vibronic 0-1 band of the intra-chain isolated chromophore, which explains the relative increase of the intensity at 600 nm.26,30,33,40,41
Figure 6 compares the fluorescence spectra of MEH-PPV M86 in solutions of several concentrations, from 10-8 to 10-5 mol L-1. Similar results were obtained for samples with other molecular weights and are omitted. Spectra of toluene solutions are always sharper, the emissions of aggregates (λem = 600 nm) are relatively more intense, shifting the spectra to the red. Aggregates increase the relative intensity of the 0-1 band because their emission is red-shift compared with the isolated lumiphore are dimmers. If we assume that these aggregates are dimes and
Figure 6. Normalized fluorescence spectra of MEH-PPV M86 in a. chloroform and b. toluene, with several concentrations: 10-8 mol L-1,
10-7 mol L-1, 10-6 mol L-1 and 10-5 mol L-1. Arrows indicate increase of
that this red-shift originates from a exciton splitting,45 the expected value of the Davidov coupling is 2B ≅ 2500 cm-1, which is in the range of the exciton splitting observed for dimerization of small molecules46,47 and other conjugated polymers.48
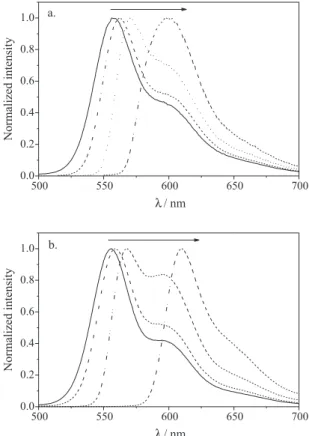
As noted in Figure 7, the fluorescence emissions for solutions of 10-7 mol L-1 are also red-shifted compared with the spectra of samples with lower concentration. Larger red-shifts occur for chloroform solutions of M125 (from 559 nm to 575 nm) compared to toluene (from 568 nm to 573 nm). Nevertheless, while for MEH-PPV in chloroform the fluorescence emission is practically
independent of the excitation wavelengths (λexc = 390 nm,
λexc = 470 nm and λexc = 540 nm), for toluene solutions the lower intensity band at 598 nm has a higher intensity if the excitation takes place at the red-edge of the excitation band, ca. λexc = 540 nm. In addition, there is a remarkable decrease of the I0-0/I0-1 ratio, compared with the 10-8 mol L-1 solutions. This effect is much more pronounced for toluene solutions of M125.
As previously commented, the red-shift of the fluorescence spectra resulted from: (i) inner-filter effect produced by the higher optical density of the more concentrated solutions; (ii) the conformational changes
Figure 7. Normalized fluorescence (λexc = 390 nm ---, λexc = 470 nm ___, λ
exc = 540 nm -∆-∆-) of MEH-PPV: a., b. M51; c., d. M86 and e., f. M125,
of the polymer chain that modify the effective size of the intra-chain conjugation; (iii) the formation of aggregates that increases the relative intensity of the red-edge 0-1 vibronic band (600 nm) and, (iv) interaction with the solvent, producing solvatochromic effects. In principle, the inner-filter effect depends only on the number of chromophoric units present in solution, being independent of the solvent (if differences of solubility are ignored).34 Nevertheless, the inner-filter effect can not explain the simultaneous occurrence of: larger red-shift, higher intensity of the red-edge band (600 nm), higher vibronic resolution and stronger dependence of the spectral profile on the excitation wavelengths for toluene solutions of M125. The more plausible reason for the larger changes for M125 (compare Figure 7a,c, and e or 7b,d and f), is the decrease of the solubility of longer chains.37 The enhancement of the intensity at 600 nm can be attributed to, at least, two major reasons: aggregation of the polymer chains in more concentrated solutions, principally when the molecular weight increases, and changes of the conformational freedom. Nevertheless, there are several reasons for our belief that aggregation predominates over the conformational disorder: (i) there is a relative increase of the band at 600 nm where the emission of aggregates predominates; (ii) this relative intensity is more pronounced for higher molecular weight samples, which one expects to be less soluble; (iv) there is a remarkable decrease of the entire intensity signal, which is compatible with the decrease of the quantum yield of aggregates compared to the isolated lumophores. On the other hand, increase of the conformational disorder should produce different types of changes of the spectral profile, such as: (i) broadening of the emission band occurs when the conformational disorder increases; (ii) more flexible conformations produce shorter conjugation lengths leading to the blue-shift of the emission spectrum. Thus, considering that none of these two behaviors were observed and considering that the solubility decreases with the increase of the molecular weight, we conclude that the major reason for the relative increase of the intensity at 600 nm is the aggregation of the polymer in concentrated solutions.
Interaction with solvents with larger dipole moments should shift the spectra to the blue or to the red, depending on the stabilization of the electronic excited state.38,39 In particular some reports49 showed that there is a decrease of the dipole moment for excited state MEH-PPV that should result, as observed, in a blue shift of the fluorescence emission in more polar solvents.
Differences of the solvation abilities of chloroform and toluene play an important role in controlling the shape of the emission band. For toluene solution the excitation on
the blue-edge of the excitation band (λexc = 370 nm) leads to the emission of higher energy specie, the isolated form,
while excitation at the red-edge (λexc = 540 nm)
preferentially excites the lower energy aggregates that emit at the red-edge of the emission band. Although in toluene we observe site-selective excitation, in chloroform solutions the emission is independent of the excitation wavelengths even though the higher relative intensity of the band at 600 nm evidenced the presence of aggregates. Because of the difference in solvation ability and similar to other reports, we assume that toluene undergoes a preferential solvation of the back-bone inducing a more planar structure, which defines a sharper distribution of conformations and sharper fluorescence emission bands.22 Under this condition, site-selective emission can be observed. On the other hand, preferential solvation of lateral groups by chloroform leads to a more flexible back-bone, several conformations are possible emission bands becomes broader and site-selective emission is not observed. Although a precise explanation for these observations requires additional data, for example time-resolved spectra, we suggest that in less ordered systems additional energy transfer or migration processes occur and the relative quantum efficiencies of the emission of isolated and aggregate forms are maintained constant. On contrary, successive energy transfer or migration was inhibited when a higher energy specie is preferentially excited either because the radiative process is more efficient or because the lower energy specie (aggregate) is inaccessible. In any case this point requires further studies. The red-shift of the absorption band is also observed in addition to the fluorescence spectra. This result can be interpreted according to the exciton theory developed by Kasha et al.45 According to this model, the relative orientation of the transition moments of both interacting molecules defines selection rules for electronic transitions of the dimer. For example, in the case of the anti-parallel orientation of the transition moments, the allowed electronic transition is red-shifted compared to the isolated chromophores, as are the absorption/excitation bands. Based on this simple model from the experimental data, we conclude that, in concentrated solutions, an inter-chromophoric interaction takes place with anti-parallel orientation relative to the backbone of the two macromolecular segments.
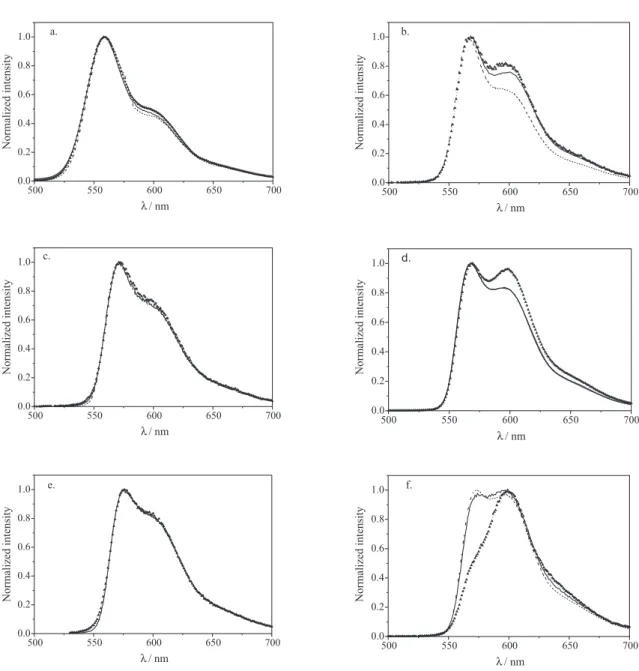
Photoluminescence of films
done for solutions, the analysis was carried out for both peak positions and the relative intensities of the vibronic bands. Fluorescence spectra of all films are red-shifted and broader compared with concentrated solutions (Figure 7). Better resolved vibronic bands are obtained for films cast from toluene solutions, revealing a sharper distribution of macromolecular conformations. As observed before for toluene solutions the conformational disorder of the conjugated polymers in solution is partially retained in the solid state (memory effect).
Figure 8. Normalized fluorescence emission of films from chloroform (—) and toluene (---) of MEH-PPV M51 (a, b), M86 (c, d) and M125 (e, f). Right side: annealed samples.
isolated chromophore and of a few nanoseconds for the aggregates.51 Under this assumption, the selective excitation with higher energy photons (λexc = 370 nm) of smaller aggregates is responsible for the higher energy emission (λem = 600 nm). On the contrary, photons with lower energy (λexc = 570 nm) excite larger aggregates that emit with lower energy (λem = 630 nm).
As noted in Figure 8, while the wavelength range of the fluorescence emission (550-700 nm) is almost independent of the excitation wavelengths regardless of the molecular weights, the spectral profile depends on the excitation wavelengths, on the molecular weight and on the solvent, as well. For example, excitation with lower energy photons increases the relative intensity of the emission at lower energy only for films cast from toluene. As pointed out, solvation in toluene induces a more planar conformation of the backbone, which favors the aggregation in π,π-stacked inter-chain orientations, and this effect is enhanced for M125 due to its lower solubility.36
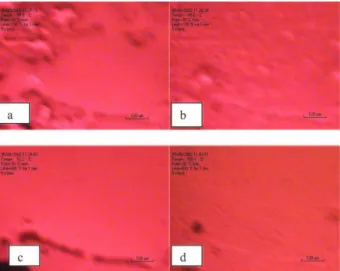
Films cast from chloroform solutions exhibit a broader spectrum (Figure 8), reflecting a broader distribution of conformers. They are more strongly affected by the annealing at T ~ Tg. Their spectra become sharper, shifting to the red and acquiring the same profile as those cast from toluene solutions. Topology of a sample of M86 was recorded by fluorescence optical microscopy at several temperatures. In Figure 9 some micrographs are shown (-100 °C, -50 °C, 50 °C and (-100 °C). From these micrographs we observe that the corrugated topology at lower temperatures becomes flattened and more uniform at T ~ Tg. It is well known that annealing at T ~ Tg erases the thermal history of the samples, reduces the average
free-volume,52,53 decreases the relative amount of larger free-volumes, controls the polymer topology and produces densification of the material.
Conclusions
We have shown that two good solvents for MEH-PPV (toluene and chloroform) undergo different interactions with the polymer, bringing about different conformations in solution and cast films that are reflected in the photoluminescence properties.
Both solvents and the polymer molecular weights play important roles with respect to the photoluminescence properties of MEH-PPV in solutions as well as in films. Annealing is an additional parameter to be controlled for films, since the conformational disorder in solutions is transferred to the solid-state. Even though we employed two good solvents with comparable solubility parameters, their influences on film morphology and topology are different.
A more extended conformation was maintained in films cast from toluene, which enhances polymer aggregation. Spectra of aggregates can be explained by the exciton splitting of the electronic levels according to Kasha’s model, where the orientation of the two chromophores is similar to the sandwich conformation of the excimer of aromatic molecules, leading to the formation of cofacial p,p-stacked dimers.
The concept of good solvents for MEH-PPV samples is not easily correlated with the solubility parameters. However, even when good solvents are employed, the observed micro-morphology of the solid state is not necessarily the same. Molecular weights also play an important role since the solubility decreases with the increase of the molecular weight. Annealing at T ≅ Tg stabilized the morphology of films prepared using different solvents. This is a convenient temperature range to perform the annealing process since it is enough to erase the thermal history without significant polymer degradation.
Since the conformation in solution is partly retained in the films, the solvent effects described can have an important role in the electroluminescence properties of this material, which is its most important application.
Acknowledgements
T.D.Z.A. and R.F.C. thank FAPESP, CNPq and MCT/ PADCT/IMMP for the financial support and a fellowships. L.A. thanks CNPq for financial support and a fellowship. The authors thank Prof. Carol Collins for useful discussions.
References
1. Miyata, S.; Nalwa, H. S.; Organic Electroluminescence
Materials and Devices; Gordon and Breach: Tokyo, 1998.
2. Fiend, R.H.; Gymer, R.W.; Holmes, A.B.; Burroughes, J.H.; Marks, R.N.; Taliani, C.; Bradley, D.D.C.; Dos Santos, D.A.; Brédas, J.L.; Lögdlung, M.; Salaneck, W.R.; Nature1999,
397, 121.
3. Halls, J.J.M.; Baigent, D.R.; Cacialli, F.; Greenham, N.C.; Friend, R.H.; Moratti, S.C.; Holmes, A.B.; Thin Solid Films
1996, 276, 13.
4. Braun, D.; Heeger, A.J.; Appl. Phys. Lett. 1991, 58,1982. 5. Braun, D.; Heeger, A.J.; Kroemes, H.; J. Electron. Matter.
1991,20, 945.
6. Akcelrud, L.; Prog. Polym. Sci. 2003,28,875.
7. Wang, P.; Collison, C.J.; Rothberg, L.J.; J. Photochem.
Photobiol. A: Chem.2001,63-68,144.
8. Beljonne, D.; Cornil, J.; Sirringhaus, H.; Brown, P.J.; Shkunov, M.; Friend, R.H.; Bredas, J.L.; Adv. Funct. Mater. 2001,11, 229.
9. Nguyen, T.-Q.; Martini, I.B.; Liu, J.; Schwartz, B.J; J. Phys.
Chem. B2000,104, 237.
10. Nguyen, T.-Q.; Kwong, R.C.; Thompson, M.E.; Schwartz, B.J.; Appl. Phys. Lett. 2000,76, 2454.
11. Lupton, J.M.; Samuel, I.D.W.; Beavington, R.; Frampton, M.J.; Burn, P.L.; Bassler, H.; Phys. Rev. B2001,63,155206. 12. Jenekhe, S.A.; Osaheni, J.A.; Science 1994,265,765. 13. Samuel, I.D.W.; Rumbles, G.; Collison, C.J.; Friend, R.H.;
Moratti, S.C.; Holmes, A.B.; Synth. Met.1997,84,497. 14. Jakubiak, R.; Rothberg, L.J.; Wan, W.; Hsieh, B.R.; Synth.
Met. 1999,101, 230.
15. Nguyen, T.-Q.; Doan, V.; Schwartz, B.J.J.; Chem. Phys. 1999,
110, 4068.
16. Blatchford, J.W.; Jessen, S.W.; Lin, L.B.; Gustafson, T.L.; Fu, D.K.; Wang, H.L.; Swager, T.M.; Macdiarmid, A.G.; Epstein, A.J.; Phys. Rev. B 1996,54, 9180.
17. Lemmer, U.; Heun, S.; Mahrt, R.F.; Scherf, U.; Hopmeier, M.; Siegner, U.; Gobel, E.O.; Mullen, K.; Bassler, H.; Chem. Phys.
Lett.1995,240, 373.
18. Pauck, T.; Hennig, R.; Perner, M.; Lemmer, U.; Siegner, U.; Mahrt, R.F.; Scherf, U.; Mullen, K.; Bassler, H.; Gobel, E.O.;
Chem. Phys. Lett.1995,244, 171.
19. Mahrt, R.F.; Pauck, T.; Lemmer, U.; Siegner, U.; Hopmeier, M.; Hennig, R.; Bassler, H.; Gobel, E. O.; Bolivar, P. H.; Wegmann, G.; Kurz, H.; Scherf, U.; Mullen, K.; Phys. Rev. B
1996,54, 1759.
20. Yan, M.; Rothberg, L.J.; Kwock, E.W.; Miller, T.M.; Phys.
Rev. Lett. 1995,75, 1992.
21. Kraabel, B.; Klimov, V.I.; Kohlman, R.; Xu, S.; Wang, H.L.; McBranch, D.W.; Phys. Rev. B2000,61, 8501.
22. Nguyen, T.-Q.; Yee, R.Y.; Schwartz, B.J.; J. Photochem.
Photobiol. A: Chem.2001, 144, 21.
23. Yang, C.Y.; Hide, F.; DiazGarcia, M.A.; Heeger, A.J.; Cao, Y.;
Polymer1998, 39, 2299.
24. Sluch, M.I.; Pearson, C.; Petty, M.C.; Halim, M.; Samuel, I.D.W.; Synth. Met.1998, 94, 285.
25. Aguiar, M.; Figihara, M.C.; Hümmelgen, I.A.; Péres, L.O.; Garcia, J.R.; Gruber, J.; Akcelrud, L.; J. Lumin.2002, 96,
219.
26. Zheng, M.; Bai, F.; Zhu, D.; J. Photochem. Photobiol. A:
Chem.1998, 116, 143.
27. Tian, B.; Zerbi, G.; Muellen, K.; J. Chem. Phys.1991, 95, 3191.
28. Zhang, H.; Lu, X.; Li, Y.; Ai, X.; Zhang, X.; Yang, G.; J.
Photochem. Photobiol. A: Chem.2002, 147, 15.
29. Whitelegg, S.A.; Buckley, A.; Rahn, M.D.; Fox, A.M.; Bradley, D. D.C.; Palsson, L.O.; Samuel, I.D. W.; Webster, G.R.; Burn, P.L.; Synth. Met.2001, 119, 575.
30. Heun, S.; Mahrt, R.F.; Greiner, A.; Lemmer, U.; Bassler, H.; Halliday, D.A.; Bradley, D.D.C.; Brurn, P.L.; Holmes, A.B.; J.
Phys. Condens. Matter.1993, 5, 247.
31. Pichler, K.; Halliday, D.A.; Bradley, D.D.C.; Brurn, P.L.; Friend, R.H.; Holmes, A.B.; J. Phys. Condens. Matter. 1993, 5, 7155. 32. Collison, C.J.; Rothberg, L.J.; Treemaneekarn, V.; Li, Y.;
Macromolecules2001, 34, 2346.
33. Chang, R.; Hsu, J.H.; Fann, W.S.; Liang, K.K.; Chang, C.H.; Hayashi, M.; Yu, Y.; Lin, S.H.; Chang, E.C.; Chuang, K.R.; Chen, S.A.; Chem. Phys. Lett.2000, 317, 142.
34. Lackowicz; J.R.; Principles of Fluorescence Spectroscopy, 2nd
ed., Kluwer Academic Publishers: New York, 1999. 35. Van Krevelen, D.W.; Hoftyzer, P.J.; Properties of Polymers
-Correlations with Chemical Structure, Elsevier: New York,
1972, chap. 8, p. 135.
36. Gundert, F.; Wolf, B.A. In Polymer-Solvent Interaction
Parameters, in Polymer Handbook; X/153rd ed., Brandrup, J.;
Immergut, E.H., eds., John Wiley: New York, 1989, chap. VII, p. 173.
37. Chawdhury, N.; Köhler, A.; Harrison, M.G.; Hawang, D.H.; Holmes, A.B.; Friend, R.H.; Synth. Met. 1999, 102, 871. 38. Mataga, N.; Kaifu, Y.; Koizumi, M.; Bull. Chem. Soc. Jpn.
1956, 29, 465.
39. Blatchford, J.W.; Gustafson, T.L.; Epstein, A.J.; Vandenbout, D.A.; Kerimo, J.; Higgins, D.A.; Barbara, P.F.; Fu, D.K.; Swager, T.M.; MacDiarmid, A.G.; Phys. Rev. B 1996, 54, 3683. 40. Tian, B.; Zerbi, G.; J. Chem. Phys. 1991, 95, 3191. 41. Hagler, T.W.; Pakbaz, K.; Heeger, A.J.; Phys. Rev. B 1994, 49,
10968.
42. Nguyen, T. -Q.; Schwartz, B.J.; Schaller, R.D.; Johson, J.C.; Lee, L.F.; Haber, L.H.; Saykally, R.J.; J. Phys. Chem. B 2001,
105, 5163.
43. Shi, Y.; Liu, J., Yang, Y.; J. Appl. Plys. 2000, 87, 4254. 44. Schaller, R.D.; Lee, L.F.; Johnson, J.C.; Haber, L.H.; Vieceli,
J.; Benjamin, I.; Nguyen, T -Q.; Schawartz, B.J.; J. Phys.
45. Kasha, M.; Rawls, H.R.; El-Bayoumi, M.A.; Pure Appl. Chem.
1965, 11, 371.
46. Bortolato, C.A.; Atvars, T.D.Z.; Dibbern-Brunelli, D.; J.
Photochem. Photobiol. A: Chem.1991, 59, 123.
47. Alberola, F.L.; Alberola, I.L.; Chem. Phys.1989, 103, 371. 48. Machado, A.M.; Yamaki, S.B.; Atvars, T.D.Z.; Ding, L.; Karasz,
F.E.; Akcelrud, L.; Polymer, submitted.
49. Martins, T.D.; Yamaki, S.B.; Atvars, T.D.Z.; J. Photochem.
Photobiol. A: Chem. 2003, 156, 91.
50. Wang, C.-Y; Ediger, M.D.; J. Chem. Phys. 2000, 112, 6933.
Received: May 25, 2004 Published on the web: December 16, 2004