Innovative Issues and Approaches in
Social Sciences
| 2
Innovative Issues and Approaches in Social Sciences
IIASS is a double blind peer review academic journal published 3 times yearly (January, May, September) covering different social sciences: political science, sociology, economy, public administration, law, management, communication science, psychology and education.
IIASS has started as a SIdip – Slovenian Association for Innovative Political Science journal and is now being published in the name of CEOs d.o.o. by Zalozba Vega (publishing house).
Typeset
This journal was typeset in 11 pt. Arial, Italic, Bold, and Bold Italic; the headlines were typeset in 14 pt. Arial, Bold
Abstracting and Indexing services
COBISS, International Political Science Abstracts, CSA Worldwide Political Science Abstracts, CSA Sociological Abstracts, PAIS International, DOAJ.
Publication Data:
CEOs d.o.o.
Innovative issues and approaches in social sciences
ISSN 1855-0541
| 137
DO SLOVENIAN DEALERS USE TECHNIQUES FOR
INCREASING THEIR TIPS?
Andrej Raspor
1Abstract
In 1996 Michael Lynn introduced the idea that restaurant managers could increase tips for their waiters and thus increase turnover by training the waiters to engage tip-enhancing behaviours. Since then, the list of tip-enhancing behaviours has expanded. Therefore the potential to increase tips is more accessible. The purpose of this paper was to examine how Slovenian dealers use strategies to increase their tips.
We tested fourteen techniques to increase tips. The study was carried out among 473 gaming employees, 279 of which are dealers, in the Slovenian gaming industry, in order to find out how they use these techniques and which of them can bring about an increase in their tips.
The study showed that Slovenian dealers mostly do not use these techniques, and that the dealers who do use them tend to receive tips more often. The findings imply that managers and employees should be informed of these techniques in order to increase tips and their overall income. Practical implications are that we suggest that management considers these ideas for increasing flexibility and reducing the cost of work: (1) informing dealers on ways of increasing tips, (2) including the acquisition of this specific knowledge in their career plans, (3) carrying out a reform of the reward system which would include tips. Social implications will be shown in a higher gaming revenue. It is very likely – as shown in our research – that employees will receive higher wages as these will be topped up by tips. The state, in turn, will collect more taxes.
Keywords: waiters, dealers, tip, tipping behaviour, gaming industry.
DOI: http://dx.doi.org/10.12959/issn.1855-0541.IIASS-2016-no2-art08
1 Andrej Raspor, assistant Professor Fakulteta za uporabne družbene študije v Novi
| 138
Introduction
Despite a big downturn in the global economy the Global Casino Gaming Industry has preserved a growing tendency. By now, most markets worldwide have managed to overcome the recession and are showing increasing numbers and fast-paced rising rates. It was expected that between 2010 and 2015 the overall industry would reach a Compound Annual Growth Rate (CAGR) of 9.2%, representing an upward of USD 117.6 billion in 2010 to USD 182.8 billion in 2015 (PwC Mexico, 2015). The gaming industry of today is facing increasingly complex challenges. Thirty years ago most of the revenue came from the gaming tables. Fifteen years ago it came from the slot machines. Now the trend is VLT and mobile gaming. The same thing happened with key casino destinations. Ten years ago the leading casino destination was Las Vegas. Nowadays it is Macau.
Since "quality service" is being taken more and more for granted by the guests, the skills of the employees must evolve to meet their demands. This is even more true considering the current decline in revenues at gaming tables. For this reason, managers as well as experts are trying to devise ways to persuade employees to enhance the quality of service, improve their motivation to work, as well as intensify the labour output. A large part of the revenue is represented by tips. Las Vegas gaming dealers' tips represent a whopping 71% of their income (Lee, 2006). In Slovenian casinos they represent from 35% up to 50% (Raspor, 2010) of the total dealers’ revenue. However, the tips have been decreasing recently. Due to the gaming industry’s work intensity, the increase of salaries and consequently labour costs is undesirable. Since the amount of their wages is not directly related to the quality of their work, employees can gradually become dissatisfied. An innovative approach or a comprehensive reform of reward systems is thus needed to increase the motivation of employees without increasing labour costs. In our opinion, an increase of the share of tips in the income of employees is a viable method which could be implemented through training employees in techniques for increasing tips.
| 139
sum of the tip in various settings, how tipping affects the quality ofservice and the mechanisms waiters use to increase their tip-related income (Lynn, 2005).
By and large, research on casino tipping has not yet been carried out. One of the main questions is how widespread the practice really is. Due to the considerable amount of income generated by tipping, the importance of tipping in Slovenia is likely to grow in the future. This hypothesis is based on research which attempts to devise ways in which to improve the gaming industry’s business operations. It is of great importance for the gaming industry as well as the employees to be familiar with and apply methods to increase tipping. However, these methods are not easily transmitted from one socio-cultural system to another – from waiter to dealer. The purpose of this paper is to first establish why tipping occurs, and then how this knowledge is applied among gaming industry employees.
How employees can affect tipping behaviour – theoretical framework In the English language the most general expressions for gratuity of guests towards employees in the catering industry is 'to tip (a waiter)'. Also, sometimes the expression 'drink money' is used (Foster, 1972 in Lobb, 2001)1. At present, there is no law that requires that one must tip for services rendered (Wight, 2006:1); the decision to leave a tip is left to the discretion of the customer. If the customer is satisfied with the service, they will tip, otherwise not (Raspor, 2002a). The tip is therefore an optional part of payment for a service but is nevertheless sometimes expected by the employees for the services rendered (Wight, 2006:1). The amount of the tip is usually calculated as a certain percentage of the value of the receipt. Raspor (2002b:143) defined a tip as a "gift for a high standard service". Therefore, if someone wants to receive a tip, the service has to be of a high standard. Lynn and McCall's research (2000) also found this to be true: the participants in their survey linked tipping with rewarding the service provider for a high quality service.
The techniques used to influence the amount of tip
There are many reasons for deciding on a certain amount of tip. However, there is no research about it in the Slovenian gaming industry. Lynn (2004) collected research findings which demonstrate a positive
1
| 140
correlation between certain behaviours on the part of service providersand the subsequent increase in the tip1.
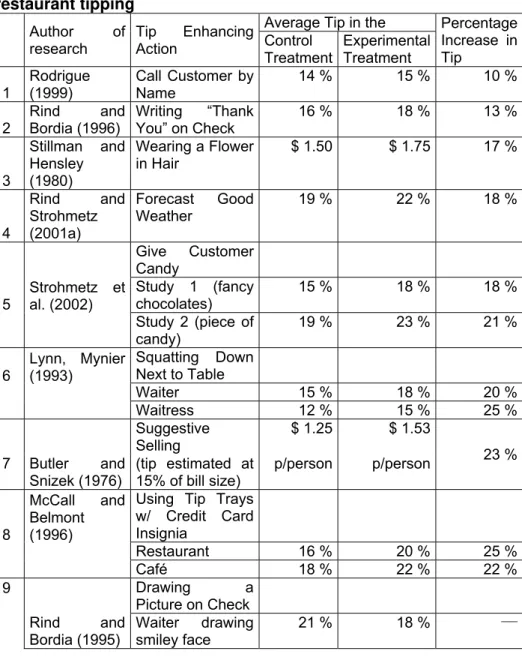
Table 1: Summary of experiments and quasi-experiments on restaurant tipping
Author of research
Tip Enhancing Action
Average Tip in the Percentage Increase in Tip Control Treatment Experimental Treatment 1 Rodrigue (1999)
Call Customer by Name
14 % 15 % 10 %
2
Rind and Bordia (1996)
Writing “Thank You” on Check
16 % 18 % 13 %
3
Stillman and Hensley
(1980)
Wearing a Flower in Hair
$ 1.50 $ 1.75 17 %
4 Rind and Strohmetz (2001a) Forecast Good Weather
19 % 22 % 18 %
5 Strohmetz et al. (2002) Give Customer Candy Study 1 (fancy
chocolates)
15 % 18 % 18 % Study 2 (piece of
candy)
19 % 23 % 21 %
6 Lynn, Mynier (1993) Squatting Down Next to Table
Waiter 15 % 18 % 20 % Waitress 12 % 15 % 25 %
7 Butler and Snizek (1976) Suggestive Selling
$ 1.25 $ 1.53
23 % (tip estimated at
15% of bill size)
p/person p/person 8 McCall and Belmont (1996)
Using Tip Trays w/ Credit Card Insignia
Restaurant 16 % 20 % 25 % Café 18 % 22 % 22 % 9 Rind and Bordia (1995) Drawing a Picture on Check
Waiter drawing
smiley face
21 % 18 % ___
1 Research work which formed the basis of our survey is mentioned in Table 1. arious research findings are
indexed by the increase of tip according to a specific technique. For a clearer overview we mention the
| 141
Waitress drawing smiley face
28 % 33 % 18 % Gueguen
(2000)
Bartender drawing sun
19 % 26 % 37 %
10 Entertaining Customer Gueguen and Legoherel (2002)
Share a Joke 16 % 23 % 40 %
Rind and Strohmetz
(2001b)
Give a Puzzle 19 % 22 % 18 %
11 Crusco and Wetzel (1984) Touching Customer Study 1 12 % 17 % 42 % Lynn, Mykal
and Sherwyn (1998)
Study 2 11 % 14 % 27 %
Renee and Zweigenhaft (1986),
Study 3 15 % 18 % 22 %
Hornik (1992) Study 4 12 % 15 % 28 %
12 Garrity and Degelman (1990) Introducing Self by Name
15 % 23 % 53 %
13 van Baaren (2003) Repeat Order Back to Customer
NLG 1.36 NLG 2.73 100 %
14
Tidd and Lockard
(1978)
Smiling $ 0.20 $ 0.48 140 %
Source: Lynn, 2004.
The above table shows different techniques that researchers claim are in direct correlation with tipping. They prove that a specific behaviour of the service provider can substantially increase the tip, in some cases by as much as 140%. Simultaneously, there can also be a negative correlation between the service providers' behaviour and the customers' tipping. These findings form a basis for further research and implementation in everyday business operations. Lynn (2004) in his book Mega Tips asserts that the above mentioned techniques will first lead to a greater customer satisfaction and only then to a higher tip. On the basis of the above-mentioned research, the author of this paper formed the following hypotheses to be tested out among employees in the Slovenian gaming and catering (Raspor, 2011) industries.
| 142
by 71% of survey participants), professionalism of personnel (69% ofsurvey participants), speed of service (36%), and appearance of employee (25%).
Methodology
The aim of the study was to find out how employees in the Slovenian gaming industry (especially dealers) use techniques for increasing tips and whether or not the application of these techniques actually leads to an increase in tips. We claim our findings to be representative as the survey sample included a variety of gaming enterprises across Slovenia. In accordance with the aim of the research we formed two hypotheses: H1: "Dealers in the Slovenian gaming industry do not use techniques for increasing tips."
H2: "Dealers in the Slovenian gaming industry who use the techniques for increasing tips are more likely to receive a tip."
To test the above mentioned hypotheses we used the following research design: on the basis of a literature overview we gathered empirical data by conducting a survey (1) and executing the focus group method (2) among employees of the Slovenian gaming industry. The focus groups were mainly used for clarifying the findings obtained by the survey. We used the probability sample for the survey design. In order to test the hypotheses, statistical methods were used as well as analysis, synthesis and compilation. In the next section, the process of gathering the data and characteristics of the sample are described as well as the measuring instrument we applied.
Research project: Gaming industry employees and tipping 2007
The gathering of data1 took place between May 2007 and December 2007 (Table 2). The gaming industry employees (dealers, slot supervisors, cashier) were the target population.
According to the Agency for Public Legal Records and Related Services of the Republic of Slovenia (AJPES), there were 28 gaming enterprises2 in Slovenia as of 31 December 2007.
1 The research was part of the author's doctoral thesis The influence of tips distribution on the employees:
comparison between the catering industry and the gambling industry from the Faculty of Social Sciences at
the University of Ljubljana. The thesis comprised 10 different surveys.
2
| 143
Table 2: General information on "Gaming industry employees andtipping 2007" research project
Duration of research 2007 Method of collecting data Mail survey
Questionnaire Designed specifically for this project by author
Site Slovenia
Group: Gambling industry
Target population
Questionnaires returned
The share of answers with regard
to target population Number of companies
(Source: AJPES) 28 12 43 %
Employees (Source: SURS) Gaming tables (dealers) 963 279 29 % Slots (slot supervisors) 147 72 49 % Treasury (cashier) 271 122 45 %
TOTAL 1,381 473 34 %
Among the enterprises listed in the above mentioned databases there were 28 companies. They represented our final selection for sampling on the first level. According to SURS, they employ 1,381 persons. We sent a letter with the questionnaire included to the management of each company. They were asked to distribute the questionnaire among their employees working at the gaming tables, slot machines and cashier desks in each of their casinos and amusement arcades. 12 employeers out of 13 casinos and 7 (from the total of 36) amusement arcades gave us feedback. The percentage of the answers received from the companies was 43 %. In total, 473 interviewees answered the questionnaire. They worked at slot machines (casino technician, slot supervisors) and at the treasury (cashier’s assistant, cashier and head cashier). In the second batch of the answers received there were 29 % from gaming tables, 49 % from slot machines and 45 % from cashiers.
Focus groups with the employees
| 144
We carried out the focus group sessions immediately following thecompletion of the survey in the years 2007 and 2008. The focus groups usually lasted 2 hours and a half. Moderating was performed by the author of the questionnaire. We conducted focus groups in 6 casinos (Casino Kastel, Igralni salon Dama, Igralnica Fontana, Casino Ljubljana, Casino Maribor, Igralnica Čatež) owned by 4 gaming companies (Hit, d. d., Nova Gorica; Casino Ljubljana; Casino Maribor; Casino Portorož) and two Casino and entertainment centres (two focus group sessions were conducted in Perla and two in Park). In total, we carried out 8 focus group sessions with 100 participants.
Questionnaire
The questionnaire included several thematic components1. In this article we will only mention the questions which are relevant to the application of the techniques for increasing tips and the frequency of tipping. The answers to the survey questions were either YES or NO, or alternatively from 1 to 5 where 1 stands for "I always do" and 5 "I never do".
The focus groups consisted of 20 participants, who were divided into groups of five. To achieve consensus on the questions among group participants we devised a two-phase procedure. In the first phase we looked for consensus among participants in a smaller group, and in the second phase among the participants in the entire focus group. The composition of groups differed somewhat if the group participants were from the gaming industry (dealers, slot supervisors, cashiers) or from the gambling industry (including other employees working in the casino). In the second phase the smaller groups presented their standpoints to the rest of the focus group participants, who then reacted to the views they had expressed. The question was dealt with until a consensus among all the participants was reached. Again, only the questions relevant to this paper are mentioned.
Data processing
In accordance with the aims of the research, statistical analysis of the data collected was performed by using the SPSS software package. In the first phase we conducted a univariate analysis and in the second phase we used the bivariate analysis to investigate the correlation between the pairs of variables.
1 Due to a very broad range of questions included in the questionnaire only the ones most relevant for the
| 145
Application of techniques for increasing tips – research findings
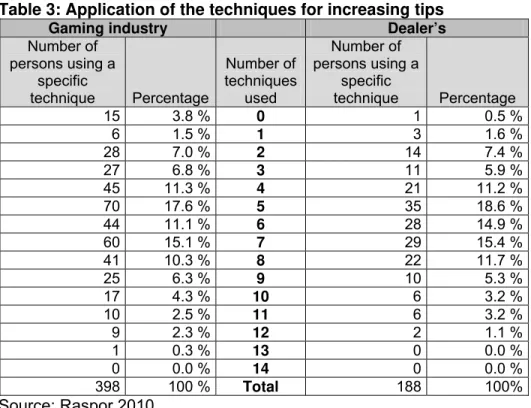
Gaming industry employees in Slovenia (Table 3) rarely use the above mentioned techniques for increasing tips. 3.8 % of employees do not use them at all. All 14 answered that they do not use such techniques. On the other hand, there is only one respondent among the dealers who does not use any of the techniques, while not even one employee uses all 14 techniques. Employees apply 4.85 techniques on average, and dealers 5.9 techniques on average (Table 6). Dealers from the casino that regulate tip sharing use the techniques more frequently (5.42) than their colleagues in companies with an irregular system of sharing tips (5.29).
Table 3: Application of the techniques for increasing tips
Gaming industry Dealer’s
Number of persons using a
specific
technique Percentage
Number of techniques
used
Number of persons using a
specific
technique Percentage 15 3.8 % 0 1 0.5 %
6 1.5 % 1 3 1.6 % 28 7.0 % 2 14 7.4 % 27 6.8 % 3 11 5.9 % 45 11.3 % 4 21 11.2 % 70 17.6 % 5 35 18.6 % 44 11.1 % 6 28 14.9 % 60 15.1 % 7 29 15.4 % 41 10.3 % 8 22 11.7 % 25 6.3 % 9 10 5.3 % 17 4.3 % 10 6 3.2 % 10 2.5 % 11 6 3.2 % 9 2.3 % 12 2 1.1 % 1 0.3 % 13 0 0.0 % 0 0.0 % 14 0 0.0 % 398 100 % Total 188 100%
Source: Raspor 2010.
| 146
Table 4: Application of the techniques for increasing tips: gaming industry
Gaming industry Dealing staff Techniques
s by order of importance as established by the survey (Table 1)
Please, list the techniques for increasing the tips that
you use at work (n=473)
The share of respondents that
use a specific technique among all
respondents that answered the question The number of respondents that answered the question
The share of respondents that
use a specific technique among
all respondents that answered the
question The number of respondents that answered the question 1
(10) I thank a customer for leaving a
tip. 75.5 % 386 84.5 % 188
2
(5) I offer the customer additional service (I bet his chip, do the replacement chips, call supervisor, coffee, refreshments, taxi
service). 52.4 % 344 77.8 % 182
3
(11) I smile while
working. 68.7 % 386 74.3 % 188
4
(8) I wish a customer a pleasant stay in our
casino. 60.5 % 386 67.5 % 188
5
(9) I use jokes while
working. 53.9 % 386 59.7 % 188
6
(4) I repeat the order (beat) after the
customer. 39.7 % 344 56.8 % 182
7
(12) I advise the customer on payment methods in use at specific venue and where the exchange or provisioning can be done (e.g. cheques,
bank cards). 29.0 % 386 27.7 % 182
8
(7) I share a joke with
the customer. 21.8 % 344 25.2 % 182
9
(13) I present customers with small complimentary gift/giveaways (sweets, pens, coffee,
etc.) 24.3 % 386 18.4 % 182
10
(6) I shake hands with customers or lightly touch him/her in order
to manifest respect 19.0 % 344 15.5 % 182
11
(3) While talking to the customer I come closer or sit next to
him/her. 17.1 % 344 15.1 % 182
12
(14) I use the customer's name to
greet him/her. 16.3 % 385 14.1 % 182
13
(1) I use accessories which are not too conspicuous (badges, brooches, hair
accessories). 5.5 % 344 6.8 % 182
14
(2) I introduce myself
by my first name. 5.1 % 344 4.9 % 182
| 147
As follows from the table of techniques, "I introduce myself …" (6 % and5 % respectively), and "I use accessories …" (5.5 % and 6.8 % respectively) are used very rarely.
If we compare the order of importance of individual statements in our research (Table 4) with the previous findings by other researchers (Table 1) we can observe a major deviation in statement 2 ("I introduce myself by my first name") and statement 6 ("I shake hands with customers"). These findings point to the fact that employees still have some manoeuvring space for increasing tips by personalizing the service (introduction, physical contact). We can also observe the relative restraint of the employees who prefer not to share a joke with a customer or use jokes in general while working (statements 7 and 9). By carrying out focus group sessions with employees, it was our intention to further explore why employees prefer some techniques to others and why some are not used at all. We have learned that employees are not familiar with the findings about which techniques affect tipping and in what way. They also believed that certain techniques cannot be applied to the circumstances in Slovenia for various reasons (e.g. internal rules forbid sitting down with the customer, it is too 'American to wear accessories, etc.).
The correlation between the number of techniques used and the frequency of tips received is positive (Table 5), that is the more techniques an employee knows and chooses to implement, the more frequently they will receive a tip.
Table 5: Pearson's correlation coefficient between the number of techniques applied for increasing the tip and the frequency of receiving a tip
How often have you received a tip lately?
Gaming industry Dealer’s staff Number of
applied
techniques for increasing the tip
Rank correlation
coefficient -0.484** -0.365**
Statistical significance
(two-sided test) 0.000 0.000 Number of respondents 444 197 **Statistically significant at p < 0.01 (a). *Statistically significant at p < 0.05 (a).
Source: Raspor 2010.
| 148
0.484)1, and for dealers (Pearson's correlation coefficient 0.365):employees that use more techniques also receive a tip more often. Employees in the gaming industry who usually receive tips (always receive tip, very often receive tip, often receive tip) use on average 6.18 techniques, while those who do not receive tips (rarely receive tip, almost never receive tip, never receive tip) use on average only 3.34 techniques (Table 6). Dealers who usually receive tips (always receive tip, very often receive tip, often receive tip) use an average of 5.93 techniques, while those who do not receive tips (rarely receive tip, almost never receive tip, never receive tip) use only 3.41 techniques on average.
Table 6: Number of applied techniques for increasing tips
What techniques for increasing the tips do you use at work?
Gaming industry Dealer’s staff Frequency of receiving
tips
N Mean N Mean
Always receive tip, very often receive tip, often receive tip
278 6.18 168 5.93
Rarely receive tip, almost never receive tip, never receive tip
166 3.34 29 3.41
Total 473 4.85 188 5.90
t-test (difference between two means)
F=31.447, stat. sig. < 0.0005
F=8.093, stat. sig. < 0.005
t=9.346, stat. sig. < 0.0005
t=4.071, stat. sig. < 0.000
Source: Raspor 2010.
It has also been established that those employees who receive tips frequently (always receive tip, very often receive tip, often receive tip) characteristically use most of the techniques more often (64 % or 9 out of 14 for those in the gaming industry). 50 % (7 out of 14) of the wait staff receive tips frequently if they use the techniques more often.
Discussion and recommendations
1 To interpret Spearman's correlation coefficient and Pearson's correlation coefficient we defined the
following scale: 0–0.1- no correlation; 0.11–0.3- weak correlation; 0.31–0.6 - medium correlation: more them
| 149
We can confirm both of the hypotheses:Hypothesis Statistical method Results shown
Hypothesis confirmed/ rejected H1: : "Dealers in the Slovenian
gaming industry do not use techniques for increasing tips"
Descriptive analysis (comparison on the basis of shares)
Table 3
Table 4 Confirmed
H2: "Dealers in the Slovenian gaming industry who use the techniques for increasing tips are more likely to receive a tip".
Pearson's correlation coefficient t-test
Table 5
Table 6 Confirmed
This research was carried out in various gaming enterprises across Slovenia. We obtained relevant results on the usage of techniques for increasing the tips among Slovenian gaming industry employees. The findings also confirm that employees who use the techniques generallyreceive tips more often.
Therefore, the research can be of practical value to managers and team leaders for motivating their employees to offer higher quality service. The research results can be a useful tool for managerial personnel in motivating and directing their subordinates towards offering a higher quality service. In accordance with Wang (2010), we strongly recommend that managers implement a policy of pooling tips.
The research highlights how techniques for increasing tips are applied among Slovenian gaming industry employees and how the application of these techniques can influence the frequency of tipping.
| 150
Conclusion
Our research showed that gaming industry employees in Slovenia are not familiar enough with and rarely apply techniques for increasing tips. We believe there are several reasons for that: (1) the tipping is traditionally part of the casino cultural repertoire, but (2) research on tipping techniques has only been carried out recently and (3) the managerial staff do not know how to use tipping to stimulate their employees towards higher quality service and flexibility, (4) although it has been established that gaming industry employees who use techniques for increasing tips receive them more frequently.
The estimation on the overall amount of tipping indicates that the relatively high sums might be of interest also to legislators. The law requires that the management of casinos must earmark the tips entirely from the employees' salaries. At the same time, the management team are excluded from the distribution of tipping income, and the distribution itself is dependent on the amount of tips gathered at specific work posts. An innovative approach – or a comprehensive reform of reward systems – is needed to increase the motivation of employees without increasing labour costs. In our opinion, increase in the share of tips in an individual employee’s income is a viable method which could be applied through training employees in methods for increasing tips.
References
AJPES, Agency of the Republic of Slovenia for Public Legal Records and Related Services (2007). Evidenca AJPES o obdelanih in javno objavljenih letnih poročilih gospodarskih družb za leto 2007. Retrieved May 25, 2008, from:
http://www.ajpes.si/prs/
Cornell Center for Hospitality research. Retrieved February 4, 2015, from:
http://www.hotelschool.cornell.edu/research/chr/
Lee Al. 2006. Wage Rate: Tipping Bartenders to Casino Dealers. Retrieved February 4, 2015, from:
http://www.payscale.com/career-news/2006/12/wages_tips_bart
Lobb, A. (2001). The logic and history of tipping. Retrieved September
26, 2015, from:
http://money.cnn.com/2001/10/07/pf/tipping/
Lynn, M. (2002). Turnover’s relationships with sales, tips and service across restaurants in a chain. International Journal of Hospitality
Management, 21, 443-47. DOI: 10.1016/S0278-4319(02)00026-9
Lynn, M. (2003). Tip levels and service: An update, extension and reconciliation. Cornell Hotel and Restaurant Administration Quarterly,
42, 139-48. DOI: 10.1016/S0010-8804(03)90118-2
Lynn, M. (2004).Mega Tips Scientifically Tested Techniques to Increase your Tips. Center for Hospitality ResearchTool, Cornell University,
| 151
Lynn, M. (2005). Increasing Servers’ Tips: What Managers Can Do andWhy They Should Do It. Journal of Foodservice Business Research,
8(4), 89-98. DOI: 10.1300/J369v08n04_07
Lynn, M. (2009). Individual differences in self-attributed motives for tipping: Antecedents, consequences and implications. International
Journal of Hospitality Management, 28, 432-438. DOI:
10.1016/j.ijhm.2008.10.009
Lynn, M. & McCall, M. (2000). Gratitude and Gratuity: A Meta-Analysis of Research on the Service-Tipping Relationship. Journal of
Socio-Economics, 29, 203-214. DOI: 10.1016/S1053-5357(00)00062-7
Lynn, M. & McCall, M. (2009). Techniques for Increasing Servers' Tips: How Generalizable Are They? Cornell Hospitality Quarterly 2009, 50, 198. DOI: 10.1177/1938965509334221
Parrett, B. M. (2003). The Give and Take on Restaurant Tipping. PhD dissertation, Virginia Polytechnic Institute and State University.
Paul, P. (2001, May). The tricky topic of tipping. American
Demographics, 10-11.
PwC Mexico. (2015) Global Gaming Industry Regulatory Frameworks. Retrieved February 25 , 2015, from:
http://www.pwc.com/
Raspor, A. (2002a). Napitnina kot dodatna stimulacija za delo,
Organizacija, 35(5), 285-295.
Raspor, A. (2002b). Napitnina na področju storitev – primer igralništvo, Kejžar, I. & Mlakar, P. (Eds.), XVII Posvetovanje DVD. (pp 141-152). Bled 16-17 May 2002. Kranj: Društvo za vrednotenje dela, organizacijski in kadrovski razvoj.
Raspor. A. (2009). Demografske značilnosti dajalcev napitnine v gostinstvu in igralništvu. 1. Znanstvena konferenca z mednarodno udeležbo. Management, izobraževanje in turizem.
Raspor. A. (2010). Vpliv razdeljevanja napitnin na motivacijo zaposlenih:
primerjava med gostinstvom in igralništvom. PhD dissertation,
Ljubljana: Fakulteta za družbene vede.
Raspor, A. (2011). The use of techniques for increasing servers’ tips.
Academica Turistica. 2/201.
SURS (2007). Statistični urad Republike Slovenije. Retrieved May 25, 2008, from:
http://www.stat.si
Wang, L. (2010). An investigation and analysis of U.S. restaurant tipping practices and the relationship to service quality with recommendations
for field application. Master of Science in Hotel Administration
University of Nevada, Las Vegas.