http://dx.doi.org/10.1590/bjpt-rbf.2014.0145
158 Braz J Phys Ther. 2016 Mar-Apr; 20(2):158-165
Effects of chest wall compression on expiratory flow rates
in patients with chronic obstructive pulmonary disease
Masafumi Nozoe1, Kyoshi Mase1, Tomoyuki Ogino2,
Shigefumi Murakami2, Sachie Takashima1, Kazuhisa Domen3
ABSTRACT | Background: Manual chest wall compression (CWC) during expiration is a technique for removing airway secretions in patients with respiratory disorders. However, there have been no reports about the physiological effects of CWC in patients with chronic obstructive pulmonary disease (COPD). Objective: To compare the effects of CWC on expiratory low rates in patients with COPD and asymptomatic controls. Method: Fourteen subjects were recruited from among patients with COPD who were receiving pulmonary rehabilitation at the University Hospital (COPD group). Fourteen age-matched healthy subjects were also consecutively recruited from the local community (Healthy control group). Airlow and lung volume changes were measured continuously with the subjects lying in supine position during 1 minute of quiet breathing (QB) and during 1 minute of CWC by a physical therapist. Results: During CWC, both the COPD group and the healthy control group showed signiicantly higher peak expiratory low rates (PEFRs) than during QB (mean difference for COPD group 0.14 L/sec, 95% conidence interval (CI) 0.04 to 0.24, p<0.01, mean difference for healthy control group 0.39 L/sec, 95% CI 0.25 to 0.57, p<0.01). In the between-group comparisons, PEFR was signiicantly higher in the healthy control group than in the COPD group (–0.25 L/sec, 95% CI –0.43 to –0.07, p<0.01). However, the expiratory low rates at the lung volume at the PEFR during QB and at 50% and 25% of tidal volume during QB increased in the healthy control group (mean difference for healthy control group 0.31 L/sec, 95% CI 0.15 to 0.47, p<0.01: 0.31 L/sec, 95% CI 0.15 to 0.47, p<0.01: 0.27 L/sec, 95% CI 0.13 to 0.41, p<0.01, respectively) but not in the COPD group (0.05 L/sec, 95% CI –0.01 to 0.12: –0.01 L/sec, 95% CI –0.11 to 0.08: 0.02 L/sec, 95% CI –0.05 to 0.90) with the application of CWC. Conclusion: The effects of chest wall compression on expiratory low rates was different
between COPD patients and asymptomatic controls.
Keywords: physical therapy modalities; chronic obstructive pulmonary disease; peak expiratory low rate.
Clinical Trials Identiier: UMIN000018923
BULLET POINTS
• We compared the effects of CWC on expiratory low rates in patients with COPD and asymptomatic controls. • It was conirmed that PEFR increased during CWC in COPD patients; however, PEFR changes during CWC were
lower in COPD patients than in healthy subjects.
• Although CWC appears to be less effective in increasing absolute expiratory low rates in COPD patients than in healthy subjects, the PEFR, which is more effective for removing secretions, did increase in the COPD group.
HOW TO CITE THIS ARTICLE
Nozoe M, Mase K, Ogino T, Murakami S, Takashima S, Domen K. Effects of chest wall compression on expiratory low rates in patients with chronic obstructive pulmonary disease. Braz J Phys Ther. 2016 Mar-Apr; 20(2):158-165 . http://dx.doi.org/10.1590/bjpt-rbf.2014.0145
1Department of Physical Therapy, Faculty of Nursing and Rehabilitation, Konan Women’s University, Morikita-machi, Higashinada-ku, Kobe, Japan
2Department of Rehabilitation, Hyogo College of Medicine Sasayama Medical Center, Kurooka-cho, Sasayama-shi, Hyogo, Japan
3Department of Physical Medicine and Rehabilitation, Hyogo College of Medicine, Mukogawa-cho, Nishinomiya-shi, Hyogo, Japan
Received: Mar. 07, 2015 Revised: July 21, 2015 Accepted: Oct. 15, 2015
Introduction
Manual chest wall compression (CWC) during expiration is a technique for removing airway secretions1,2.
It is known that the main physiological mechanism for removing secretions is increased expiratory low
rates due to increased pleural pressure3-5 and stretching of intercostal muscles by means of manual thoracic
compression applied during exhalation6. Several studies
have also shown that CWC increased expiratory low
rates, improved removal of airway secretions, and improved gas exchange and pulmonary mechanics2,6-8 in patients on mechanical ventilation6-11, as well as
Some studies showed positive effects8,13, but another study showed negative effects on clinical outcomes
with CWC, such as expiratory low limitation (EFL)6. It has also been reported that many physical
therapists often use manual chest physical therapy techniques in patients with acute exacerbations of chronic obstructive pulmonary disease (COPD)14. It is
great of importance for physical therapists to know the
physiological effects of CWC in patients with COPD.
It may also be harder to increase expiratory low rates
with CWC in COPD patients, because many COPD
patients often show dificulty increasing expiratory low rates because of airlow limitation15. However, there have been no reports of the physiological effects of CWC in patients with COPD.
The purpose of this study was to compare the effects
of CWC on expiratory low rates in patients with COPD and asymptomatic controls. We hypothesized that expiratory low rates during CWC are harder to
increase in COPD patients.
Method
Participants
This study was approved by the Hyogo College
of Medicine, Nishinomiya-shi, Hyogo, Japan Ethics
Committee (approval number 1189). Written, informed consent was obtained from all eligible participants. The study included fourteen clinically
stable patients with stage I to IV COPD according to the Global Initiative for Chronic Obstructive Lung
Disease guidelines (COPD group) who were receiving pulmonary rehabilitation at the Hyogo College of
Medicine Sasayama Medical Center between October 2012 and September 2013 and who could perform spirometric testing according to the ATS/ERS Task
Force Guidelines16. Forced expiratory volume in the
irst second (FEV1) and forced vital capacity (FVC)
were expressed as predicted percentage values for
age, sex, and height, established by the Japanese Respiratory Society17. The patients were clinically stable for ≥4 weeks. Exclusion criteria were suspected
asthma, other systemic conditions that could contribute to dyspnea or exercise limitation (e.g. heart failure or metabolic disorders), and neuromuscular comorbidity limiting all measurements or non-approval for study participation. All COPD patients continued their regular treatment (all COPD patients used inhaled long-acting
beta 2-agonists or long-acting muscarinic antagonists, and one patient used an inhaled corticosteroid). No
changes in the medications were made for the purpose
of the study. Fourteen age-matched healthy subjects were also consecutively recruited from the local community (healthy control group).
Measurement procedures
All measurements were collected with the subjects
in supine position. Airlow rates and lung volume
changes during 1 minute of quiet breathing and during
1 minute of CWC were measured via a mouth ilter (PIF-1A; MINATO Medical Science, Osaka, Japan) with a heated pneumotachograph (AE300-s; MINATO Medical Science). A mouth ilter was used to avoid
cross-infection. CWC was applied to each subject during expiration by a male physical therapist with 8 years of clinical experience in pulmonary physical therapy. The physical therapist stood on the right side of the subject and placed both hands on the
subject’s upper rib cage (upper part from the sixth rib).
CWC was started from the beginning of expiration to the end of expiration. The highest tolerable level
of force was applied to the subject’s chest wall then
released as soon as the subject began inspiration.
The subject was asked to avoid actively expiring
during the application of CWC but to inspire freely. All subjects also performed the inspiratory capacity
(IC) maneuver at the start during quiet breathing (QB)
and at the end during CWC to correct the volume measuring errors (“drift”)15.
Airlow and lung volume data were examined using an analysis system (PowerLab, ADInstruments, Castle Hill, NSW, Australia). The last ive breaths during QB and CWC were analyzed, and the mean values for
Ti (inspiratory time), Te (expiratory time), Ttot (total
breathing cycle time), Ti/Ttot (duty cycle), Vt (tidal volume), PIFR (peak inspiratory low rate), PEFR (peak expiratory low rate), PEFR/PIFR, Vt/Ti (mean inspiratory low rate), and Vt/Te (mean expiratory low rate) were obtained for each subject.
Flow volume (FV) curve analysis was also performed by calculating the average FV curves from the last ive breaths during QB and CWC18. The same analysis
system (PowerLab, ADInstruments) was also used for averaging FV curves. The expiratory low rate
changes during QB and CWC were then examined
at the same lung volume (PEFR during QB and at 50% and 25% of tidal volume during QB) and any overlap in the regions of the FV curves was determined. The presence of overlap was deined as a difference in the airlow rates within 5% between the two FV
160 Braz J Phys Ther. 2016 Mar-Apr; 20(2):158-165
Sample size calculation
The effects of CWC in COPD patients have not
been reported. The sample size was calculated using the differences in PEFR with the application of CWC in the irst seven subjects in each group. The mean
difference in the between-group comparison was
0.195 L/sec (standard deviation (SD) 0.183). A sample size of 14 subjects per group was thus required for
this study to have 80% power with alpha of 0.05.
Statistical analysis
The results are shown as means±SD. Normality
of the measurement data was examined using the
Kolmogorov-Smirnov test. The unpaired Student’s t-test or Mann-Whitney’s U-test was used to compare
demographic characteristics and lung function. The between-group sex distribution was compared using chi-square analysis. Within-group comparisons by CWC intervention were done using the paired
Student’s t-test or Wilcoxon’s rank-sum test, and
between-group comparisons by CWC intervention
were done using the unpaired Student’s t-test or Mann-Whitney’s U-test. A chi-square analysis was
performed to compare the ratios of subjects who showed overlapping regions between the COPD group and the healthy control group. All tests were
performed at a signiicance level of P<0.05. Analyses were performed with statistical software (SPSS 20, SPSS, Chicago, IL, USA).
Results
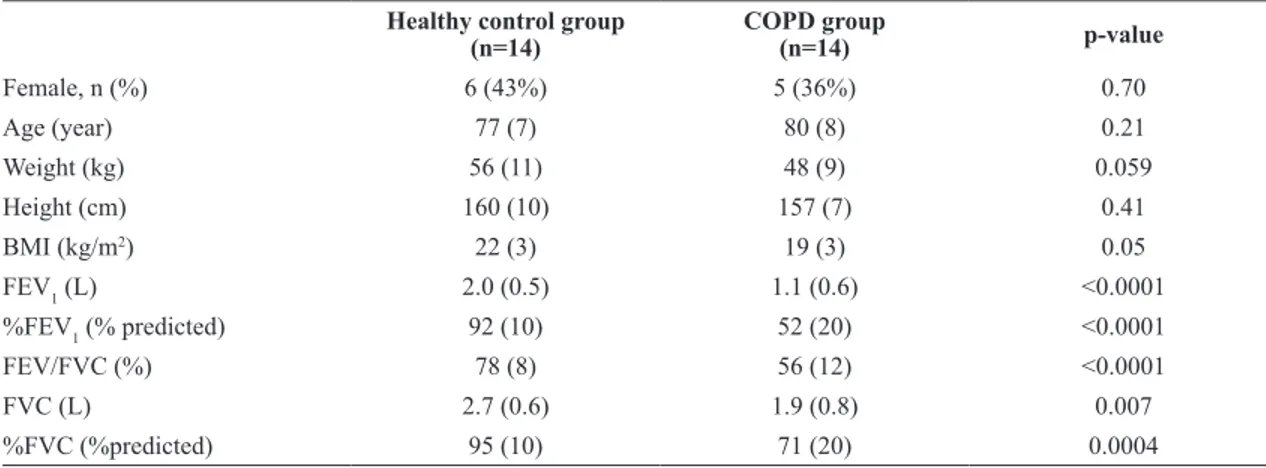
Table 1 shows the baseline characteristics of the
study participants. There were signiicant differences
between the groups in pulmonary function.
Table 2 shows the breathing pattern and lung volume
changes during QB and CWC. Ti, Te, Ttot, Vt, IC, PIFR, PEFR, and Vt/Ti increased signiicantly, and Ti/Ttot decreased signiicantly more during CWC than
during QB, both in the COPD group and in the healthy
control group, but Vt/Te increased signiicantly more
during CWC than during QB only in the healthy control
group. As a result, PIFR/PEFR was not different during QB and CWC in both groups. In the between-group comparisons, Vt, PIFR, PEFR, Vt/Ti, and Vt/Te were signiicantly higher in the healthy control group than
in the COPD group.
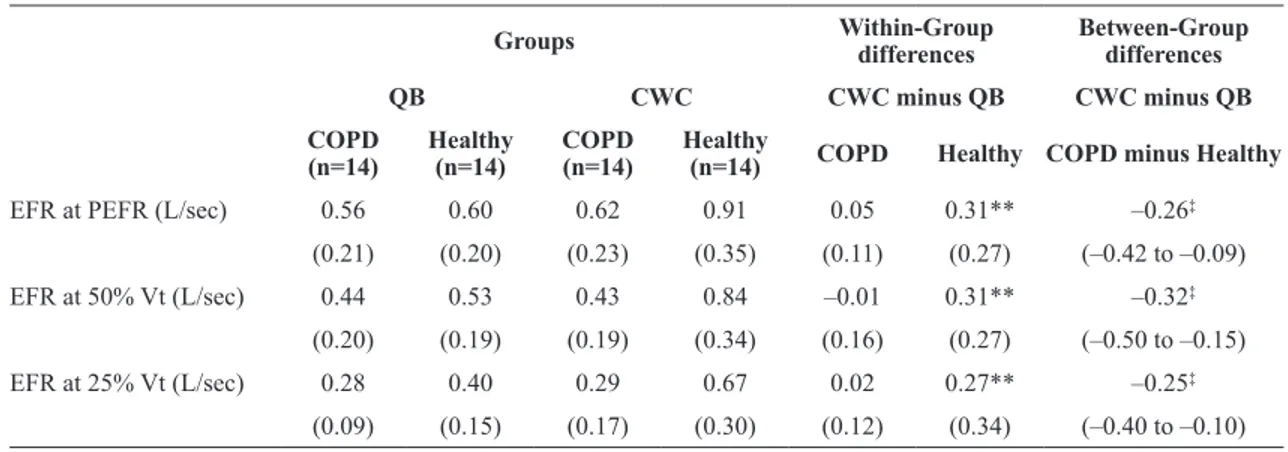
Table 3 shows the expiratory low rates at the same lung volume during QB and CWC. The expiratory
low rates at the lung volume at PEFR during QB and at 50% and 25% of tidal volume during QB were
higher only in the healthy control group, but not in the COPD group with CWC.
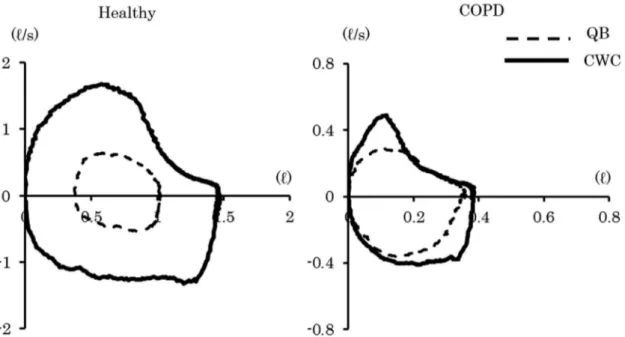
Figure 1 shows representative FV curves during QB and CWC in the COPD group and the healthy
control group. The left FV curves in the healthy control group show increased expiratory low rates at all lung volumes. In contrast, the right FV curves in the COPD group show increased expiratory low rates during CWC at the beginning
of expiration, but not at the end of expiration, and
the FV curves had overlapping regions. Less than
half of the subjects in the healthy control group
(6/14 subjects; 43%) had overlapping regions in the FV curves, but almost all subjects in the COPD
group had overlapping regions (13/14 subjects;
93%, P<0.05). All overlapping regions were seen
at the end of expiration.
Table 1. Baseline characteristics of the study participants.
Healthy control group (n=14)
COPD group
(n=14) p-value
Female, n (%) 6 (43%) 5 (36%) 0.70
Age (year) 77 (7) 80 (8) 0.21
Weight (kg) 56 (11) 48 (9) 0.059
Height (cm) 160 (10) 157 (7) 0.41
BMI (kg/m2) 22 (3) 19 (3) 0.05
FEV1 (L) 2.0 (0.5) 1.1 (0.6) <0.0001
%FEV1 (% predicted) 92 (10) 52 (20) <0.0001
FEV/FVC (%) 78 (8) 56 (12) <0.0001
FVC (L) 2.7 (0.6) 1.9 (0.8) 0.007
%FVC (%predicted) 95 (10) 71 (20) 0.0004
Table 2. Changes in breathing patterns and lung volumes during QB and CWC in both groups.
Groups Within-Group differences (95% CI)
Between-Group differences
(95% CI)
QB CWC CWC minus QB CWC minus QB
COPD (n=14)
Healthy (n=14)
COPD (n=14)
Healthy
(n=14) COPD Healthy
COPD minus Healthy
Ti (sec) 1.45 1.59 1.70 1.85 0.25* 0.26* –0.01
(0.45) (0.38) (0.61) (0.53) (0.34) (0.41) (–0.31 to 0.30)
Te (sec) 2.44 2.37 3.65 3.18 1.21** 0.81** 0.40
(0.99) (0.87) (1.27) (0.80) (0.80) (0.73) (–0.22 to 1.02)
Ttot (sec) 3.89 3.96 5.35 5.03 1.46** 1.07** 0.39
(1.37) (1.20) (1.74) (1.17) (0.94) (0.99) (–0.39 to 1.16)
Ti/Ttot 0.38 0.41 0.32 0.37 –0.06** –0.04* –0.02
(0.05) (0.05) (0.06) (0.05) (0.05) (0.07) (–0.07 to 0.03)
Vt (L) 0.61 0.68 0.86 1.22 0.25** 0.55** –0.30†
(0.22) (0.17) (0.29) (0.46) (0.17) (0.39) (–0.54 to –0.05)
IC (L) 1.54 2.17 1.68 2.39 0.14** 0.22** –0.08
(0.71) (0.58) (0.77) (0.55) (0.14) (0.16) (–0.20 to 0.04)
PIFR (L/sec) 0.57 0.56 0.76 0.93 0.19** 0.37** –0.18†
(0.13) (0.15) (0.24) (0.28) (0.19) (0.25) (–0.36 to –0.01)
PEFR (L/sec) 0.56 0.60 0.70 0.99 0.14** 0.39** –0.25‡
(0.21) (0.20) (0.24) (0.36) (0.16) (0.27) (–0.43 to –0.07) PEFR/PIFR 0.97 1.05 0.97 1.06 0 0.01 –0.01
(0.27) (0.15) (0.24) (0.18) (0.30) (0.21) (–0.22 to 0.19)
Vt/Ti (L/sec) 0.45 0.44 0.52 0.67 0.09** 0.23** –0.14‡
(0.11) (0.12) (0.16) (0.17) (0.10) (0.14) (–0.23 to –0.04)
Vt/Te (L/sec) 0.26 0.31 0.24 0.40 –0.03 0.09 –0.12‡
(0.08) (0.10) (0.06) (0.15) (0.06) (0.12) (–0.19 to –0.04)
Results expressed as mean (standard deviation) and mean difference and 95% conidence intervals (CI) between measurement conditions. COPD: chronic obstructive pulmonary disease group; Healthy, healthy control group; QB: quiet breathing; CWC: chest wall compression; Ti: inspiratory time; Te: expiratory time; Ttot: total breathing cycle time; Ti/Ttot: duty cycle; Vt: tidal volume; IC: inspiratory capacity; PIFR: peak inspiratory low rate; PEFR: peak expiratory low rate; Vt/Ti: mean inspiratory low rate; Vt/Te: mean expiratory low rate. *, **: Signiicant change between QB and CWC (P<0.05, P<0.01).†, ‡: Signiicant change between COPD group and healthy control group (P<0.05, P<0.01).
Table 3. Changes in expiratory low rates at the same lung volume during QB and CWC in both groups.
Groups Within-Group differences Between-Group differences
QB CWC CWC minus QB CWC minus QB
COPD (n=14)
Healthy (n=14)
COPD (n=14)
Healthy
(n=14) COPD Healthy COPD minus Healthy
EFR at PEFR (L/sec) 0.56 0.60 0.62 0.91 0.05 0.31** –0.26‡
(0.21) (0.20) (0.23) (0.35) (0.11) (0.27) (–0.42 to –0.09)
EFR at 50% Vt (L/sec) 0.44 0.53 0.43 0.84 –0.01 0.31** –0.32‡
(0.20) (0.19) (0.19) (0.34) (0.16) (0.27) (–0.50 to –0.15)
EFR at 25% Vt (L/sec) 0.28 0.40 0.29 0.67 0.02 0.27** –0.25‡ (0.09) (0.15) (0.17) (0.30) (0.12) (0.34) (–0.40 to –0.10)
Results expressed as mean (standard deviation), and mean difference and 95% conidence intervals (CI) between measurement conditions. COPD: chronic obstructive pulmonary disease group; Healthy: healthy control group; QB: quiet breathing; CWC: chest wall compression;
EFR: expiratory low rates; PEFR: peak expiratory low rates; Vt: tidal volume. **: Signiicant change between QB and CWC (P<0.01).
162 Braz J Phys Ther. 2016 Mar-Apr; 20(2):158-165
Discussion
In this study, the effects of CWC were examined in COPD patients, and it was conirmed that PEFR
increased during CWC in these patients. However,
PEFR changes during CWC were lower in COPD
patients than in healthy subjects. The reason for the difference may have been the presence of expiratory
low limitation (EFL) in the COPD patients. With EFL, the expiratory low rates never increase with
increased pleural pressure, and this is often seen in patients with severe COPD19. Ninane et al.20
reported assessment of EFL by studying whether the expiratory low rates could be increased by increased
pleural and abdominal pressures with abdominal
compression during expiration. In the present study,
CWC also increased pleural pressure by upper rib cage compression, but the participants whose expiratory
low rates did not increase during CWC probably had EFL, though the area of compression differed from that of Ninane et al.20. In fact, almost all COPD patients showed overlapping regions in the FV curves during QB and CWC, which suggests that it is dificult for COPD patients to increase expiratory low rates
during CWC. One more reason to consider for the
discrepancy in PEFR changes between healthy and COPD participants is the increase in Vt with CWC. Generally, increasing Vt provides higher elastic forces
at the start of exhalation, therefore healthy subjects
have a tendency to increase expiratory low rates
more than COPD patients do.
In this study, expiratory low rate changes during CWC were also examined using FV curves. PEFR and Vt have often been measured during various chest
physical therapy techniques2,4,7, but FV curves during these interventions have not been previously studied, except in a recent study on patients on mechanical ventilation6. The advantage of using FV curve assessment
is to examine the expiratory low changes at absolute
volume in peripheral airway regions3. The expiratory
low rates at the lung volume at PEFR during QB and at 50% and 25% of tidal volume during QB increased
only in the healthy control group, but not in the COPD group. Moreover, almost all COPD patients showed
overlapping regions in the FV curves. This showed that it is dificult for COPD patients to increase expiratory low in peripheral airways with CWC.
The present results showed that PEFR/PIFR did
not change with CWC in the COPD group or in the healthy control group. McCarren and Alison3
reported that PEFR/PIFR increased during vibration to 1.51 in CF patients. It was concluded that vibration was useful for CF patients because the PEFR/PIFR
value needs to increase to more than 1.1 to remove secretions3. However, there were some differences between their methods and the present methods.
They asked their subjects to inspire to total lung
capacity as slowly as possible3. On the other hand,
Figure 1. Representative low-volume curves during QB and CWC. The left side shows a healthy subject, and the right side shows a
they did not ask subjects to inspire slowly in their
other study of normal healthy subjects5. In the present study, the participants were instructed to inspire freely, therefore it was not possible to determine inspiratory lung volume and breathing speed. McCarren et al.5
reported that not only PEFR but also PIFR increased during CWC in normal subjects, so that PEFR/PIFR decreased more during CWC (to 0.64) than during QB (to 0.72). These results suggest that CWC must
be combined with slow deep inspiration for effective
removal of secretions. In the present results, Ti, Te,
and Ttot also increased during CWC in both groups.
Such changes were also seen during pursed-lips
breathing (PLB) in COPD patients21,22 because of the increased inspiratory effort during PLB. We
hypothesized that increased inspiratory effort was the
result of maintaining ventilation, because decreased respiratory frequency was seen not only during PLB but also CWC. Furthermore, we believe that the reason
for the greater PIFR and Vt/Ti changes with CWC
in the healthy control group compared to the COPD
group was the presence of hyperinlation in COPD patients. It is known that lung hyperinlation leads to decreased inspiratory low reserve by the increased
elastic recoil pressure of the lung or the decreased inspiratory muscle-generated force15.
In the present results, tidal volume was increased
with CWC in both groups, but the increase was greater in the healthy control group than in the COPD group. We thought this difference was also explained by the
differences in Vt/Ti between the groups. In contrast, IC increased with CWC in both groups. It is known that IC changes are associated with changes in
end-expiratory lung volume, so this technique may
reduce hyperinlation, such as that shown in PLB21,22. In fact, CWC has been used as a technique to reduce dyspnea by reducing hyperinlation, particularly in Japanese clinical practice23.
Limitations of the study
CWC effects were measured in the supine position, but this position may affect the expiratory
low changes. Koulouris et al.24 reported that COPD patients often have EFL, particularly in the supine
position. The decreased functional residual capacity
(FRC) in the supine position decreases elastic lung recoil and expiratory low reserve. On the other hand,
McCarren et al.4 applied CWC to their subjects in
the lateral recumbent position. FRC values are higher
in the lateral recumbent position than in the supine position25, so these differences may have affected
the present results. However, the supine position was chosen because it provides more powerful chest compression, as shown by Toussaint et al.26. Moreover, CWC was applied to the upper rib cage in the present study, even though it was applied to the lower rib cage in other studies2-5. It is more
dificult to apply CWC to the lower rib cage due to
the presence of breasts in women; since there were subjects of both sexes in this sample, applying CWC to the upper rib cage was an alternative to achieve
better standardization. Some of the healthy subjects
in the present study also had overlapping regions
in their FV curves. This may be due to age-related
changes. The present subjects included many elderly persons, and their mean age was also very advanced.
Since it is known that elastic lung recoil pressure and FRC decrease with age27, some of the present healthy subjects may have had EFL. However, expiratory low rates and tidal volume were different between
the COPD group and the healthy control group. Thus, there appears to be a difference in the effects of CWC depending on the presence of COPD, even if age-related effects are excluded.
Another possible limitation was that changes in the amounts of secretions with CWC intervention and the longitudinal effects of CWC were not measured.
Since the subjects were not asked to inspire to total
lung capacity, the lung volume effects could not be
controlled. It has been reported that chest physical
therapy technique has low reliability28. In the present study, the effects of CWC performed by one physical therapist were examined, so that the same results
may not be generalized to other physical therapists.
Moreover, either the physical therapist or the assessor
were not blinded. This lack of blinding may also affect
the results of the study.
Clinical implications
In this study, peak expiratory low rates, but not mean expiratory low rates, increased in COPD patients. Volpe et al.29 reported that peak expiratory and inspiratory lows are the key factors
in secretion removal, not mean expiratory and
inspiratory lows. Therefore, we believe that it
would be effective to use CWC in patients with COPD to remove secretions when combined with slow inspiration, even though it would be less effective than in healthy subjects. We also showed
164 Braz J Phys Ther. 2016 Mar-Apr; 20(2):158-165
Conclusion
The present results showed higher PEFR during
CWC than during QB, both in COPD patients and in
healthy subjects, but absolute expiratory low rates
during CWC increased only in healthy subjects, not in
COPD patients. As a result, PEFR and Vt/Te increased
with CWC more in healthy subjects than in COPD patients. Although CWC appears to be less effective
in increasing absolute expiratory low rates in COPD patients than in healthy subjects, the PEFR, which is
more effective for removing secretions, did increase in the COPD group.
References
1. Branson RD. Secretion management in the mechanically ventilated patient. Respir Care. 2007;52(10):1328-42,
discussion 1342-7. PMid:17894902.
2. Unoki T, Kawasaki Y, Mizutani T, Fujino Y, Yanagisawa Y,
IshimatsuS, et al. Effects of expiratory rib-cage compression on oxygenation, ventilation, and airway-secretion removal in patients receiving mechanical ventilation. Respir Care.
2005;50(11):1430-7. PMid:16253149.
3. McCarren B, Alison JA. Physiological effects of vibration in subjects with cystic fibrosis. Eur Respir J. 2006;27(6):1204 -9. http://dx.doi.org/10.1183/09031936.06.00083605.
PMid:16455834.
4. McCarren B, Alison JA, Herbert RD. Manual vibration increases expiratory flow rate via increased intrapleural
pressure in healthy adults: an experimental study.Aust J
Physiother. 2006;52(4):267-71. http://dx.doi.org/10.1016/
S0004-9514(06)70006-X. PMid:17132121.
5. McCarren B, Alison JA, Herbert RD. Vibration and its effect on the respiratory system. Aust J Physiother. 2006;52(1): 39-43. http://dx.doi.org/10.1016/S0004-9514(06)70060-5.
PMid:16515421.
6. Guimarães FS, Lopes AJ, Constantino SS, Lima JC, Canuto P, MenezesSL. Expiratory rib cage compression, secretion clearance and respiratory mechanics in mechanically
ventilated patients: A randomized crossover trial.Respir Care.
2014;59(5):678-85. http://dx.doi.org/10.4187/respcare.02587.
PMid:24106324.
7. Genc A, Akan M, Gunerli A. The effects of manual hyperinflation with or without rib-cage compression in mechanically ventilated patients. Italian Journal of Physiotherapy. 2011;1(2):48-54.
8. Martí JD, Li Bassi G, Rigol M, Saucedo L, Ranzani OT,
Esperatti M, et al. Effects of manual rib cage compressions on expiratory flow and mucus clearance during mechanical ventilation. Crit Care Med. 2013;41(3):850-6. http://dx.doi.
org/10.1097/CCM.0b013e3182711b52. PMid:23314585. 9. MacLean D, Drummond G, Macpherson C, McLaren G,
Prescott R. Maximum expiratory airflow during chest physiotherapy on ventilated patients before and after the application of an abdominal binder. Intensive Care Med. 1989;15(6):396-9. http://dx.doi.org/10.1007/BF00261500.
PMid:2808898.
10. Gregson RK, Shannon H, StocksJ, Cole TJ, Peters MJ, Main
E. The unique contribution of manual chest compression-vibrations to airflow during physiotherapy in sedated, fully ventilated children. Pediatr Crit Care Med. 2012;13(2):e97
-102. http://dx.doi.org/10.1097/PCC.0b013e3182230f5a.
PMid:21666530.
11. Unoki T, Kawasaki Y, Mizutani T, Fujino Y, Yanagisawa Y,
IshimatsuS, et al. Effects of expiratory rib-cage compression on oxygenation, ventilation, and airway-secretion removal in patients receiving mechanical ventilation. Respir Care.
2005;50(11):1430-7. PMid:16253149.
12. Wong WP, ParatzJD, Wilson K, Burns YR. Hemodynamic and ventilatory effects of manual respiratory physiotherapy
techniques of chest clapping, vibration, and shaking in an
animal model. J Appl Physiol. 2003;95(3):991-8. http://dx.doi.
org/10.1152/japplphysiol.00249.2003. PMid:12754172. 13. Berti JS, Tonon E, Ronchi CF, Berti HW, Stefano LM, Gut
AL, et al. Manual hyperinflation combined with expiratory
rib cage compression for reduction of length of ICU stay
in critically ill patients on mechanical ventilation. J Bras Pneumol. 2012;38(4):477-86. http://dx.doi.org/10.1590/
S1806-37132012000400010. PMid:22964932.
14. OsadnikCR, McDonald CF, Holland AE. Airway clearance
techniques in acute exacerbations of COPD: a survey
of Australian physiotherapy practice. Physiotherapy.
2013;99(2):101-6. http://dx.doi.org/10.1016/j.physio.2012.01.002.
PMid:23219648.
15. Johnson BD, Weisman IM, Zeballos RJ, BeckKC. Emerging concepts in the evaluation of ventilatory limitation during
exercise: the exercise tidal flow-volume loop. Chest. 1999;116(2):488-503. http://dx.doi.org/10.1378/chest.116.2.488.
PMid:10453881.
16. Miller MR, Crapo R, HankinsonJ, Brusasco V, Burgos F, Casaburi R, et al. General considerations for lung function testing. Eur Respir J. 2005;26(1):153-61. http://dx.doi.org/1
0.1183/09031936.05.00034505. PMid:15994402.
17. Hanamoto S, Ohsuji T, Tsuyuguchi I, KawabataS, KimuraK. Prediction formulas for pulmonary function tests expressed
in linear and exponential form for healthy Japanese adults. Nihon Kyobu Shikkan Gakkai Zasshi. 1992;30(12):2051-60.
PMid:1289624.
18. Nozoe M, Mase K, MurakamiS, Okada M, Ogino T, Matsushita
K, et al. Relationship between spontaneous expiratory flow-volume curve pattern and air-flow obstruction in elderly COPD patients. Respir Care. 2013;58(10):1643-8.
http://dx.doi.org/10.4187/respcare.02296. PMid:23571516. 19. KoulourisNG, Kaltsakas G, Palamidas AF, Gennimata SA.
Methods for assessing expiratory flow limitation during tidal breathing in COPD patients. Pulm Med. 2012; 2012: 1-8.
20. NinaneV, Leduc D, KafiSA, Nasser M, Houa M, Sergysels
R. Detection of expiratory flow limitation by manual compression of the abdominal wall. Am J Respir Crit Care Med. 2001;163(6):1326-30. http://dx.doi.org/10.1164/
ajrccm.163.6.2004150. PMid:11371396.
21. Bianchi R, Gigliotti F, RomagnoliI, Lanini B, Castellani C,
Binazzi B, et al. Patterns of chest wall kinematics during volitional pursed-lip breathing in COPD at rest. Respir Med. 2007;101(7):1412-8. http://dx.doi.org/10.1016/j.
22. Bianchi R, Gigliotti F, RomagnoliI, Lanini B, Castellani C,
Grazzini M, et al. Chest wall kinematics and breathlessness during pursed-lip breathing in patients with COPD. Chest.
2004;125(2):459-65. http://dx.doi.org/10.1378/chest.125.2.459.
PMid:14769725.
23. Yoshimi K, UekiJ, SeyamaK, Takizawa M, Yamaguchi S,
KitaharaE, et al. Pulmonary rehabilitation program including respiratory conditioning for chronic obstructive pulmonary
disease (COPD): Improved hyperinflation and expiratory
flow during tidal breathing. J Thorac Dis. 2012;4(3):259-64.
PMid:22754664.
24. KoulourisNG, Valta P, Lavoie A, Corbeil C, Chassé M, Braidy J, et al. A simple method to detect expiratory flow limitation during spontaneous breathing. Eur Respir J. 1995;8(2):306-13. http://dx.doi.org/10.1183/09031936.95.
08020306. PMid:7758567.
25. Lumb AB, NunnJF. Respiratory function and ribcage contribution to ventilation in body positions commonly used during anesthesia. Anesth Analg. 1991;73(4):422-6.
http://dx.doi.org/10.1213/00000539-199110000-00010.
PMid:1897767.
26. Toussaint M, Boitano LJ, Gathot V, Steens M, Soudon P. Limits of effective cough-augmentation techniques in patients
with neuromuscular disease. Respir Care. 2009;54(3):
359-66. PMid:19245730.
27. JanssensJP, Pache JC, Nicod LP. Physiological changes in respiratory function associated with ageing. Eur Respir
J. 1999;13(1):197-205. http://dx.doi.org/10.1183/09031936
.99.14614549. PMid:10836348.
28. Shannon H, Gregson R, StocksJ, Cole TJ, Main E. Repeatability of physiotherapy chest wall vibrations applied to spontaneously breathing adults. Physiotherapy. 2009;95(1):36-42. http://
dx.doi.org/10.1016/j.physio.2008.08.004. PMid:19627684.
29. VolpeMS, Adams AB, Amato MBP, Marini JJ. Ventilation patterns influence airway secretion movement. Respir Care.
2008;53(10):1287-94. PMid:18811989.
Correspondence Masafumi Nozoe
Konan Women’s University Faculty of Nursing and Rehabilitation
Department of Physical Therapy
6-2-23, Morikita-machi, Higashinada-ku Kobe, Japan