A
rti
g
o
*e-mail: [email protected]
#Programa de Pós-Graduação em Ciência Ambiental/Laboratório de Geologia e Geofísica Marinha
THE ATTENUATION OF CONCENTRATIONS MODEL: A NEW METHOD FOR ASSESSING MERCURY MOBILITY IN SEDIMENTS
Julio C. Wasserman*#
Departamento de Análise Geo-Ambiental, Instituto de Geociências, Universidade Federal Fluminense, Av. Litorânea, s/n, 24210-340 Niterói - RJ
Everaldo L. Queiroz
Departamento de Zoologia, Instituto de Biologia, Universidade Federal da Bahia, CP 7167, 41811-970 Salvador - BA
Recebido em 14/10/02; aceito em 22/8/03
In this work we propose a new approach for the determination of the mobility of mercury in sediments based on spatial distribution of concentrations. We chose the Tainheiros Cove, located in the Todos os Santos Bay, Brazil, as the study area, for it has a history of mercury contamination due to a chloro-alkali plant that was active during 12 years. Twenty-six surface sediment samples were collected from the area and mercury concentrations were measured by cold vapour atomic absorption spectrophotometry. A contour map was constructed from the results, indicating that mercury accumulated in a “hot spot” where concentrations reach more than 1 µg g-1. The model is able to estimate mobility of mercury in the sediments based on the distances between iso-concentration contours that determines an attenuation of iso-concentrations factor. Values of attenuation ranged between 0.0729 (East of the hot spot, indicating higher mobility) to 0.7727 (North of the hot spot, indicating lower mobility).
Keywords: mercury; mobility; sediments.
INTRODUCTION
The determination of metallic concentrations in sediments has shown to provide reliable informations on the degree of contamination of the environment. Nonetheless, a number of studies had indicated that there is a lack of correlation between total metal concentrations and toxicity1-3. In these studies the chemical form and consequently mobility of the metals were considered more important, in defining toxicity, than total concentrations alone. The search for determining mobility gave rise to the development of a myriad of chemical procedures that selectively extract metals, among them, the partial extractions and sequential extractions4-7. Even though the selective procedures have been used since the early seventies, until today, these methods are subject to critics, for they do not reproduce environmental condition, but are merely operational extractions8-10. The assumption that, for instance, acid volatile sulphide (AVS) extraction procedure yields toxic bio-available cadmium11 can be considered unreliable because, the cadmium content in extracts resulting from the 6 N nitric acid leaching has no geochemical meaning, a harsh situation that is never observed in the natural environment.
The mobility and toxicity can also be assessed with the use of mineralogical and granulometric corrections12. Mineralogical corrections can distinguish between natural metals, that are in the lattice of clays, and anthropogenic metals that are less tightly bound to sediments. These corrections can be done with the so-called conservative elements, mainly those that appear as major compounds in clay minerals13. Aluminium has shown to be an adequate correcting element14, for it is present in clay minerals in large concentrations (percentages), it is relatively unreactive and the anthropogenic sources are minor when compared with natural ones. Iron has also been used to correct surface sediment concentrations15, yet its redox sensibility is a limiting factor for its application, mainly in sediment cores16. Although largely used, mineralogical corrections give only a rough
estimate of the relatively mobile and extremely immobile metals present in the sediments. For instance, in this case, no distinction is possible between adsorbed metals and metals trapped in the very stable sulphide complexes.
Granulometric corrections are supported by researchers that consider that metals can only be associated with fine grained particles (smaller than 63 µm). In their view, no association is possible with the coarser quartz grains that constitute the sand fraction17. More recent works showed that metals can form colloidal films in the surface of the quartz grains, that may contain significant concentrations of metals that are completely neglected when granulometric correction is applied. In sediments with very little amounts of fine grained particles, Wasserman et al.16 obtained the impossible concentrations of 263% of iron in a sediment sample.
Concluding, the search for procedures that yield reliable informations on the mobility of metals is far from being resolved. Nonetheless, the procedures developed until now are only based on chemical or physical fractionations, that frequently are operational and do not reproduce environmental processes. New procedures, based on geographical modelling has not yet been tested and may represent a promising path for evaluating metal mobility.
In the present work a new and simple model that assess mobility of metals in the sediment is proposed. This model is based on the spatial distribution of metals in surface sediments and generates values that describe the attenuation of the metal concentrations from a hot spot in different directions. The faster the concentrations fall from the hot spot (strong attenuation) the less mobile is the metal. In order to illustrate the use of the model, it was applied to an evaluation of mercury contamination in the sediments from the Tainheiros Cove, a degraded environment within the Todos os Santos Bay (Bahia, Brazil).
EXPERIMENTAL PART Study area
covering an area of 1,100 km2. Historical Portuguese occupation started in the early XVIth century, with the arrival of the fleet of Americo Vespucio. Later the city of Salvador (funded in 1549), built within the margin of the bay became the first Capital of Brazil and the environment was subject to increasing population growth and consequent degradation. In the years 1960 the region suffered from a large wave of industrial development, that was responsible for the construction of around 200 units. Metallurgic, textile, powder and chemical plants are among the most polluting18, 19. Population growth as a result of the industrial development accounted as a further factor for the degradation of the bay. Presently, the Todos os Santos Bay is being submitted to an important programme for non-point pollution eradication (mainly domestic sewage), but results are still far from being detectable.
The industrial activities have been introducing heavy metals directly into the aquatic environment, generating a widespread contamination with lead, cadmium and zinc20. Tavares et al.21 studied metallic concentration in molluscs of the bay and could determine that levels where above WHO limits. They estimated that 400 tons of cadmium and another 400 tons of lead were dumped in the bay by industrial activities located in the drainage basins. These same authors also analysed mercury in the molluscs that presented abnormal values. The physiography of the region is characterised by a typical submerged Mesozoic coast, where the quaternary deposits are absent or poorly developed. Further inland, in the drainage basin of the bay,
the geology shifts to Precambrian grounds. Among the six main fresh water inputs to the bay, the Paraguassú river, in the north-western part is the most important22. The freshwater inputs of the bay are insignificant when compared to tidal inputs and do not affect the mean salinity that ranges between 35 and 37, very close to the seawater salinity. The tidal prism is the main factor responsible for the currents (that can reach 80 cm s-1) and for the low residence time of the waters in the system (30 h23).
The climate of the region was classified as humid and tropical, Af in the classification of Köppen. The average annual precipitation is 1,500 mm and the temperatures are warm, averaging 25° C24.
After Hertz25 the most important vegetation formation of the Todos os Santos Bay shoreline is mangrove, that covers over 15 km2, forming very large and dense forests. Although mangrove ecosystems are still widespread in the region, their conservation status is decreasing, where human populations occupies the shoreline. The Tainheiros Cove is an example where large mangrove stands where completely substituted by very poor shantytown.
During the early 1970’s a chlor-alkali plant was settled in the neighbourhood of the Tainheiros Cove (Figure 1) and produced discharges loaded with some 900 kg mercury year-1. After 12 years the activity became economically less interesting and the plant activity ceased, leaving a liability of around 10 tonnes of mercury in the environment. By this time the region had housed some 100,000 people who used the area for the exploitation of mussels and fishing21. A considerable amount of the mussels and fishes were directly consumed by the community and another part was sold in the region’s markets. Although the calculations of the mercury dose, based on dietary intakes and concentrations in molluscs and fishes indicated a possible contamination of the population26, for unknown reasons the concentrations in human hair27 did not reach values above the limits established by WHO. Some authors attributed to the “dendê”, a cooking plant oil with a very high boiling point, that is widely used in the region, the loss by volatilisation of mercury during boiling of the sea food. Nonetheless, no direct evidence of this loss has ever been presented yet.
In a study in the same area, Tavares et al.28 reported sediment contamination with mercury and the results presented in this work confirm this finding. Nonetheless, the mobility of the mercury present in the sediment has never been assessed, neither by fractionation studies (e.g. sequential extractions), nor by speciation (e.g. measurement of alkylated forms).
Sampling and analytical procedures
The sediment samples were collected in 1998 from an outboard boat with a stainless steal Petersen bottom grab in the 26 sites described in Figure 1. A fraction of sediment that was not in contact with the surface of the grab was separated and placed in plastic zip-lock bags and immediately cooled to 4 °C for transportation. In the laboratory, the samples were frozen and stored at -20 °C. Within a few weeks, the samples were oven dried at less than 40 °C under a constant air flow for three days, ground with an agate mortar and stored in sealed plastic bags until analysis.
River Sediment (NIST SRM 2704), showing an error smaller than 5%.
Attenuation of concentrations model
The results were plotted in an contour (iso-concentrations) map with the program Surfer using the Krigging method of interpolation. Krigging method has proven useful for it produces iso-concentrations maps from irregularly spaced data, avoiding isolated bull’s-eye type contours.
The concept of attenuation of concentrations proposed here is distinct from the ‘natural attenuation’ largely applied in soil and groundwater sciences. “Natural attenuation” is defined as “naturally occurring processes in the environment that act without human intervention to reduce the mass, toxicity, mobility, volume, or concentration of contaminants in those media”30. The principle of the attenuation of concentrations model presented in this work is based on the distance between contours of concentrations of a metal, determining its degree of geographic homogeneity (Table 1). The smaller are the distances between the contours, the faster concen-trations decrease (less homogeneous distribution) and in such conditions the mobility of the metal is low. On the other hand, for bigger distances between contours, the distribution of the metal is homogeneous due to a higher mobility. In order to distinguish our model from the “natural attenuation”, the term “attenuation of concentrations” is proposed.
The attenuation of the concentration (hereafter called “A”) is given by the slope coefficient from a first degree equation describing the decrease in concentration from a hot-spot (HS in Figure 2) until lower concentrations point (B or C in Figure 2). The straights from segments HS - B and HS - C are plotted in the graph of Figure 3 and the slopes
in the given equations correspond to A. It is worth of note that the value of second term of the equation (where x = 0) is meaningless for the model. Further, the negative sign is due to the fact that the higher concentrations are plotted on the left hand of the graph, therefore has no meaning for the model.
In the case of the Tainheiros Cove, we chose to place one segment for every 18° angle, starting from the East, clockwise. The values of A were plotted in the median point of each segment and another contour map could be designed, showing the mobility distribution of mercury in the study area.
RESULTS AND DISCUSSIONS
The comparison between total mercury concentrations and those of the literature shows that although the concentrations in the Tainheiros Cove are not among the world’s highest, they are considerably above the background levels that should be considered as low as 5 µg kg-1 (Table 2).
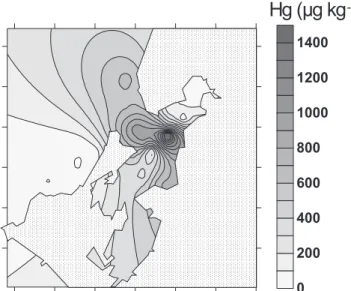
The Figure 4 shows the distribution of mercury concentrations in the sediments of the Tainheiros Cove. The concentrations indicate a considerable contamination of the sediments, mainly in the central part of the system that is not necessarily associated with the dumping of mercury from the chlor-alkali plant, but certainly to favourable accumulation conditions . For the attenuation of concentrations model, whenever there is no accumulation of the contaminant in the sediment, the site is considered unpolluted, even if it is associated with a known source of the contaminant.
Table 1. Relationship between attenuation of concentrations (A) and mobility of the pollutant
Attenuation value A Distance between contours Mobility
Smaller values Higher distances Higher
(homogeneous distribution) mobility
Higher values Smaller distances Smaller
(heterogeneous distribution) mobility
Table 2. Comparison of the mercury concentrations obtained in this study with the results obtained for other environments
Study area Range (µg kg-1) Ref.
Clyde river (England) <50 - 3,680 31
Everglade estuary (USA) 220 - 1,860 32
Guanabara Bay (Brazil) 320 - 3,380 5
Guanabara Bay (Brazil) 50 - 37,200 33
Average shale 400 34
Tainheiros Bay (Brazil) n.d. - 37,480 35
Tainheiros Bay (Brazil) <5 - 1,710 This study
n.d. = non detectable (no mention to the detection limits appears in the publication)
Figure 3. Plot of the concentrations against distance showing straights of regression and equations. Each point corresponds to intersection of the segments and contours. Circles represent the segment HS – B and squares represent the segment HS – C in Figure 2
In the Tainheiros Cove, the presence of only one very well defined hot spot (1,710 µg kg-1) facilitates the application of the attenuation of concentrations model, because only one system of segments starting radially from that hot spot can be designed. Nonetheless, multi-hot-spot systems theoretically can also be modelled.
The A values of the segments starting at 0° angle (that corresponds to the East direction) and running clockwise were presented in Table 3. It can be observed that for the angle 0° (full East), the distance between contours is large, yielding a relatively small value of A (0.1500). If we pick another direction like 90° (full North), the value of A (0.6471) is considerably higher, indicating a smaller mobility in this direction.
The values of Table 3 were plotted in the median of each segment to generate another contour map, the attenuation of concentrations distribution, shown in Figure 5. In the future, data from Table 3 will
be comparable with values from other environments and other metals The model constitute the subject of a few projects in the Guanabara Bay and Sepetiba Bay (Rio de Janeiro) that are being carried out by our laboratory.
The map in Figure 5 shows that there are two areas of higher A corresponding to directions where there is very small dispersion of the mercury. On the other hand, the lower values of A in the direction East-West indicates a tendency of spreading of the metals. The model indicated that while there is a geochemical barrier in the South and in the North, there is a tendency of transport of the mercury to the mouth of the bay, eventually associated with hydrodynamics of the tidal currents. Another possible explanation for this behaviour is that the southern and the northern part of the Cove present very negative redox potentials that can be responsible for mercury trapping in sulphide complexes36,37. The higher values of A in the northern part, even though concentrations became lower, confirm the hypothesis of lower mobility in this area.
It has to be underlined that the model is not able to determine whether metals are immobilised in sulphides or other complexes. Actually the model functions as a black box, where the various chemical, physical and mineralogical processes responsible for me-tal mobility play their role. Nevertheless the model is not able to display details on these processes, it gives only the outcoming mobility of metal.
CONCLUSIONS
In this work we presented the first results of a model that would be able to estimate mobility of metals in sediments and that can help to design deeper studies on speciation and fractionation. Although we present here only data for mercury, the model can be applied for any contaminant or natural chemical present in the sediment.
The application of the attenuation of concentrations model to different environments would yield a better understanding of the geochemical meaning of the contours. Furthermore, comparisons between A values obtained in various environments would generate normal and average values that can be intercompared with abnormal situations. Comparisons between A values obtained from different metals may permit the determination of a scale of mobility and Table 3. Values of the attenuation of the concentrations of mercury
(A)
Angle, starting East A (dimensionless)
0° 0,1500
18° 0,0729
36° 0,0800
54° 0,4080
72° 0,6086
90° 0,6471
108° 0,6376
126° 0,6471
144° 0,5188
162° 0,3616
180° 0,2519
198° 0,1852
216° 0,2083
234° 0,3430
252° 0,5556
270° 0,7727
288° 0,4489
306° 0,5837
324° 0,2179
342° 0,1843
Figure 5. Distribution of the values of attenuation of concentrations in the Tainheiros Cove
harmfulness of these contaminants. Future researches that permit the comparison of the attenuation of concentrations with the results of speciation/fractionation studies would calibrate the model.
Finally, some limitations of the model can be listed at the present stage of the research. First, it seems that a more dense sampling of the study area would permit the generation of more reliable distribution maps and a more accurate result of the modelling. A lot of care has to be taken when using computational programs that interpolate and extrapolate data to design contour maps. Methods of interpolation must be very carefully selected and the final result depends to a great extent on the researcher personal capacity of evaluating the results. The procedures for designing the model as they were performed in this study are still tedious, since manual measurements of the distances between contours were made in printed graphs. The automatic calculation of the distances between contours is now being developed, that would yield more precise and rapid modelling.
AKNOWLEDGEMENTS
The authors are grateful to CAPES -MEC (Coordenação de Pes-soal de Nível Superior - Brazilian Ministry of Education and Culture) that provided a scholarship to E. L. Queiroz. Thanks are also due to Drs. L. D. Lacerda and J. J. Abrão for the support during the realisation of this work.
REFERENCES
1. Kraepiel, A. M. L.; Chiffoleau, J.-F.; Martin, J.-M.; Morel, F. M. M.;
Geochim. Cosmochim. Acta1997, 61, 1421.
2. Markert, B. In Ecotoxicology; Schüürmann, G.; Markert, B., eds.; John Wiley & Sons Inc. and Spektrum Akademischer Verlag, 1998, p. 166. 3. Duursma, E. K. In Environmental Geochemistry in the Tropics; Wasserman,
J. C.; Silva-Filho, E. V.; Villas-Boas, R., eds.; Springer-Verlag: Heidelberg, 1998, vol. 72, p. 273.
4. Tessier, A.; Campbell, P. G. C.; Bison, M.; Anal. Chem.1979, 51, 844. 5. Barrocas, P. R. G.; Wasserman, J. C. In ref. 3, vol. 72, p. 171.
6. Meguellati, N.; Robbe, D.; Marchandise, P.; Astruc, M.; III International
Conference on Heavy Metals in the Environment, Heidelberg, 1983.
7. Agemian, H.; Chau, A. S. Y.; Arch. Environ. Contam. Toxicol.1977, 6, 69. 8. Sheppard, M. I.; Stephenson, M. In Les Colloques; Prost, R., ed.; INRA
Editions: Paris, 1997, vol. 85, p. 69.
9. Biester, H.; Scholz, C.; Environ. Sci. Technol.1997, 31, 233.
10. Davidson, C. M.; Thomas, R. P.; McVey, S. E.; Perala, R.; D., L.; Ure, A.
M.; Anal. Chim. Acta1994, 291, 277.
11. Carlson, A. R.; Phipps, G. L.; Mattson, V. R.; Environ. Toxicol. Chem.1991,
10, 1309.
12. Förstner, U.; Contaminated Sediments, Springer-Verlag: Heidelberg, 1989. 13. Martin, J. M.; Meybeck, M.; Mar. Chem.1979, 7, 173.
14. Kemp, A. L. W.; J. Fish. Res. Board Can.1976, 33, 440.
15. Trefry, J. H.; Presley, B. J. In Marine Pollutant Transfer; Windon, H. L.; Duce, R.A., eds.; Lexington Books: Lexington, 1976, p. 39.
16. Wasserman, J. C.; Figueiredo, A. M. G.; Pellegatti, F.; Silva-Filho, E. V.;
J. Geochem. Explor.2001, 72, 129.
17. Förstner, U.; Wittmann, G. T. W.; Metal Pollution in the Aquatic
Environment, 2nd ed.; Springer-Verlag: Heidelberg, 1983.
18. Tavares, T. M.; Campos, V. P. In Baía de Todos os Santos - diagnóstico
sócio-ambiental e subsídios para a gestão; Germen/UFBA-NIMA:
Salvador, 1997, p. 79. 19. Tavares, T. M. In ref. 18, p. 43.
20. Souza, S. P.; Tavares, T. M.; Brandão, A. M.; Ciência e Cultura1978, 30, 406.
21. Tavares, T. M.; Carvalho, F. M.; Peso-Aguiar, M. C.; IIIInternational
Conference on Heavy Metals in the Environment, Heidelberg, 1983.
22. Petrobrás/PBA/SESEMA; Petrobras: Salvador, 1994.
23. EMBASA; Governo da Bahia, Secretaria de Recursos Hídricos, Saneamento e Habitação. Bahia: Salvador, 1997, p. 18.
24. Queiroz, A. F. S.; Doctorate Thesis, Université de Strasbourg, Strasbourg, 1992.
25. Herz, R.; Manguezais do Brasil, Instituto Oceanográfico - USP: São Paulo, 1991.
26. Tavares, T. M.; Peso, M. C.; Ciência e Cultura1980,31, 434. 27. Raymundo, C. C.; Tavares, T. M.; Ciência e Cultura1980, 32, 355. 28. Tavares, T. M.; Peso, M. C.; Souza, S. P.; Ciência e Cultura1977, 32, 544. 29. Malm, O.; Pfeiffer, W. C.; Bastos, W. R.; Souza, C. M. M.; Ciência e
Cultura1989, 41, 88.
30. Waters, R. D.; Brady, P. V.; Borns, D. J.; WM’98 - Mixed Wastes and
Environmental Restoration - Working Towards a Cleaner Environment,
Tucson, AR, 1998; WM Symposia Inc., p. 1. 31. Craig, P. J.; Moreton, P. A.; Water Res.1986, 20, 1111.
32. Lindberg, S. E.; Harriss, R. C.; Environ. Sci. Technol.1974, 8, 459. 33. Wasserman, J. C.; Freitas-Pinto, A. P.; Amouroux, D.; Environ. Technol.
2000, 21, 297.
34. Turekian, K. K.; Wedepohl, K. H.; Bull. Geol. Soc. Am.1961, 72, 175. 35. CEPED; CEPED - Bahia: Salvador, 1975.
36. Wallschläger, D.; Desai, M. V. M.; Spengler, M.; Wilken, R. D.;
International Conference on Heavy Metals in the Environment, Hamburg,
1995.