BRAZILIAN JOURNAL OF OCEANOGRAPHY, 62(3):167-177, 2014
TEMPORAL VARIATIONS OF SHALLOW SUBTIDAL MEIOFAUNA IN
LOS CRISTIANOS BAY (TENERIFE, CANARY ISLANDS, NE ATLANTIC OCEAN)
Rodrigo Riera1,*, Jorge Nunez2 and Maria del Carmen Brito2
1
Centro de Investigaciones Medioambientales del Atlántico (CIMA SL) (Arzobispo Elías Yanes, 44, 38206 La Laguna, Tenerife, Canary Islands, Spain)
2
University of La Laguna - Benthos Lab, Department of Animal Biology, Faculty of Biology (La Laguna, 38206Tenerife, Canary Islands, Spain)
*Corresponding author: [email protected]
http://dx.doi.org/10.1590/S1679-87592014027406203
A
B S T R A C TA subtidal meiofaunal assemblage in Los Cristianos Bay, Tenerife, Canary Islands was sampled from May 2000 to April 2001, at 3 m depth. Nematodes dominated overwhelmingly during the study period, ranging from 84.52% in May 2000 to 95.93% in October 2000. Copepods and polychaetes were the second and the third most abundant groups, respectively. Meiofaunal densities showed significant differences throughout the study period, with minimum abundances during the spring-summer months (May-July) and highest densities in winter (January and February). This seasonality is mainly due to the temporal variations of the most abundant species (nematodes Daptonema hirsutum and Pomponema sedecima), with differences in meiofauna species composition and abundance during May and June 2000 as compared to the remaining months of the study period. Environmental variables partly explained meiofaunal community structure, being the sedimentary type of very fine sands the most important, jointly with other variables, such as nitrogen and organic matter content.
R
E S U M OAs assembleias da meiofauna de Los Cristianos Bay, Tenerife, Ilhas Canárias, foi amostrada de maio de 2000 a abril de 2001 a 3 m de profundidade. Nematoda dominou durante todo o período de estudo, variando entre 84.52% em maio de 2000 a 95.93% em outubro do mesmo ano. Copepoda e Polychaeta foram o segundo e terceiro grupos mais abundantes, respectivamente. A densidade apresentou diferenças significativas ao longo do período, com valores mínimos na primavera-verão (maio-julho) e máximos no inverno (janeiro e fevereiro). Essa sazonalidade está sendo atribuída principalmente às variações temporais das espécies mais abundantes de nemátodes (Daptonema hirsutum e Pomponema sedecima). A meiofauna apresentou ainda diferenças na composição e abundância em maio e junho de 2000 quando comparado com os meses restantes do estudo. As variáveis ambientais explicaram parcialmente as variações na estrutura da comunidade e o tipo sedimentar areia muito fina destacou-se entre os mais importantes, juntamente com outras variáveis, tais como nitrogênio e conteúdo de matéria orgânica.
Descriptors: Subtidal, Meiofauna, Nematodes, Temporal distribution, Canary Islands, Atlantic Ocean.
Descritores: Sublitoral, Meiofauna, Nematodes, Distribuição temporal, Ilhas Canárias, Oceano Atlântico.
I
NTRODUCTIONShallow marine meiobenthos are known to vary seasonally with physico-chemical regimes and environmental trophic dynamics
(GUIDI-GUILVARD AND BUSCAIL, 1995;
DANOVARO, 1996; GRÉMARE ET AL, 1997; ÓLAFSSON AND ELMGREN, 1997). However,
one of the main drawbacks in the field is to know how to separate the effects of the different parameters, e.g. temperature and food availability (FLEEGER ET AL, 1989), temperature and salinity (Santos et al, 1996) or muds and organic matter content, because they are generally closely linked.
mesh sieve but are retained on a 0.063 or 0.042 mm mesh sieve) over a study period, normally of one year. However, most of these studies are limited to estuarine (e.g. NOZAIS ET AL, 2005) or intertidal environments (e.g. SCHIZAS AND SHIRLEY,
1996) or temperate (e.g. VINCX, 1989;
ÓLAFSSON AND ELMGREN, 1997) or polar regions (e.g. VANHOVE ET AL, 2000) but seasonal studies on marine subtropical or tropical regions are rather scarce and limited to intertidal habitats (e.g. SANTOS ET AL, 1996).
In temperate regions, meiofaunal
abundances reach maximum abundances during winter (COULL 1988, PALACÍN 1990), though some inconsistencies have also been reported (MAZZOLA ET AL. 2000, MIRTO ET AL. 2000). In subtropical regions, several studies have documented an increase in meiofaunal abundances during spring and summer (HICKS AND COULL 1983, COULL 1985, RUDNICK ET AL. 1985). In tropical latitudes, meiofauna has shown different temporal patterns, although the highest abundances are found during the wet season, when temperatures are usually higher (ALBUQUERQUE ET AL. 2007).
The Canary archipelago can be
characterized as a subtropical area of the Macaronesian (Azores, Madeira, Canary Islands and Cape Verde islands) biogeographic region. The Canary Islands are bathed by oligotrophic waters
(0.0-2.5 μ atom-g l-1 of phosphates, nitrates and
silicates) (BRAUN, 1981), implying the presence of low concentrations of particulated organic matter and thus of infaunal densities (macro- and meiofauna). The meiofauna assemblage structure is thus directly affected and low abundances are to be expected in this region. Moreover, the subtropical oceanic climate is almost constantly present throughout the year, with little variation in temperature (18-25ºC). Hence a lack of seasonality in marine assemblages is to be expected and this has, in fact, been observed in intertidal meiofauna communities (RIERA ET AL, 2011b).
In the present study, patterns in the assemblage structure and abundance of meiofauna assemblages inhabiting a shallow subtidal site (3 m deep) were investigated on the Canary Islands over a one-year cycle (May 2000-April 2001). It was sought: (i) to determine whether patterns in the assemblage structure, total meiofaunal abundance and the abundance of the most common species followed a seasonal trend during the study period, and (ii) to ascertain whether three sedimentary variables (grain size, organic content and total nitrogen) affected meiofaunal assemblage structure during this annual cycle.
M
ATERIAL ANDM
ETHODSStudy Area
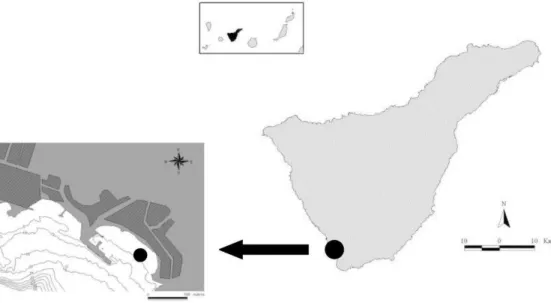
This study was conducted from May 2000 to April 2001 in Los Cristianos Bay, a locality on the south coast of Tenerife (Canary Islands, NE Atlantic Ocean; Lat. N. 28º02´59´´ Long. W. 16º42´54´´). The study site is located in a sheltered bay, with a recreational harbour inside it (Fig. 1).
Sediment samples were collected on a monthly basis manually by SCUBA divers at one shallow-subtidal station (3 m deep), with an average silt-clay fraction of 0.34%. Sediment corers (4.5 cm
inner diameter; 15.9 cm2) were pushed into the
sediment to a depth of 30 cm. Five replicates were collected for faunistic analysis and one for analysis of abiotic factors (organic matter, total nitrogen and granulometry).
Analysis of Meiofauna
Samples were preserved in a 10% seawater formaldehyde solution and decanted
through a 500 and a 63 μm mesh sieve. The fraction
remaining on the 63 μm mesh sieve was separated
into different taxonomical groups under a binocular microscope and preserved in 70% ethanol
(SOMERFIELD AND WARWICK, 1996).
Meiofaunal specimens were mounted in jelly glycerine and examined using a LEICA DMLB microscope equipped with Nomarski interference contrast and identified to species level, whenever possible. All meiofaunal specimens were identified and a subsample of 200 nematode individuals taken,
following SOMERFIELD AND WARWICK
(1996). Some taxonomic groups (i.e. harpacticoid copepods, turbellarians) required dissection, and/or careful inspection of taxonomic characters of their internal anatomy. The remaining taxonomic groups were determined to the lowest taxonomic level using current scientific literature.
Statistical Analysis
Biological descriptors of the assemblage (abundance, species richness, nº of taxonomical
groups) were estimated for each sample.
Fig. 1. Map of the study area, showing sampling station.
To visualize affinities in assemblage structure throughout the study period, a n-MDS (non-metric multidimensional scaling) was carried out on square rooted-transformed abundance data via the Bray-Curtis similarity index. ANOSIM analysis (CLARKE, 1993) was used to detect the significance of differences in meiofauna assemblage structure between months. A comparative test of
similarity matrices (RELATE routine) was
conducted to detect temporal differences in meiofauna assemblage structure between the months throughout the study period.
The relationship between the entire set of environmental variables and the meiofaunal assemblage structure was investigated using distance-based redundancy analysis (db-RDA, Legendre AND Anderson 1999). Multivariate multiple regression, using the DISTLM routine via 4999 permutations of the data (ANDERSON, 2001), tested the significance of these relationships by fitting a linear model based on Bray-Curtis
dissimilarities to squared-root transformed
abundance data.
R
ESULTSSedimentary Variables
The sampling site was dominated by fine sands (0.125-0.25 mm grain size diameter) throughout the study period (May 2000-April 2001),
ranging from a minimum of 55.79% (February 2001) to a maximum of 82.86% (October 2000). Medium sands were also a well-represented
sedimentary fraction, ranging from 7.67%
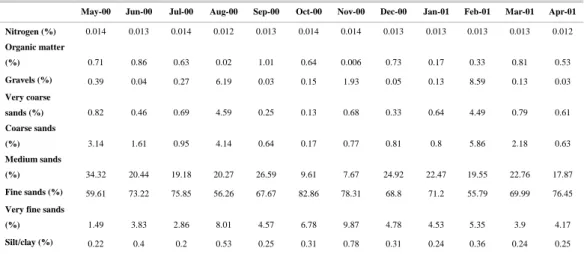
(November 2000) to 34.32% (May 2000). The remaining sediment types were scarce (average < 5%). The mean percentage of organic matter content was 0.54% throughout the study period, with a maximum content of 1.01% (September 2000) and a minimum content of 0.006% (November 2000). The mean percentage of nitrogen remained almost constant over the study period, with a mean of 0.013%, ranging from 0.012% to 0.014% (Table 1). For more details see RIERA ET AL. (2011).
Meiofauna
A total of 33,262 specimens were collected during the study period (May 2000-April 2001). Free-living nematodes were the most abundant group with 31,125 individuals (92.9% of the overall abundance), ranging from 84.52% in May 2000 to 95.93% in October 2000. Harpacticoid copepods and polychaetes were the second and third taxonomic groups in order of importance, representing 8.86% and 5.58% of the overall abundance, respectively. The remaining taxonomic
groups (Turbellarians, Amphipods, Tanaids,
Oligochaetes, Acari, Ostracods, Misids and
Nemerteans) were scarce during the study period.
Table 1. Values of sedimentary variables throughout the study period in Los Abrigos subtidal.
May-00 Jun-00 Jul-00 Aug-00 Sep-00 Oct-00 Nov-00 Dec-00 Jan-01 Feb-01 Mar-01 Apr-01 Nitrogen (%) 0.014 0.013 0.014 0.012 0.013 0.014 0.014 0.013 0.013 0.013 0.013 0.012
Organic matter
(%) 0.71 0.86 0.63 0.02 1.01 0.64 0.006 0.73 0.17 0.33 0.81 0.53
Gravels (%) 0.39 0.04 0.27 6.19 0.03 0.15 1.93 0.05 0.13 8.59 0.13 0.03
Very coarse
sands (%) 0.82 0.46 0.69 4.59 0.25 0.13 0.68 0.33 0.64 4.49 0.79 0.61
Coarse sands
(%) 3.14 1.61 0.95 4.14 0.64 0.17 0.77 0.81 0.8 5.86 2.18 0.63
Medium sands
(%) 34.32 20.44 19.18 20.27 26.59 9.61 7.67 24.92 22.47 19.55 22.76 17.87
Fine sands (%) 59.61 73.22 75.85 56.26 67.67 82.86 78.31 68.8 71.2 55.79 69.99 76.45
Very fine sands
(%) 1.49 3.83 2.86 8.01 4.57 6.78 9.87 4.78 4.53 5.35 3.9 4.17
Silt/clay (%) 0.22 0.4 0.2 0.53 0.25 0.31 0.78 0.31 0.24 0.36 0.24 0.25
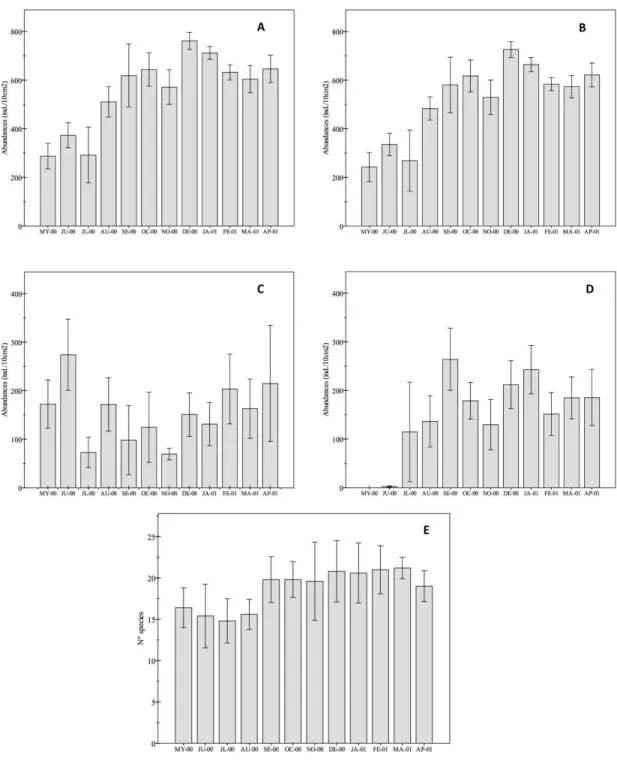
In terms of species richness, 90 taxa were identified at the sampling station during the study basis. Nematodes were the most diverse group with 48 species, followed by polychaetes (17 taxa) and turbellarians (7 taxa). Species richness varied throughout the study period, with maximum mean values in March 2001 (21.20 taxa) and minimum in July 2000 (14.80). Significant differences were found among the months studied (One-way ANOVA, F = 3.271, p = 0.002) (Fig. 2E).
Meiofaunal abundances ranged from 301
ind 10 cm-2 in May 2000 and July 2000 to 760 ind
10 cm-2 (December 2000) and 730 ind 10 cm-2
(January 2001). Meiofaunal densities varied over the study period, showing minimum abundances during the summer months (May, June and July 2000) and highest densities in winter (January and February 2001) (Fig. 2A). As expected, meiofaunal abundances showed significant differences during the study period (One-way ANOVA, F = 25.53, p << 0.0001) (Table 3).
Nematodes
Nematode densities varied from 242.4 ind.
10 cm-2 in May 2000 to 725.8 ind. 10 cm-2 in
December 2000 (Fig. 2B). As was expected, nematodes presented significant differences over the study period (May 2000-April 2001) (One-way ANOVA, F = 27.53; p <<0.0001) (Table 3).
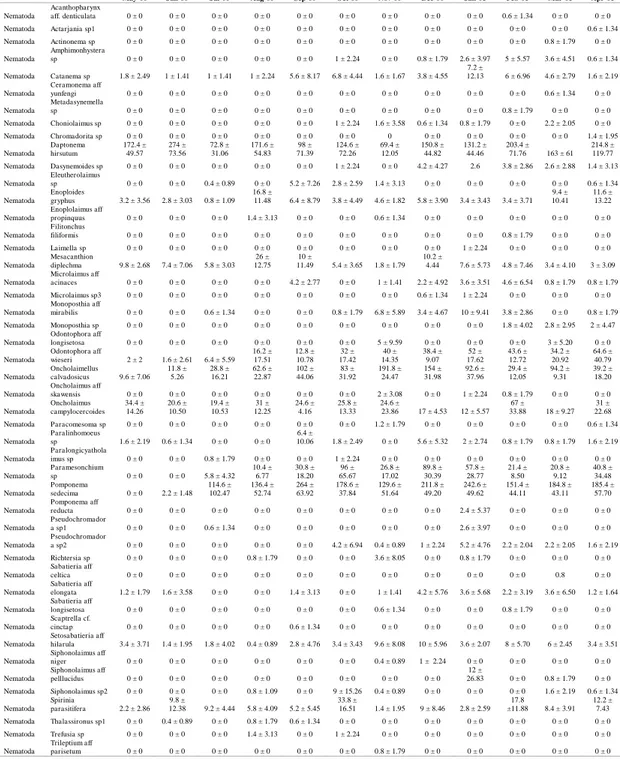
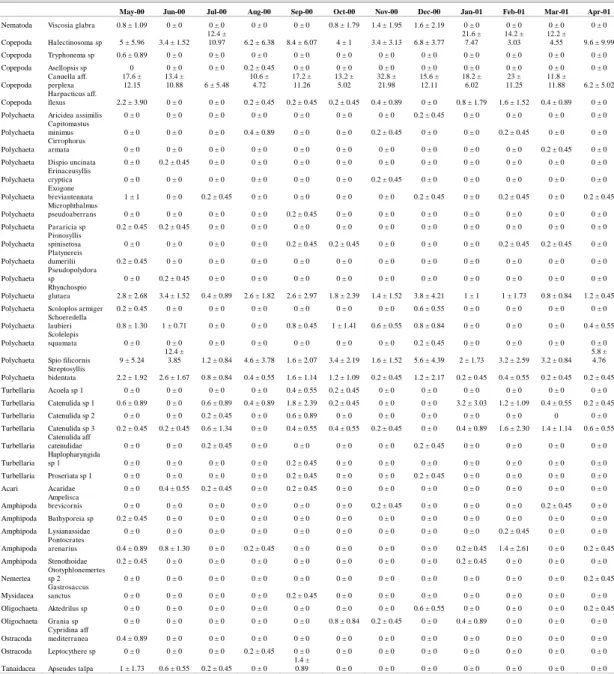
The most abundant nematodes were Daptonema hirsutum and Pomponema sedecima, with overall abundances of 9.230 ind. and 9.007 ind., respectively, throughout the study period. The remaining nematode species attained densities lower than 4,500 individuals. The species Acanthopharynx aff. denticulata, Actarjania sp.1, Ceramonema
yunfengi and Scaptrella cf. cincta were rather scarce (3 ind.) during the study period (Table 2).
Copepods
Harpacticoid copepods reached their maximum abundances in January and February
2001, with 41 and 39 ind. 10 cm-2, respectively. The
lowest densities were encountered in April 2001 (14
ind. 10 cm-2) and June 2000 (15 ind. 10 cm-2).
A total of five species of copepods were identified at the sampling station, Canuella aff,
perplexa and Halectinosoma sp1 being the most
abundant with 901 and 565 individuals,
respectively. The remaining copepod species attained densities lower than 30 specimens, the species Asellopsis sp being represented by one single individual (Table 2).
Polychaetes
Polychaetes attained their highest
abundances in June 2000 (20 ind. 10 cm-2) and May
2000 (16 ind. 10 cm-2), and the lowest densities in
July 2000 (3 ind. 10 cm-2) and November 2000 (4
ind. 10 cm-2).
A total of 16 polychaete species were identified at the sampling station during the study period, the spionids Spio filicornis (269 ind.) and Rhynchospio glutaea (144 ind.) being the most abundant ones. The remaining polychaete taxa were scarce, with densities lower than 60 specimens. The
polychaetes Aricidea assimilis, Cirrophorus
armatus, Dispio uncinata, Microphthalmus
pseudoaberrans, Platynereis dumerilii, Scolelepis
squamata and Erinaceusyllis criptica were
Fig. 2. Mean abundances (± SE) throughout the study period (May 2000-April 2001). A. Overall meiofauna. B. Nematodes. C. Daptonema hirsutum. D. Pomponema sedecima. E. Species richness.
Table 2. Abundances of meiofaunal species (mean ± SD) throughout the study period (May 2000-April 2001).
May-00 Jun-00 Jul-00 Aug-00 Sep-00 Oct-00 Nov-00 Dec-00 Jan-01 Feb-01 Mar-01 Apr-01
Nematoda
Acanthopharynx
aff. denticulata 0 ± 0 0 ± 0 0 ± 0 0 ± 0 0 ± 0 0 ± 0 0 ± 0 0 ± 0 0 ± 0 0.6 ± 1.34 0 ± 0 0 ± 0 Nematoda Actarjania sp1 0 ± 0 0 ± 0 0 ± 0 0 ± 0 0 ± 0 0 ± 0 0 ± 0 0 ± 0 0 ± 0 0 ± 0 0 ± 0 0.6 ± 1.34 Nematoda Actinonema sp 0 ± 0 0 ± 0 0 ± 0 0 ± 0 0 ± 0 0 ± 0 0 ± 0 0 ± 0 0 ± 0 0 ± 0 0.8 ± 1.79 0 ± 0
Nematoda
Amphimonhystera
sp 0 ± 0 0 ± 0 0 ± 0 0 ± 0 0 ± 0 1 ± 2.24 0 ± 0 0.8 ± 1.79 2.6 ± 3.97 5 ± 5.57 3.6 ± 4.51 0.6 ± 1.34
Nematoda Catanema sp 1.8 ± 2.49 1 ± 1.41 1 ± 1.41 1 ± 2.24 5.6 ± 8.17 6.8 ± 4.44 1.6 ± 1.67 3.8 ± 4.55 7.2 ±
12.13 6 ± 6.96 4.6 ± 2.79 1.6 ± 2.19
Nematoda
Ceramonema aff
yunfengi 0 ± 0 0 ± 0 0 ± 0 0 ± 0 0 ± 0 0 ± 0 0 ± 0 0 ± 0 0 ± 0 0 ± 0 0.6 ± 1.34 0 ± 0
Nematoda
Metadasynemella
sp 0 ± 0 0 ± 0 0 ± 0 0 ± 0 0 ± 0 0 ± 0 0 ± 0 0 ± 0 0 ± 0 0.8 ± 1.79 0 ± 0 0 ± 0 Nematoda Choniolaimus sp 0 ± 0 0 ± 0 0 ± 0 0 ± 0 0 ± 0 1 ± 2.24 1.6 ± 3.58 0.6 ± 1.34 0.8 ± 1.79 0 ± 0 2.2 ± 2.05 0 ± 0 Nematoda Chromadorita sp 0 ± 0 0 ± 0 0 ± 0 0 ± 0 0 ± 0 0 ± 0 0 0 ± 0 0 ± 0 0 ± 0 0 ± 0 1.4 ± 1.95
Nematoda Daptonema hirsutum 172.4 ± 49.57 274 ± 73.56 72.8 ± 31.06 171.6 ± 54.83 98 ± 71.39 124.6 ± 72.26 69.4 ± 12.05 150.8 ± 44.82 131.2 ± 44.46 203.4 ± 71.76 163 ± 61
214.8 ± 119.77 Nematoda Dasynemoides sp 0 ± 0 0 ± 0 0 ± 0 0 ± 0 0 ± 0 1 ± 2.24 0 ± 0 4.2 ± 4.27 2.6 3.8 ± 2.86 2.6 ± 2.88 1.4 ± 3.13
Nematoda
Eleutherolaimus
sp 0 ± 0 0 ± 0 0.4 ± 0.89 0 ± 0 5.2 ± 7.26 2.8 ± 2.59 1.4 ± 3.13 0 ± 0 0 ± 0 0 ± 0 0 ± 0 0.6 ± 1.34
Nematoda Enoploides
gryphus 3.2 ± 3.56 2.8 ± 3.03 0.8 ± 1.09 16.8 ±
11.48 6.4 ± 8.79 3.8 ± 4.49 4.6 ± 1.82 5.8 ± 3.90 3.4 ± 3.43 3.4 ± 3.71 9.4 ± 10.41 11.6 ± 13.22 Nematoda Enoplolaimus aff
propinquus 0 ± 0 0 ± 0 0 ± 0 1.4 ± 3.13 0 ± 0 0 ± 0 0.6 ± 1.34 0 ± 0 0 ± 0 0 ± 0 0 ± 0 0 ± 0
Nematoda
Filitonchus
filiformis 0 ± 0 0 ± 0 0 ± 0 0 ± 0 0 ± 0 0 ± 0 0 ± 0 0 ± 0 0 ± 0 0.8 ± 1.79 0 ± 0 0 ± 0 Nematoda Laimella sp 0 ± 0 0 ± 0 0 ± 0 0 ± 0 0 ± 0 0 ± 0 0 ± 0 0 ± 0 1 ± 2.24 0 ± 0 0 ± 0 0 ± 0
Nematoda
Mesacanthion
diplechma 9.8 ± 2.68 7.4 ± 7.06 5.8 ± 3.03 26 ± 12.75
10 ±
11.49 5.4 ± 3.65 1.8 ± 1.79 10.2 ±
4.44 7.6 ± 5.73 4.8 ± 7.46 3.4 ± 4.10 3 ± 3.09
Nematoda
Microlaimus aff
acinaces 0 ± 0 0 ± 0 0 ± 0 0 ± 0 4.2 ± 2.77 0 ± 0 1 ± 1.41 2.2 ± 4.92 3.6 ± 3.51 4.6 ± 6.54 0.8 ± 1.79 0.8 ± 1.79 Nematoda Microlaimus sp3 0 ± 0 0 ± 0 0 ± 0 0 ± 0 0 ± 0 0 ± 0 0 ± 0 0.6 ± 1.34 1 ± 2.24 0 ± 0 0 ± 0 0 ± 0
Nematoda
Monoposthia aff
mirabilis 0 ± 0 0 ± 0 0.6 ± 1.34 0 ± 0 0 ± 0 0.8 ± 1.79 6.8 ± 5.89 3.4 ± 4.67 10 ± 9.41 3.8 ± 2.86 0 ± 0 0.8 ± 1.79 Nematoda Monoposthia sp 0 ± 0 0 ± 0 0 ± 0 0 ± 0 0 ± 0 0 ± 0 0 ± 0 0 ± 0 0 ± 0 1.8 ± 4.02 2.8 ± 2.95 2 ± 4.47
Nematoda
Odontophora aff
longisetosa 0 ± 0 0 ± 0 0 ± 0 0 ± 0 0 ± 0 0 ± 0 5 ± 9.59 0 ± 0 0 ± 0 0 ± 0 3 ± 5.20 0 ± 0
Nematoda
Odontophora aff
wieseri 2 ± 2 1.6 ± 2.61 6.4 ± 5.59 16.2 ± 17.51 12.8 ± 10.78 32 ± 17.42 40 ± 14.35 38.4 ± 9.07 52 ± 17.62 43.6 ± 12.72 34.2 ± 20.92 64.6 ± 40.79 Nematoda Oncholaimellus
calvadosicus 9.6 ± 7.06 11.8 ± 5.26 28.8 ± 16.21 62.6 ± 22.87 102 ± 44.06 83 ± 31.92 191.8 ± 24.47 154 ± 31.98 92.6 ± 37.96 29.4 ± 12.05 94.2 ± 9.31 39.2 ± 18.20 Nematoda Oncholaimus aff
skawensis 0 ± 0 0 ± 0 0 ± 0 0 ± 0 0 ± 0 0 ± 0 2 ± 3.08 0 ± 0 1 ± 2.24 0.8 ± 1.79 0 ± 0 0 ± 0
Nematoda Oncholaimus campylocercoides 34.4 ± 14.26 20.6 ± 10.50 19.4 ± 10.53 31 ± 12.25 24.6 ± 4.16 25.8 ± 13.33 24.6 ±
23.86 17 ± 4.53 12 ± 5.57 67 ± 33.88 18 ± 9.27
31 ± 22.68 Nematoda Paracomesoma sp 0 ± 0 0 ± 0 0 ± 0 0 ± 0 0 ± 0 0 ± 0 1.2 ± 1.79 0 ± 0 0 ± 0 0 ± 0 0 ± 0 0.6 ± 1.34
Nematoda
Paralinhomoeus
sp 1.6 ± 2.19 0.6 ± 1.34 0 ± 0 0 ± 0 6.4 ±
10.06 1.8 ± 2.49 0 ± 0 5.6 ± 5.32 2 ± 2.74 0.8 ± 1.79 0.8 ± 1.79 1.6 ± 2.19
Nematoda
Paralongicyathola
imus sp 0 ± 0 0 ± 0 0.8 ± 1.79 0 ± 0 0 ± 0 1 ± 2.24 0 ± 0 0 ± 0 0 ± 0 0 ± 0 0 ± 0 0 ± 0
Nematoda
Paramesonchium
sp 0 ± 0 0 ± 0 5.8 ± 4.32 10.4 ± 6.77 30.8 ± 18.20 96 ± 65.67 26.8 ± 17.02 89.8 ± 30.39 57.8 ± 28.77 21.4 ± 8.50 20.8 ± 9.12 40.8 ± 34.48 Nematoda Pomponema
sedecima 0 ± 0 2.2 ± 1.48 114.6 ± 102.47 136.4 ± 52.74 264 ± 63.92 178.6 ± 37.84 129.6 ± 51.64 211.8 ± 49.20 242.6 ± 49.62 151.4 ± 44.11 184.8 ± 43.11 185.4 ± 57.70 Nematoda Pomponema aff
reducta 0 ± 0 0 ± 0 0 ± 0 0 ± 0 0 ± 0 0 ± 0 0 ± 0 0 ± 0 2.4 ± 5.37 0 ± 0 0 ± 0 0 ± 0
Nematoda
Pseudochromador
a sp1 0 ± 0 0 ± 0 0.6 ± 1.34 0 ± 0 0 ± 0 0 ± 0 0 ± 0 0 ± 0 2.6 ± 3.97 0 ± 0 0 ± 0 0 ± 0
Nematoda
Pseudochromador
a sp2 0 ± 0 0 ± 0 0 ± 0 0 ± 0 0 ± 0 4.2 ± 6.94 0.4 ± 0.89 1 ± 2.24 5.2 ± 4.76 2.2 ± 2.04 2.2 ± 2.05 1.6 ± 2.19 Nematoda Richtersia sp 0 ± 0 0 ± 0 0 ± 0 0.8 ± 1.79 0 ± 0 0 ± 0 3.6 ± 8.05 0 ± 0 0.8 ± 1.79 0 ± 0 0 ± 0 0 ± 0
Nematoda
Sabatieria aff
celtica 0 ± 0 0 ± 0 0 ± 0 0 ± 0 0 ± 0 0 ± 0 0 ± 0 0 ± 0 0 ± 0 0 ± 0 0.8 0 ± 0
Nematoda
Sabatieria aff
elongata 1.2 ± 1.79 1.6 ± 3.58 0 ± 0 0 ± 0 1.4 ± 3.13 0 ± 0 1 ± 1.41 4.2 ± 5.76 3.6 ± 5.68 2.2 ± 3.19 3.6 ± 6.50 1.2 ± 1.64
Nematoda
Sabatieria aff
longisetosa 0 ± 0 0 ± 0 0 ± 0 0 ± 0 0 ± 0 0 ± 0 0.6 ± 1.34 0 ± 0 0 ± 0 0.8 ± 1.79 0 ± 0 0 ± 0
Nematoda
Scaptrella cf.
cinctap 0 ± 0 0 ± 0 0 ± 0 0 ± 0 0.6 ± 1.34 0 ± 0 0 ± 0 0 ± 0 0 ± 0 0 ± 0 0 ± 0 0 ± 0
Nematoda
Setosabatieria aff
hilarula 3.4 ± 3.71 1.4 ± 1.95 1.8 ± 4.02 0.4 ± 0.89 2.8 ± 4.76 3.4 ± 3.43 9.6 ± 8.08 10 ± 5.96 3.6 ± 2.07 8 ± 5.70 6 ± 2.45 3.4 ± 3.51
Nematoda
Siphonolaimus aff
niger 0 ± 0 0 ± 0 0 ± 0 0 ± 0 0 ± 0 0 ± 0 0.4 ± 0.89 1 ± 2.24 0 ± 0 0 ± 0 0 ± 0 0 ± 0
Nematoda
Siphonolaimus aff
pelllucidus 0 ± 0 0 ± 0 0 ± 0 0 ± 0 0 ± 0 0 ± 0 0 ± 0 0 ± 0 12 ±
26.83 0 ± 0 0.8 ± 1.79 0 ± 0 Nematoda Siphonolaimus sp2 0 ± 0 0 ± 0 0 ± 0 0.8 ± 1.09 0 ± 0 9 ± 15.26 0.4 ± 0.89 0 ± 0 0 ± 0 0 ± 0 1.6 ± 2.19 0.6 ± 1.34
Nematoda Spirinia
parasitifera 2.2 ± 2.86 9.8 ±
12.38 9.2 ± 4.44 5.8 ± 4.09 5.2 ± 5.45 33.8 ±
16.51 1.4 ± 1.95 9 ± 8.46 2.8 ± 2.59 17.8
±11.88 8.4 ± 3.91 12.2 ±
7.43 Nematoda Thalassironus sp1 0 ± 0 0.4 ± 0.89 0 ± 0 0.8 ± 1.79 0.6 ± 1.34 0 ± 0 0 ± 0 0 ± 0 0 ± 0 0 ± 0 0 ± 0 0 ± 0 Nematoda Trefusia sp 0 ± 0 0 ± 0 0 ± 0 1.4 ± 3.13 0 ± 0 1 ± 2.24 0 ± 0 0 ± 0 0 ± 0 0 ± 0 0 ± 0 0 ± 0
Nematoda
Trileptium aff
Table 2. Continuation.
May-00 Jun-00 Jul-00 Aug-00 Sep-00 Oct-00 Nov-00 Dec-00 Jan-01 Feb-01 Mar-01 Apr-01
Nematoda Viscosia glabra 0.8 ± 1.09 0 ± 0 0 ± 0 0 ± 0 0 ± 0 0.8 ± 1.79 1.4 ± 1.95 1.6 ± 2.19 0 ± 0 0 ± 0 0 ± 0 0 ± 0
Copepoda Halectinosoma sp 5 ± 5.96 3.4 ± 1.52 12.4 ±
10.97 6.2 ± 6.38 8.4 ± 6.07 4 ± 1 3.4 ± 3.13 6.8 ± 3.77 21.6 ±
7.47 14.2 ±
3.03 12.2 ±
4.55 9.6 ± 9.99 Copepoda Tryphonema sp 0.6 ± 0.89 0 ± 0 0 ± 0 0 ± 0 0 ± 0 0 ± 0 0 ± 0 0 ± 0 0 ± 0 0 ± 0 0 ± 0 0 ± 0 Copepoda Asellopsis sp 0 0 ± 0 0 ± 0 0.2 ± 0.45 0 ± 0 0 ± 0 0 ± 0 0 ± 0 0 ± 0 0 ± 0 0 ± 0 0 ± 0
Copepoda
Canuella aff. perplexa
17.6 ± 12.15
13.4 ± 10.88 6 ± 5.48
10.6 ± 4.72
17.2 ± 11.26
13.2 ± 5.02
32.8 ± 21.98
15.6 ± 12.11
18.2 ± 6.02
23 ± 11.25
11.8 ± 11.88 6.2 ± 5.02
Copepoda
Harpacticus aff.
flexus 2.2 ± 3.90 0 ± 0 0 ± 0 0.2 ± 0.45 0.2 ± 0.45 0.2 ± 0.45 0.4 ± 0.89 0 ± 0 0.8 ± 1.79 1.6 ± 1.52 0.4 ± 0.89 0 ± 0 Polychaeta Aricidea assimilis 0 ± 0 0 ± 0 0 ± 0 0 ± 0 0 ± 0 0 ± 0 0 ± 0 0.2 ± 0.45 0 ± 0 0 ± 0 0 ± 0 0 ± 0
Polychaeta
Capitomastus
minimus 0 ± 0 0 ± 0 0 ± 0 0.4 ± 0.89 0 ± 0 0 ± 0 0.2 ± 0.45 0 ± 0 0 ± 0 0.2 ± 0.45 0 ± 0 0 ± 0
Polychaeta
Cirrophorus
armata 0 ± 0 0 ± 0 0 ± 0 0 ± 0 0 ± 0 0 ± 0 0 ± 0 0 ± 0 0 ± 0 0 ± 0 0.2 ± 0.45 0 ± 0 Polychaeta Dispio uncinata 0 ± 0 0.2 ± 0.45 0 ± 0 0 ± 0 0 ± 0 0 ± 0 0 ± 0 0 ± 0 0 ± 0 0 ± 0 0 ± 0 0 ± 0
Polychaeta
Erinaceusyllis
cryptica 0 ± 0 0 ± 0 0 ± 0 0 ± 0 0 ± 0 0 ± 0 0.2 ± 0.45 0 ± 0 0 ± 0 0 ± 0 0 ± 0 0 ± 0
Polychaeta Exogone
breviantennata 1 ± 1 0 ± 0 0.2 ± 0.45 0 ± 0 0 ± 0 0 ± 0 0 ± 0 0.2 ± 0.45 0 ± 0 0.2 ± 0.45 0 ± 0 0.2 ± 0.45
Polychaeta
Microphthalmus
pseudoaberrans 0 ± 0 0 ± 0 0 ± 0 0 ± 0 0.2 ± 0.45 0 ± 0 0 ± 0 0 ± 0 0 ± 0 0 ± 0 0 ± 0 0 ± 0 Polychaeta Pararicia sp 0.2 ± 0.45 0.2 ± 0.45 0 ± 0 0 ± 0 0 ± 0 0 ± 0 0 ± 0 0 ± 0 0 ± 0 0 ± 0 0 ± 0 0 ± 0
Polychaeta Pionosyllis
spinisetosa 0 ± 0 0 ± 0 0 ± 0 0 ± 0 0.2 ± 0.45 0.2 ± 0.45 0 ± 0 0 ± 0 0 ± 0 0.2 ± 0.45 0.2 ± 0.45 0 ± 0
Polychaeta Platynereis
dumerilii 0.2 ± 0.45 0 ± 0 0 ± 0 0 ± 0 0 ± 0 0 ± 0 0 ± 0 0 ± 0 0 ± 0 0 ± 0 0 ± 0 0 ± 0
Polychaeta
Pseudopolydora
sp 0 ± 0 0.2 ± 0.45 0 ± 0 0 ± 0 0 ± 0 0 ± 0 0 ± 0 0 ± 0 0 ± 0 0 ± 0 0 ± 0 0 ± 0
Polychaeta
Rhynchospio
glutaea 2.8 ± 2.68 3.4 ± 1.52 0.4 ± 0.89 2.6 ± 1.82 2.6 ± 2.97 1.8 ± 2.39 1.4 ± 1.52 3.8 ± 4.21 1 ± 1 1 ± 1.73 0.8 ± 0.84 1.2 ± 0.45 Polychaeta Scoloplos armiger 0.2 ± 0.45 0 ± 0 0 ± 0 0 ± 0 0 ± 0 0 ± 0 0 ± 0 0.6 ± 0.55 0 ± 0 0 ± 0 0 ± 0 0 ± 0
Polychaeta
Schoeredella
laubieri 0.8 ± 1.30 1 ± 0.71 0 ± 0 0 ± 0 0.8 ± 0.45 1 ± 1.41 0.6 ± 0.55 0.8 ± 0.84 0 ± 0 0 ± 0 0 ± 0 0.4 ± 0.55
Polychaeta Scolelepis
squamata 0 ± 0 0 ± 0 0 ± 0 0 ± 0 0 ± 0 0 ± 0 0 ± 0 0.2 ± 0.45 0 ± 0 0 ± 0 0 ± 0 0 ± 0
Polychaeta Spio filicornis 9 ± 5.24 12.4 ±
3.85 1.2 ± 0.84 4.6 ± 3.78 1.6 ± 2.07 3.4 ± 2.19 1.6 ± 1.52 5.6 ± 4.39 2 ± 1.73 3.2 ± 2.59 3.2 ± 0.84 5.8 ± 4.76
Polychaeta
Streptosyllis
bidentata 2.2 ± 1.92 2.6 ± 1.67 0.8 ± 0.84 0.4 ± 0.55 1.6 ± 1.14 1.2 ± 1.09 0.2 ± 0.45 1.2 ± 2.17 0.2 ± 0.45 0.4 ± 0.55 0.2 ± 0.45 0.2 ± 0.45 Turbellaria Acoela sp 1 0 ± 0 0 ± 0 0 ± 0 0 ± 0 0.4 ± 0.55 0.2 ± 0.45 0 ± 0 0 ± 0 0 ± 0 0 ± 0 0 ± 0 0 ± 0 Turbellaria Catenulida sp 1 0.6 ± 0.89 0 ± 0 0.6 ± 0.89 0.4 ± 0.89 1.8 ± 2.39 0.2 ± 0.45 0 ± 0 0 ± 0 3.2 ± 3.03 1.2 ± 1.09 0.4 ± 0.55 0.2 ± 0.45 Turbellaria Catenulida sp 2 0 ± 0 0 ± 0 0.2 ± 0.45 0 ± 0 0.6 ± 0.89 0 ± 0 0 ± 0 0 ± 0 0 ± 0 0 ± 0 0 0 ± 0 Turbellaria Catenulida sp 3 0.2 ± 0.45 0.2 ± 0.45 0.6 ± 1.34 0 ± 0 0.4 ± 0.55 0.4 ± 0.55 0.2 ± 0.45 0 ± 0 0.4 ± 0.89 1.6 ± 2.30 1.4 ± 1.14 0.6 ± 0.55
Turbellaria
Catenulida aff
catenulidae 0 ± 0 0 ± 0 0.2 ± 0.45 0 ± 0 0 ± 0 0 ± 0 0 ± 0 0.2 ± 0.45 0 ± 0 0 ± 0 0 ± 0 0 ± 0
Turbellaria
Haplopharyngida
sp 1 0 ± 0 0 ± 0 0 ± 0 0 ± 0 0.2 ± 0.45 0 ± 0 0 ± 0 0 ± 0 0 ± 0 0 ± 0 0 ± 0 0 ± 0 Turbellaria Proseriata sp 1 0 ± 0 0 ± 0 0 ± 0 0 ± 0 0.2 ± 0.45 0 ± 0 0 ± 0 0.2 ± 0.45 0 ± 0 0 ± 0 0 ± 0 0 ± 0 Acari Acaridae 0 ± 0 0.4 ± 0.55 0.2 ± 0.45 0 ± 0 0.2 ± 0.45 0 ± 0 0 ± 0 0 ± 0 0 ± 0 0 ± 0 0 ± 0 0 ± 0
Amphipoda Ampelisca
brevicornis 0 ± 0 0 ± 0 0 ± 0 0 ± 0 0 ± 0 0 ± 0 0.2 ± 0.45 0 ± 0 0 ± 0 0 ± 0 0.2 ± 0.45 0 ± 0 Amphipoda Bathyporeia sp 0.2 ± 0.45 0 ± 0 0 ± 0 0 ± 0 0 ± 0 0 ± 0 0 ± 0 0 ± 0 0 ± 0 0 ± 0 0 ± 0 0 ± 0 Amphipoda Lysianassidae 0 ± 0 0 ± 0 0 ± 0 0 ± 0 0 ± 0 0 ± 0 0 ± 0 0 ± 0 0 ± 0 0.2 ± 0.45 0 ± 0 0 ± 0
Amphipoda Pontocrates
arenarius 0.4 ± 0.89 0.8 ± 1.30 0 ± 0 0.2 ± 0.45 0 ± 0 0 ± 0 0 ± 0 0 ± 0 0.2 ± 0.45 1.4 ± 2.61 0 ± 0 0.2 ± 0.45 Amphipoda Stenothoidae 0.2 ± 0.45 0 ± 0 0 ± 0 0 ± 0 0 ± 0 0 ± 0 0 ± 0 0 ± 0 0.2 ± 0.45 0 ± 0 0 ± 0 0 ± 0
Nemertea
Ototyphlonemertes
sp 2 0 ± 0 0 ± 0 0 ± 0 0 ± 0 0 ± 0 0 ± 0 0 ± 0 0 ± 0 0 ± 0 0 ± 0 0 ± 0 0.2 ± 0.45
Mysidacea
Gastrosaccus
sanctus 0 ± 0 0 ± 0 0 ± 0 0 ± 0 0.2 ± 0.45 0 ± 0 0 ± 0 0 ± 0 0 ± 0 0 ± 0 0 ± 0 0 ± 0 Oligochaeta Aktedrilus sp 0 ± 0 0 ± 0 0 ± 0 0 ± 0 0 ± 0 0 ± 0 0 ± 0 0.6 ± 0.55 0 ± 0 0 ± 0 0 ± 0 0.2 ± 0.45 Oligochaeta Grania sp 0 ± 0 0 ± 0 0 ± 0 0 ± 0 0 ± 0 0.8 ± 0.84 0.2 ± 0.45 0 ± 0 0.4 ± 0.89 0 ± 0 0 ± 0 0 ± 0
Ostracoda
Cypridina aff
mediterranea 0.4 ± 0.89 0 ± 0 0 ± 0 0 ± 0 0 ± 0 0 ± 0 0 ± 0 0 ± 0 0 ± 0 0 ± 0 0 ± 0 0 ± 0 Ostracoda Leptocythere sp 0 ± 0 0 ± 0 0 ± 0 0.2 ± 0.45 0 ± 0 0 ± 0 0 ± 0 0 ± 0 0 ± 0 0 ± 0 0 ± 0 0 ± 0
Tanaidacea Apseudes talpa 1 ± 1.73 0.6 ± 0.55 0.2 ± 0.45 0 ± 0 1.4 ±
0.89 0 ± 0 0 ± 0 0 ± 0 0 ± 0 0 ± 0 0 ± 0 0 ± 0
Minor Taxa
Minor taxonomic groups comprised
turbellarians, tanaids, amphipods, oligochaetes, acari, ostracods, misids and nemerteans. A total of 20 species were identified during the study period (7 turbellarians, 5 amphipods, 2 oligochaetes, 2 ostracods, 1 tanaid, 1 acari, 1 misid and 1 nemertean). The most abundant species were the
turbellarians Catenulida sp.1 (43 ind.) and Catenulida sp.3 (30 ind.), the remaining minor taxa being scarce (< 20 ind.). The least abundant species were the amphipod Bathyporeia sp., the misid
Gastrosaccus sanctus, the turbellarian
Haplopharyngida sp.1, the ostracod Leptocythere sp.1, the amphipod Lysianassidae and the nemertean Ototyphlonemertes sp.2, with one single specimen (Table 2).
Table 3. Results of univariate ANOVA testing for differences in overall meiofauna, nematode, Daptonema hirsutum and Pomponema sedecima abundance throughout the study period (May 2000-April 2001). Significant differences are highlighted in bold.
Overall meiofaunal abundance
Nematode abundances
Daptonema hirsutum
abundances
Pomponema sedecima
abundances
Source of
variation df MS F p MS F p MS F p MS F p
Time 11 123,606.28 25.53 <<0.0001 122,373.20 27.53 <<0.0001 34033.22 12.20 <<0.0001 17,975.92 4.357 0.00016
Species Assemblage
The most abundant species were the nematodes Daptonema hirsutum and Pomponema sedecima, that made up 54.82% of the overall meiofaunal abundance. Daptonema hirsutum was
more abundant in June 2000 (274 ind 10cm-2) and
April 2001 (214.8 ind 10cm-2), decreasing to 69.4
and 72.8 ind 10 cm-2 in July and November 2000,
respectively (Fig. 2C). Daptonema hirsutum densities varied significantly over the study period (One-way ANOVA; F = 4.357, p = 0.00016) (Table 3).
The nematode Pomponema sedecima reached its maximum densities in September 2000
(264 ind 10cm-2) and January 2001 (242.6 ind
10cm-2). Its minimum abundances were registered
in May 2000 (absent), June 2000 (2.2 ind 10 cm-2)
and July 2000 (114.6 ind 10 cm-2) (Fig. 2D).
Pomponema sedecima densities showed highly
significant differences during the study period (One-way ANOVA; F = 12.196, p << 0.0001) (Table 3).
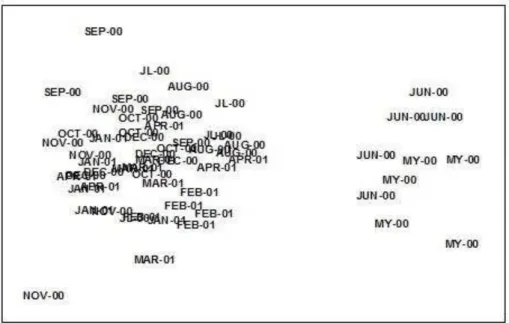
Multivariate Analysis
Differences in the meiofauna assemblage structure during the months studied were observed in the MDS (Fig. 3), with a clear distinction between May and June 2000 and the remaining months of the study year. The former months were characterized by characterized by low abundances of nematodes and high densities of polychaetes. In terms of species, that group (May and June 2000) was dominated by the nematode Daptonema hirsutum and, to a lesser extent, by the nematodes
Oncholaimus campylocercoides and
Oncholaimellus calvadosicus, as well as, the harpacticoid copepod Canuella aff. perplexa.
The analysis of matrices similarity
(RELATE) showed significant differences
throughout the sampling year (number of
permutations used = 20.000, Rho = 0.234; significance level = 0.1%). There is thus a seasonality in the meiofaunal community structure of Los Cristianos subtidal station during the sampling period (May 2000-April 2001). These results were mainly due to the seasonal variability of the two most abundant nematode species (Daptonema hirsutum and Pomponema sedecima) and, to a lesser extent, of the meiofaunal species composition of May and June 2000.
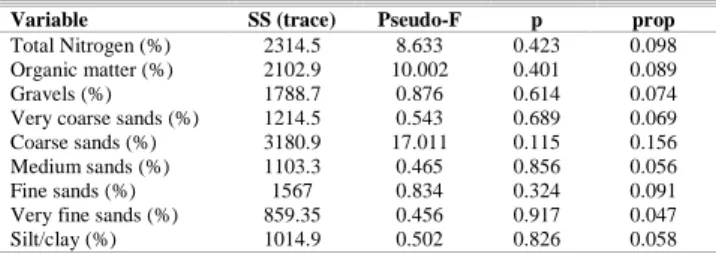
The multivariate multiple regression showed that none of the environmental variables measured contributed significantly to explain the patterns of the meiofaunal assemblage structure (all p-values > 0.05, Table 4). This is mainly due to the environmental stability at the sampling station throughout the study period (May 2000-April 2001).
D
ISCUSSIONMeiofauna densities showed intermediate
values, with an overall mean of 554.4 ind 10 cm-2
throughout the sampling period (May 2000-April 2001). These abundances are not consistent with previous data concerning shallow subtidal densities (SANDULLI ET AL, 2002; VEZZULLI AND FABIANO, 2006; LEONARDIS ET AL, 2008), because of the lower meiofaunal ones (ca. 200-400
ind 10 cm-2) observed in the western Mediterranean.
In this area, low primary production rates which are related to the depletion of nutrients in the euphotic zone, which provides a very low organic matter supply to the benthos due to a restriction of the vertical transport of particles to the seabed (SACHS AND REPETA, 1999). In terms of meiofauna composition, the high dominance of nematodes in fine-sandy subtidal seabeds has already been observed (e.g. SEMPRUCCI ET AL, 2010). In short, meiofaunal and nematode abundances were
higher during winter months (December 2000-March 2001), with a sharp decrease in the spring-summer months, especially accentuated in May 2000.
Apparently, the meiofaunal assemblages from Los Cristianos bay here studied are not affected by the oligotrophic state of the water masses of the Canary archipelago (BARTON ET AL, 1998). Moreover, low organic matter content (avg. 0.54%) was found in the sediments analyzed, throughout the study period (RIERA ET AL, 2011a); the sedimentary dynamics of Los Cristianos bay could, however, affect meiobenthos community structure. It will be necessary to take this effect into consideration in future studies, giving special emphasis to sediment deposition.
The present study showed a meiofauna community structure typical of a shallow site with several abundant species that are influenced by coastal constraints (winds, waves, currents, freshwater runoff, etc.). The most abundant species
(the nematodes Daptonema hirsutum and
Pomponema sedecima) showed several peaks during the study period, with no clear temporal pattern. These species dominated the meiofauna assemblage structure throughout the study period, and they have been recorded abundantly in fine sands worldwide (KENNEDY, 1994; BLOME ET AL, 1999; GESHKIERE ET AL, 2002). The xyalid D. hirsutum has been observed to be an active migrator to fine sands in experiments of
simulated deposition of dredged material
(SCHRATZBERGER ET AL, 2000). Moreover, these species are typical of sandy substrates with low organic sedimentary content, being scarce or absent in enriched muddy sediments or the “thiobios” components (RPD layer) of reduced environments (SEMPRUCCI ET AL., 2010). Both species (D. hirsutum and P. sedecima) showed significant differences in their abundances throughout the study period, directly influenced the overall meiofaunal abundances.
Table 4. Multivariate multiple regression testing the effect of environmental variables on the overall meiofaunal assemblage structure SS(trace) = portion of sum of squares relative to the analysed predictor variable; pseudo-F = statistic; p = significance level; prop = proportion of variation explained.
Variable SS (trace) Pseudo-F p prop
Total Nitrogen (%) 2314.5 8.633 0.423 0.098
Organic matter (%) 2102.9 10.002 0.401 0.089
Gravels (%) 1788.7 0.876 0.614 0.074
Very coarse sands (%) 1214.5 0.543 0.689 0.069
Coarse sands (%) 3180.9 17.011 0.115 0.156
Medium sands (%) 1103.3 0.465 0.856 0.056
Fine sands (%) 1567 0.834 0.324 0.091
Very fine sands (%) 859.35 0.456 0.917 0.047
Silt/clay (%) 1014.9 0.502 0.826 0.058
The study station was characterized by low variations of sedimentary properties during the year studied, with a dominance of fine sands and low concentrations of organic matter. However, the environmental variables measured were unable to explain the temporal variability of meiofauna assemblages during the study period.
Thus, other environmental factors could be responsible for the meiofaunal variations in the Los Cristianos subtidal location. For example, in subtidal areas, no inequivocal influence of phytoplankton sedimentation on the density and biomass of meiofaunal nematodes was found (HEIP ET AL, 1985, ÓLAFSSON ET AL, 1999). However, SCHRATZBERGER ET AL (2007) showed that populations of the nematode
Spilophorella paradoxa that feed on fresh
organic material exhibited temporal patterns in their abundance and size distribution. Moreover, the temporality of this species was clearly linked to the quality and quantity of organic matter in the sediment (SCHRATZBERGER ET AL, 2007).
One important ecological factor is predation, the effects of which on soft-substrates have received little attention (GREGG AND FLEEGER, 1997). Meiofauna are potentially an important food source for higher trophic levels, particularly macrofauna, flat-fish, juveniles of larger fish, crabs, shrimps and epibenthic predators (HOYT ET AL, 2000; FELLER, 2006). Numerous individuals of sand steenbras (Lithognathus mormyrus) were observed at the sampling station throughout the study period (RIERA, unpubl. data). This species is an important predator on interstitial species, especially epibenthic taxa (e.g. some harpacticoid species) (COULL, 1990).
A more detailed and complete ecological study of the study location is necessary in order to understand meiofauna dynamics and community
structure; this study should include other
environmental factors (e.g. sedimentary dynamics) and biological interactions (e.g. predation).
A
CKNOWLEDGEMENTSWe are grateful to Dr. T. Gheskiere and Dr. M. Vincx (Department of Marine Biology,
University of Ghent, Belgium) for the
bibliographical facilities offered and their
encouragement during the stay of the first author (R.R.), as also to Dr. F. Tuya (University of Las Palmas de Gran Canaria) for his continuous encouragement and interchange of ideas.
R
EFERENCESALBUQUERQUE, E. F.; PINTO, A. P. ALCÂNTARA, A. GOMES, V. Spatial and temporal changes in interstitial meiofauna on a sandy ocean beach of South America. Braz. J. of Oceanogr., 55(2):121-131. 2007.
BLOME, D.; SCHELIER, U. VAN BERNEM, K. H. Analysis of the small-scale spatial patterns of free-living marine nematodes from tidal flats in the East Frisian Wadden Sea. Mar. Biol., 133(4): 717-726. 1999.
COULL, B. C. Long-term variability of estuarine meiobenthos: an 11 year study. Mar. Ecol. Prog.
Ser., 24:205-218. 1985.
COULL, B. C. Ecology of the marine meiofauna. In: Higgins RP and Thiel H (ed.) Introduction to the study of Meiofauna. Washington, D.C. Smithsonian Institution Press, 18-38 pp. 1988.
COULL, B. C. Are members of the meiofauna food for higher trophic levels? Trans. Am. Micros. Soc., 109(3): 233-246. 1990.
DANOVARO, R.; FABIANO, M. VINCX, M. Meiofauna response to the Agrip Abruzzo oil spill in subtidal sediments of the Ligurian Sea. Mar. Pollut. Bull., 30: 133-145. 1995.
DANOVARO, R. Detritus-bacteria-meiofauna interactions in a seagrass bed (Posidonia oceanica) of the NW Mediterranean. Mar. Biol., 127: 1-13. 1996. FELLER, R. J. Weak meiofaunal tropic linkages in
Crangon crangon and Carcinus maenas. J. Exp. Mar.
Biol. Ecology, 330: 274-283. 2006.
FLEEGER, J. W.; SHIRLEY, T. C. ZIEMANN, D. A. Meiofaunal responses to sedimentation from an Alaskan spring bloom. I. Major taxa. Mar. Ecol.
Prog. Ser., 57: 137-145. 1989.
GHESKIERE, T.; HOSTE, E. KOTWICKI, L. DEGRAER, S. VANAVERBEKE, J. VINCX, M. The sandy beach meiofauna and free-living nematodes from De Panne (Belgium). Bulletin de L´Institut Royal des Sciences Naturelles de Belgique, 72(S): 43-49. 2004.
GREGG, J. C.; FLEEGER, J. W. Importance of emerged and suspended meiofauna to the diet of the darter goby (Gobionella bolesoma Jordan and Gilbert). J.
Exp. Mar. Biol. Ecol., 209: 103-142. 1997.
GRÉMARE, A.; AMOROUX, J. M. CHARLES, F. DINET, A. RIAUX-GOBIN, C. BAUDART, J. MEDERNACH, L. BODIOU, J. Y. VETION, G. COLOMINES, J. C. ALBERT, P. Temporal changes in the biochemical composition and nutritional value of the particulate organic matter available to surface deposit-feeders: a two year study. Mar. Ecol. Progr.
Ser., 150: 195-206. 1997.
GUIDI-GUILVARD, L. D.; BUSCAIL, R. Seasonal survey of metazoan méiofaune and surface sediment organics in a non-tidal turbulent sublittoral prodelta (northwestern Mediterranean). Cont. Shelf Res.,15(6): 633-653. 1995.
HICKS, G. R.; COULL, B. C. The ecology of marine meiobenthic harpacticoid copepods. Oceanography and Marine Biology Annual Review 21:67-175. 1983.
HOYT, M.; FLEEGER, J. W. SEIBELING, R. FELLER, R. J. Serological estimation of prey-protein gut-residence time and quantification of meal size for grass shrimp consuming meiofaunal copepods. J.
Exp. Mar. Biol. Ecol., 248: 105-119. 2000.
KENNEDY, A. D. Carbon partitioning within meiobenthic nematode communities in the Exe Estuary, UK. Mar.
Ecol. Prog. Ser., 105: 71-78. 1994.
DE LEONARDIS, C.; SANDULLI, R. VANAVERBEKE, J. VINCX, M. DE ZIO, S. Meiofauna and nematode diversity in some Mediterranean areas of the Adriatic and Ionian Sea. Scientia Marina, 72(1): 5-13. 2008. MAZZOLA, A.; MIRTO, S. LA ROSA, T. FABIANO, M.
DANOVARO, R. Fish-farming effects on benthic community structure in coastal sediments: analysis of meiofaunal recovery. ICES Journal of Marine
Science 57:1454-1461. 2000.
MIRTO, S.; LA ROSA, T. DANOVARO, R. MAZZOLA, A. Microbial and meiofaunal response to intensive mussel-farm biodeposition in coastal sediments of the Western Mediterranean. Mar. Pollut. Bull.,
40(3):244-252. 2000.
NOZAIS, C.; PERISSINOTTO, R. TITA, G. Seasonal dynamics of meiofauna in a South African temporarily open/closed estuary (Mdloti Estuary, Indian Ocean). Estuar. Coast., Shelf Sci., 62: 325-338. 2005.
ÓLAFSSON, E.; ELMGREN, R. Seasonal dynamics of sublittoral meiobenthos in relation to phytoplankton sedimentation in the Baltic Sea. Estuar. Coast., Shelf
Sci., 45: 149-164. 1997.
ÓLAFSSON, E.; MODIG, H. VAN DEN BUND, W. J. Species-specific uptake or radiolabelled phytodetritus by benthic meiofauna from the Baltic Sea. Mar. Ecol.
Prog. Ser., 177: 63-72. 1999.
PALACÍN, C. Estudio ecológico de la meiofauna
bentónica de la Bahía de Els Alfacs (Delta del Ebro). Ecología y sistemática de las poblaciones de nematodos. Ph-D Thesis. University of Barcelona,
406 pp. 1990.
RIERA, R.; NÚÑEZ, J. BRITO, M. C. Short-term variability in sedimentary and compositional properties of two beaches in Tenerife (Canary Islands, NE Atlantic Ocean). Revista de la Sociedad
Geológica de España, 23(3-4): 81-87. 2011a.
RIERA, R.; NÚÑEZ, J. BRITO, M. C. Temporal variability of a subtropical intertidal meiofauna assemblage: contrasting effects at the species and assemblage-level. Vie et Milieu, 61(3): 1-9. 2011b.
RUDNICK, D.; ELMGREN, R. FRITHSEN, J. B. Meiofaunal prominence and benthic seasonality in a coastal marine ecosystem. Oecologia, 67: 157-168. 1985.
SACHS, J. P., REPETA, D. J. Oligotrophy and nitrogen fixation during eastern Mediterranean Sapropel events. Science, 286, 2485. 1999.
SANTOS, P. J. P.; CASTEL, J. SOUZA-SANTOS, L. P. Seasonal variability of meiofauna abundance in the oligo-mesohaline area of the Gironde estuary, France.
Estuar. Coast. Shelf Sci., 43: 549-563. 1996.
SCHIZAS, N. V.; SHIRLEY, T. C. Seasonal changes in structure to an Alaskan intertidal meiofaunal assemblage. Mar. Ecol. Progr. Ser., 133: 115-124. 1996.
SCHRATZBERGER, M.; FORSTER, R. M. GOODSIR, F. JENNINGS, S. Nematode community dynamics over an annual production cycle in the central North Sea. Mar. Environ. Res., 66: 508-519. 2008. SCHRATZBERGER, M.; REES, H. L. BOYDS, S. E.
Effects of simulated deposition of dredged material on structure of nematode assemblages – the role of burial. Mar. Biol., 136: 519-530. 2000.
SEMPRUCCI, F.; COLANTONI, P. BALDELLI, G. ROCCHI, M. BALSAMO, M. The distribution of meiofauna on back-reef sandy platform in the Maldives (Indian Ocean). Mar. Ecol., 31(4): 592-607. 2010.
SOMERFIELD P.; WARWICK, R. M. Meiofauna in
marine pollution programmes. A laboratory manual. Ministry of Agriculture, Fisheries and Food,
Directorate of Fisheries Research, Lowestoft, 71 pp. 1996.
VANHOVE, S.; BEGHYN, M. VAN GANSBEKE, D. BULLOUGH, L. W. VINCX, M. A seasonally varying biotope at Signy Island, Antarctica: implications for meiofaunal structure. Mar. Ecol.
Progr. Ser., 202: 13-25. 2000.
VEZZULLI, L. FABIANO, M. Sediment biochemical and microbial variables for the evaluation of trophic status along the Italian and Albanian Continental Shelves. J.
Mar. Biol. Assoc. UK., 86, 27-37. 2006.
VINCX, M. Seasonal fluctuations and production of nematode communities in the Belgian coastal zone of the North Sea. Belgian Journal of Zoology, 15: 57-66. 1989.