RELATIONSHIP BETWEEN ISOTOPIC COMPOSITION (
18O AND
13C)
AND PLAKTONIC FORAMINIFERA TEST SIZE IN CORE TOPS FROM
THE BRAZILIAN CONTINENTAL MARGIN
Paula Franco-Fraguas*, Karen Badaraco Costa and Felipe Antonio de Lima Toledo
Instituto Oceanográfico da Universidade de São Paulo (Praça do Oceanográfico, 191, 05508-120 São Paulo, SP, Brasil)
*Corresponding author: [email protected]
A
B S T R A C TStable oxygen (δ18O) and carbon (δ13C) isotopic signature registered in fossil planktonic foraminifera tests are widely used to reconstruct ancient oceanographic conditions. Test size is a major source of stable isotope variability in planktonic foraminifera found in sediment samples and thus can compromise paleoceanographic interpretations. Test size/stable isotope (δ18O and δ13C) relationships
were evaluated in two planktonic foraminifer species (Globigerinoides ruber (white) and Globorotalia truncatulinoides (right)) in two core tops from the Brazilian Continental Margin. δ18O measurements were used to predict the depth of calcification of each test size fraction. δ13C offsets for each test size fraction were then estimated. No systematic δ18O changes with size were observed in G. ruber (white) suggesting a similar calcification depth range (c.a. 100 m) during ontogeny. For G. truncatulinoides (right) δ18O values increased with size indicating ontogenetic migration along thermocline waters (250-400 m). δ13C measurements and δ13C offsets increased with size for both species reflecting well known physiological induced ontogenetic-related variability. In G. ruber
(white) the largest test size fractions (300µm and >355µm) more closely reflect δ13CDIC indicating
they are best suited for paleoceanographic studies.
R
E S U M OO tamanho de testa dos foraminíferos é uma importante fonte de variabilidade isotópica (δ18O e δ13C)
em amostras de sedimento marinho comprometendo as interpretações paloeceanograficas. No presente estudo, avaliou-se a relação entre o sinal isotópico medido em diferentes frações de tamanho de testa das espécies planctônicas, Globigerinoides ruber (branca) e Globorotalia truncatulinoides
(dextral) em amostras de topo de dois testemunhos localizados na Margem Continental Brasileira. Os valores de δ18O foram utilizados para estimar a profundidade de calcificação de cada fração de tamanho. Os desequilíbrios nos valores de δ13C para cada fração de tamanho foram estimados. Os valores de δ18O em G. ruber (branca) não apresentaram tendência com o tamanho sugerindo que calcifica dentro de um mesmo intervalo de profundidade (c.a. 100 m) durante a ontogenia. Os valores de δ18O em
G. truncatulinoides (dextral) apresentaram aumento com o tamanho refletindo a migração
ontogênica em águas da termoclina (250-400 m). Os valores e desequilíbrios de δ13C aumentaram com o tamanho nas duas espécies indicando o efeito da variação nas taxas fisiológicas durante a ontogenia. Em G. ruber (white) os valores de δ13C dos maiores tamanhos (300µm e >355µm) refletem melhor os valores de δ13CDIC indicando que são mais apropriados para utilizar nas
reconstruções paleoceanograficas.
Descriptors: Planktonic foraminifera, Stable isotopes, Test size.
Descritores: Foraminíferos planctônicos, Isótopos estáveis, Tamanho testas.
I
NTRODUCTIONDuring the calcification process, planktonic foraminifera record the stable isotope signature and environmental conditions of seawater of their calcification depth in a predictable way (ROHLING; COOKE, 1999). As a consequence, stable oxygen (δ18O) and carbon (δ13C) isotopes
measured in tests of fossil planktonic foraminifera are widely used in paleoceanography as proxies for
paleotemperature, ice volume, water masses movements and paleoproductivity (WEFER et al., 1999; ROHLING; COOKE, 1999). However, in some planktonic species measured stable isotope composition often shows offsets from predicted values (RAVELO; FAIRBANKS, 1995).
ZEEBE et al., 1999). The carbonate ion effect, associated with calcification processes, also induces offsets during calcification of δ13C and δ18O (SPERO
et al., 1997). Both laboratory and field based (with living and fossil foraminifera) studies have demonstrated that these offsets are higher regarding
δ13C than δ18O values. δ18O measurements in tests of
recent planktonic foraminifera can thus be used to evaluate δ13C offsets (ELDERFIELD et al., 2002;
RAVELO; FAIRBANKS, 1995).
Test size is a major source of stable isotope intra-specific variability found in sediment samples. Some of the stable isotopic offsets observed in planktonic foraminifera speciesare related to test size, having important implications when choosing foraminifera test size fractions for paleoceanographic interpretations (OPPO; FAIRBANKS, 1989). The size-related stable isotope variability can be caused by 1) variation in physiological rates during ontogeny (RAVELO; FAIRBANKS, 1995) and 2) variability in calcification depth during the life cycle (e.g., depth migrations along the water column; LOHMANN, 1995), andduring different environmental conditions (e.g., different seasons; DEUSER et al., 1981).
The complexity of isotopic fractionation in foraminifera and its relationship with local environmental condition suggests the importance of evaluating size-related stable isotope variability in areas of paleoceanographic interest. Several authors have used stable isotopes measurements in planktonic foraminifera from the BrazilianContinental Margin as proxies for ancient hydrographic conditions (ARZ, 1998, 1999; TOLEDO et al., 2007). However, there are no local calibration studies concerning both size-related stable oxygen and carbon isotopes in planktonic foraminifera.
The most straightforward approach for the evaluation of paleoceanographic proxies is the analysis of core top samples and its relationship with modern hydrographic conditions. The present work explores sieve size-related stable isotope oxygen and carbon variability in two species of planktonic foraminifera,
Globigerinoides ruber (white) and Globorotalia truncatulinoides (right), in two core tops from the
Brazilian Continental Margin. Additionally, we estimated the depth of calcification reflected by measured δ18O values retained in each sieve size
fraction and analyzed which test size fraction best reflects seawater carbon stable isotope signature in the previously estimated calcification depth.
M
ATERIALS ANDM
ETHODSCores and Oceanographic Context
We measured the oxygen and carbon isotopes of planktonic foraminifera from two piston
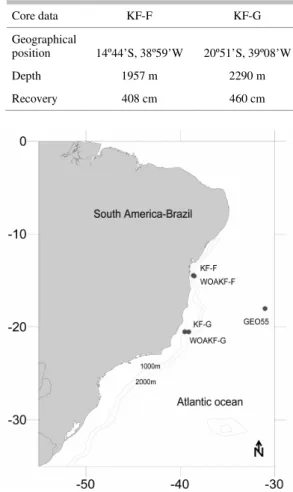
core tops, KF-F and KF-G (Table 1) recovered from the Brazilian Continental Margin in the southwestern South Atlantic (Fig. 1).
Table 1. Location, depth and recovery of KF-F and KF-G cores.
Fig. 1. Study area showing core top locations (F and KF-G), WOA05 data (WOAKF-F and WOAKF-G) and GEOSECS data (GEO55).
The Brazilian southeastern margin is characterized by the stacking of several water masses, including Tropical Water (TW), South Atlantic Central Water (SACW), Antarctic Intermediate Water (AAIW), North Atlantic Deep Water (NADW) and the Antarctic Bottom Water (AABW). The surface waters result from the mixing of three water masses: the TW, a hot (T>18.8ºC) and high-salinity water (S> 36%), the coastal waters and the waters resulting from vertical excursions (upwelling) of the SACW
Core data KF-F KF-G
Geographical
position 14º44’S, 38º59’W 20º51’S, 39º08’W
Depth 1957 m 2290 m
(GARFIELD, 1990). The SACW is cooler (T<18.8ºC) and less saline (S<36%) (DUARTE; VIANA, 2007).
Chronology and Isotopic Measurements
Chronology was based on the correlation of the isotopic record of benthic foraminifera with SPECMAP chronology of Martinson et al. (1987) and on radiocarbon data using Accelerator Mass Spectrometer (AMS) radiocarbon dating performed on two samples of monospecific planktonic foraminifera (G. ruber) from the core top sample of each core (1cm - KF-F and 1.5cm - KF-G). The 14C-AMS dating were
performed at NOSAMS- WHOI laboratory facility, and all the 14C ages were corrected for a reservoir
effect of 400 yrs and transformed into calendar yrs (BARD, 1993).
Stable isotopes analyses were carried out at Woods Hole Oceanographic Institution, MA, USA using a Finnigan MAT253 mass spectrometer with the automated Kiel device. Isotope values are represented in standard δ notation relative to the Vienna Pee Dee
Belemnite (VPDB) for calcite and Vienna Standard-Mean-Water (VSMOW) for sea water. Calibration of the PDB was done via the NBS-19 with an accuracy of ±0.07 for δ18O and ±0.03 for δ13C.
Sampling Procedure
Cores were previously sub-sampled every 5-10cm and samples washed with distilled water over a 63µm mesh size and dried at 50ºC. In order to work with Holocene samples, the three core top samples of each core with lower δ18O values (based on available Globigerionides ruber stable oxygen isotopes) were
selected: 1cm, 6cm and 11cm from KF-F and 1.5cm, 9cm and 16cm from KF-G.
The samples were separated in the following sieve size fractions: 150-250µm, 250-300µm, 300-355µm and >300-355µm according toavailability of some of the more frequent sieve size fractions used in calibration (ELDERFIED et al., 2002; RAVELO; FAIRBANKS, 1992, 1995) and reconstruction (ARZ et al., 1998, 1999; TOLEDO et al., 2007) studies. The surface dwelling G. ruber (white) and the deep
dwelling Globorotalia truncatulinoides (right) species
were identified based on Van Morkoven et al. (1986) and Hemleben et al. (1989). Stable isotope measurements were conducted on between three and six G. ruber (white) tests and on between three and
four G. truncatulinoides (right) tests depending on the size fraction. In KF-F, 4 replicates samples of G. ruber (white) were analyzed in the 150-250µm and 250-300 µm size classes allowing evaluation of within size fraction variability. The largest individuals of each size fraction were picked to improve sample comparison. Tests with apparent good preservation
(e.g., without fragmentation and color or texture modification) were picked and samples with apparent attached sediments were washed by ultrasonification.
Stable Isotope / Test Size Relationship
The effect of size fraction on each species for both corers was evaluated by a one-way analysis of variance (ANOVA). The Kolmogorov-Smirnov D statistic was used to check for normality, while Cochran’s C-test was used to check the assumption of homogeneity of variances. In cases where homogeneity was not achieved, we set the critical level to a value equal to the p-value for variance homogeneity (UNDERWOOD, 1997). All analyses wereperformed separately for both isotopic values of each species.
Hydrographic Data and Isotopic Composition in the Water Column
Hydrographic data (annual temperature and salinity) along the surface water masses from two stations next to each core top location were extracted from the World Ocean Atlas, 2005 (WOA05) (LOCARNINI et al., 2006; ANTONOV et al., 2006) and are henceforth called WOAKF-F and WOAKF-G forproximity to cores KF-F and KF-G, respectively (Fig. 1). These data was used to identify surface water masses and for estimating oxygen stable isotope values in seawater (δ18OW) and in equilibrium with
seawater (δ18OEQ). Water masses and mixed layer
limits were based on Silveira et al. (2000) and Tomczak and Godfrey (1994), respectively.
δ18OW values were estimated based on
annual salinity WOA05 data and δ18O/salinity
equations from Legrand and Schmidt (2006). Tropical Atlantic (eq. 1) and South Atlantic (eq. 2) equations (LEGRAND; SCHMIDT, 2006) were used to estimate
δ18OW for TW and SACW water masses, respectively.
δ18OW = S * 0.15 - 4.61 (eq. 1)
δ18OW = S * 0.51 - 17.40 (eq. 2)
where δ18OW = δ18O of seawater (VSMOW, %) and S
= salinity (%)
Predicted Stable Isotope Values and relationship with the Isotopic Measurements in Foraminifera
assumed to be principally a function of stable isotope signature in seawater (δ18OW) and temperature. Thus,
comparison of δ18O measurements in core top
planktonic tests with predicted values of calcite in equilibrium with modern seawater (δ18OEQ) (obtained
from paleotemperature equations) will provide information about the calcification depth of each species (RAVELO; FAIRBANKS, 1992; NIEBLER et al., 1999).
We estimated calcite precipitated in isotopic equilibrium with seawater (δ18OEQ) based on δ18OW
values, annual temperature (WOA05) and using well known paleotemperature equations (see below).
δ18OEQ (VSMOW) were converted to δ18OEQ (VPDB)
values afterHUT (1987) equation.
Different inorganic paleotemperature equations have been proposed for calibration and paleoceanographic purposes (SHACKLETON, 1974; KIM; O´NEIL, 1997). Spero et al. (1997) demonstrated that besides temperature, ambient carbonate ion concentration also influence δ18O
calcification in foraminifera. Mulitza et al. (2003) calibrated a new paleotemperature equation using living surface dwelling foraminifera (including G. ruber). This paleotemperature equation takes into
consideration surface seawater carbonate ion concentration influence on δ18O measurements. Hence,
comparison of δ18O measurements in surface dwelling
foraminifera (e.g., G. ruber) with predicted δ18O of
calcite in equilibrium with seawater (δ18OEQ) based on
Mulitza et al. (2003) in a more appropriate estimation of the calcification depth for this species. Thereafter, Mulitza et al. (2003) paleotemperature equation (eq. 3) was used to estimate depth of calcification of G. ruber
(white). Kim and O’Neil (1997) and Mulitza et al. (2003) paleotemperature equations do not differ significantly atthermocline depth (MULITZA et al., 2003). Thus, in order to allow comparisons with other studies based on paleotemperature inorganic equations, Kim and O’Neil (1997) paleotemperature equation (eq. 4) was used to estimate G. truncatulinoides (right) depth of calcification.
T = 16.1 - 4.64 (δ18O - δ18OW) + 0.09 (δ18O - δ18OW)2
(eq. 3)
T= 14.32 - 4.28 (δ18O - δ18OW) + 0.07 (δ18O - δ18OW)2
(eq. 4)
where T = temperature (ºC), δ18O = predicted δ18O of
calcite in equilibrium with seawater (VSMOW,%) and
δ18Ow= δ18O of seawater (VSMOW, %).
δ13C equilibrium fractionation and its
temperature dependence are still in debate. While Emrich et al. (1970) and Romanek et al. (1992) proposed dependent and
temperature-independent equilibrium equations, respectively, different calibrating studies use δ13CDIC to predict
seawater values (ELDERFIELD et al., 2002). For evaluation of δ13C offsets in planktonic foraminifera
we choose the third approach. δ13CDIC values were
obtained from GEOSECS (station 55; 18ºS, 31ºW) (BAINDBRIDGE, 1981) close to core locations (Fig. 1).
For both species, δ18O measurements in
foraminiferal tests were used to predict the calcification depth for each test-size fraction, and therefore the δ13C of dissolved inorganic carbon of
seawater (δ13CDIC). The δ13C values in foraminifera are
assumed to reflect the δ13C values of the seawater of
calcification and probably physiological effects. Thus, offsets from predicted values of each test size fraction were calculated subtracting δ13C measured values
from the predicted values at the depth of calcification. Only AMS radiocarbon Holocene-dated foraminifera samples (Table 2) were used to compare to surface water δ18OEQ and δ13CDIC values.
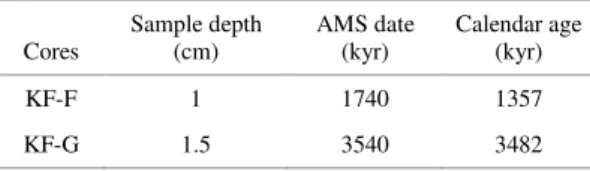
Table 2. Accelerator Mass Spectrometer (AMS) Dates and Calendar Ages.
Cores
Sample depth (cm)
AMS date (kyr)
Calendar age (kyr)
KF-F 1 1740 1357
KF-G 1.5 3540 3482
R
ESULTSIsotopic Composition of Water Column
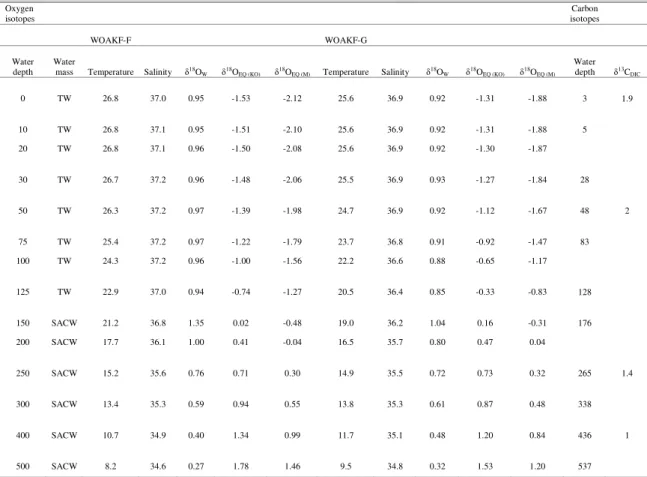
Hydrographic data and stable isotopic values in seawater are presented in Table 3. TW and SACW limit was established at 150 m. On an annual basis, temperature mixed layer limit was ca. 50 m. Thermocline waters ranged from the mixed layer limit down to ca. 1000 m. δ18OW decreased along the water
column reflecting the relatively high evaporation in surface waters. δ18OEQ increased with depth according
to the decrease in temperature. Higher δ18OEQ values at
WOAKF-G with respect to WOAKF-F reflects its southernmost location along the Brazilian Continental Margin. Mixed layer δ18OEQ values estimated using
Mulitza et al. (2003) paleotemperature equation ranged between -2.12% and -1.98% in WOAKF-F and between -1.88% and -1.67% in WOAKF-G (Table 3). Thermocline (depth>50 m) δ18OEQ values
estimated using Kim and O’Neil (1997) equation showed minima of -1.39% and -1.12% values in WOAKF-F and WOAKF-G, respectively. Mixed layer
δ13CDIC value was 1.9% and decreased with depth
Table 3. Surface water masses (Tropical Water (TW) and South Atlantic central waters (SACW)), temperature (ºC), salinity (‰), δ18O
W (‰), δ18OEQ (‰) estimated from Kim and O`Neil (1997) (KO) and Mulitza et al. (2003) (M) paleotemperature
equations and δ13CDIC (‰).
Foraminifera oxygen stable isotopes
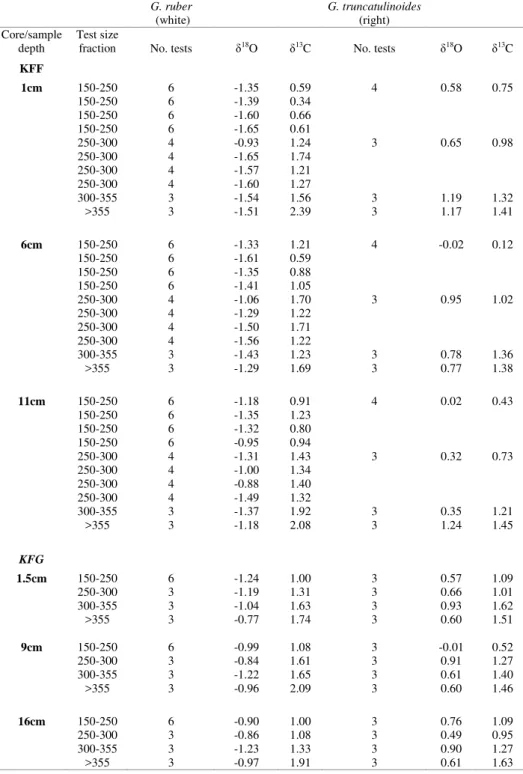
All stable isotope results are presented in Table 4. Maximum δ18O variability within a same G. ruber (white) size fraction (250-300µm) was 0.72%.
There were no systematic changes in δ18O with size
for G. ruber (white) (Figure 2a, ANOVA; F (3, 38) =
0.895, p >0.05). Systematic increment in δ18O with
size for G. ruber (white) (Fig. 2a, ANOVA; F (3, 38) =
0.895, p >0.05). Systematic increment in δ18O with
size was evident for G. truncatulinoides (Fig. 2a,
ANOVA; F (3, 20) = 3.686, p < 0.05).
Comparison of G. ruber (white) δ18O
measurements in 1cm (KF-F) and 1.5cm (KF-G) with predicted δ18OEQ values for surface water above each
core top location using Mulitza et al. (2003) (M) equation indicates a depth of calcification of ca. 100 m (Fig. 3a, b). Depth of calcification for G. truncatulinoides (right) using Kim and O’Neil (1997)
paleotemperature equation (KO) was ca. 250 m for the smallest size fraction (150-250µm) and between 250 m (KF-G) and 400 m (KF-F) for the largest size fraction (>355µm) (Fig. 3a, b).
Foraminifera Carbon Stable Isotopes
Maximum G. ruber (white) δ13C variability
within a size fraction (KF-F; 150-250µm) was 0.62%.
G. ruber (white) δ13C measurements increased with
size (Fig. 2b, ANOVA; F (3, 38) = 36.36, p < 0.01) with
a maximum δ13C difference of 1.85% between
extreme size fractions (KF-F; 1cm). G. truncatulinoides (right) δ13C also increased with size
(Fig. 2b, ANOVA; F (3, 20) = 15.73, p <0.01) with
maximum variation of 1.26% between extreme size fractions (KF-F; 6cm). G. truncatulinoides (right) show lighterδ13C values than G. ruber (white) (Fig.
2b).
Oxygen
isotopes isotopes Carbon
WOAKF-F
WOAKF-G
Water depth
Water
mass Temperature Salinity δ18OW δ18OEQ (KO)
δ18OEQ (M) Temperature Salinity δ18OW δ18OEQ (KO)
δ18OEQ (M)
Water depth δ13CDIC
0 TW 26.8 37.0 0.95 -1.53 -2.12 25.6 36.9 0.92 -1.31 -1.88 3 1.9
10 TW 26.8 37.1 0.95 -1.51 -2.10 25.6 36.9 0.92 -1.31 -1.88 5
20 TW 26.8 37.1 0.96 -1.50 -2.08 25.6 36.9 0.92 -1.30 -1.87
30 TW 26.7 37.2 0.96 -1.48 -2.06 25.5 36.9 0.93 -1.27 -1.84 28
50 TW 26.3 37.2 0.97 -1.39 -1.98 24.7 36.9 0.92 -1.12 -1.67 48 2
75 TW 25.4 37.2 0.97 -1.22 -1.79 23.7 36.8 0.91 -0.92 -1.47 83
100 TW 24.3 37.2 0.96 -1.00 -1.56 22.2 36.6 0.88 -0.65 -1.17
125 TW 22.9 37.0 0.94 -0.74 -1.27 20.5 36.4 0.85 -0.33 -0.83 128
150 SACW 21.2 36.8 1.35 0.02 -0.48 19.0 36.2 1.04 0.16 -0.31 176
200 SACW 17.7 36.1 1.00 0.41 -0.04 16.5 35.7 0.80 0.47 0.04
250 SACW 15.2 35.6 0.76 0.71 0.30 14.9 35.5 0.72 0.73 0.32 265 1.4
300 SACW 13.4 35.3 0.59 0.94 0.55 13.8 35.3 0.61 0.87 0.48 338
400 SACW 10.7 34.9 0.40 1.34 0.99 11.7 35.1 0.48 1.20 0.84 436 1
500 SACW 8.2 34.6 0.27 1.78 1.46 9.5 34.8 0.32 1.53 1.20 537
Table 4. δ18O (‰) and δ13C (‰) values registered in G. ruber (white) and G. truncatulinoides (right).
G. ruber
(white)
G. truncatulinoides
(right) Core/sample
depth
Test size
fraction No. tests δ18O δ13C No. tests δ18O δ13C
KFF
1cm 150-250 6 -1.35 0.59 4 0.58 0.75
150-250 6 -1.39 0.34
150-250 6 -1.60 0.66
150-250 6 -1.65 0.61
250-300 4 -0.93 1.24 3 0.65 0.98
250-300 4 -1.65 1.74
250-300 4 -1.57 1.21
250-300 4 -1.60 1.27
300-355 3 -1.54 1.56 3 1.19 1.32
>355 3 -1.51 2.39 3 1.17 1.41
6cm 150-250 6 -1.33 1.21 4 -0.02 0.12
150-250 6 -1.61 0.59
150-250 6 -1.35 0.88
150-250 6 -1.41 1.05
250-300 4 -1.06 1.70 3 0.95 1.02
250-300 4 -1.29 1.22
250-300 4 -1.50 1.71
250-300 4 -1.56 1.22
300-355 3 -1.43 1.23 3 0.78 1.36
>355 3 -1.29 1.69 3 0.77 1.38
11cm 150-250 6 -1.18 0.91 4 0.02 0.43
150-250 6 -1.35 1.23
150-250 6 -1.32 0.80
150-250 6 -0.95 0.94
250-300 4 -1.31 1.43 3 0.32 0.73
250-300 4 -1.00 1.34
250-300 4 -0.88 1.40
250-300 4 -1.49 1.32
300-355 3 -1.37 1.92 3 0.35 1.21
>355 3 -1.18 2.08 3 1.24 1.45
KFG
1.5cm 150-250 6 -1.24 1.00 3 0.57 1.09
250-300 3 -1.19 1.31 3 0.66 1.01
300-355 3 -1.04 1.63 3 0.93 1.62
>355 3 -0.77 1.74 3 0.60 1.51
9cm 150-250 6 -0.99 1.08 3 -0.01 0.52
250-300 3 -0.84 1.61 3 0.91 1.27
300-355 3 -1.22 1.65 3 0.61 1.40
>355 3 -0.96 2.09 3 0.60 1.46
16cm 150-250 6 -0.90 1.00 3 0.76 1.09
250-300 3 -0.86 1.08 3 0.49 0.95
300-355 3 -1.23 1.33 3 0.90 1.27
Offsets from predicted values increased with size fractions for both species (Fig. 4a, b). For G. ruber (white) δ13C measurements in the largest size
fractions (300-355µm and >355µm) are closer to
δ13CDIC values in the corresponding depth of
calcification (offset ≈ 0) (Fig. 4a). Concerning G. truncatulinoides (right), the largest size fractions seem
to present lower offsets, although this was not so clear (Fig. 4b).
Fig. 2. δ18O (A) and δ13C (B) values measured in G. ruber (white) (square symbols) and G. truncatulinoides (right) (triangle
symbols) related to sieve size fractions in all (KF-F and KF-G) samples. Dotted lines join mean values. Vertical bars denote 0.95 confidence intervals.
Fig. 3. δ18O values related to
G. ruber (white) (open symbols) and G. truncatulinoides (right) (close symbols) sieve test size
fractions for dated Holocene samples in KF-F (A) and KF-G (B) used to compare with surface water δ18O
EQ values. δ18OEQ
Fig. 3. δ13C offsets (δ13Cforams - δ13CDIC) for G. ruber (white) (A) and G. truncatulinoides (right) (B) for different sieve test size
fractions in KF-F (close symbols) and KF-G (open symbols), dated Holocene samples.
D
ISCUSSIONComparison of Core top Samples with Modern Hydrographic Conditions
Even though all samples reflect Holocene surface water conditions, only dated samples were used for comparison with modern hydrological conditions. Comparison of modern hydrographic data and core-top samples may have some methodological limitations concerning time scales. While modern WOA05 data represent mean hydrological conditions from the last decades, core tops used in this study reflect late Holocene conditions, i.e. 1357kyr (KF-F) and 3482kyr (KF-G). However, several authors suggested relatively weak upper water column hydrographic changes during the Holocene from the Brazilian Continental Margin (ARZ, 1998; TOLEDO et al., 2007). Moreover, this approach is commonly used for core top isotopic calibration studies worldwide (RAVELO; FAIRBANKS, 1992, 1995; ELDERFIELD et al., 2002; MULITZA et al., 2003; WAELBROECK et al., 2005).
Stable Isotope (δ18O and δ13C) Variability Within a Single Size Fraction
Several factors can influence δ18O
planktonic foraminifera intra-specific variability; variable depth and season of calcification (MULITZA et al., 2003); variable calcification, respiration and photosynthesis rates (WOLF-GLADROW et al., 1999); amount of secondary calcification (HEMLEBEN et al., 1989); different morphotypes
(LOWEMARK et al., 2005); dissolution
(LOHMANN, 1995) and bioturbation (MULITZA et al., 2003). Regarding δ13C values, the variability in
depth and season of calcification as well as variable calcification, respiration and photosynthesis rates (WOLF-GLADROW et al., 1999) can result in important intra-specific variability.
Paleoceanographic interpretations are usually based on a single test size fraction. However, since intra-specific variability is inversely related to the amount of foraminifera tests used per stable isotopic analysis (WAELBROECK et al., 2005), the use of as many tests as possible per isotope analysis (e.g., ca. 20 tests per analysis) (WAELBROECK et al., 2005) has been suggested. This should decrease the stable isotope variability within a single size fraction and identify the average stable isotope signature of a fossil population.
In this study, the maximum intra-specific variability found within replicates of a single size fraction for G. ruber (white) using 4-6 tests per
analysiswas 0.72% for δ18O (KF-F; 250-300µm) and
0.62% for δ13C (KF-F; 150-250µm). These results are
in agreement with equatorial Pacific G. ruber studies
using single test analysis (e.g., 2%, 250-350µm for
δ18O and δ13C) (WAELBROECK et al., 2005). During
calcification a δ18O increment of 0.25% accounts for a
diminution of 1ºC for ambient seawater temperature (ROHLING; COOKE, 1999), whereas during δ13C
analyzing replicate samples in some size fractions and several Holocene samples in each core location.
δ18O/test Size Relationship
Studies concerning δ18O/test size
relationship in the shallow dwelling G. ruber in recent
sediment samples along a complete range of test sizes show either a decrease with size (KROON; DARLING, 1995), a slight increase with size (BERGER et al., 1978) or no systematic changes with size (ELDERFIELD et al., 2002; WAELBROECK et al., 2005). The decrease with size was explained as local seasonal environmental factors (irradiance, salinity and/or temperature) affecting both size and stable isotope signature of G. ruber (KROON;
DARLING, 1995). The increase with size was suggested to reflect the development of adult secondary calcification in cold deeper waters (DUPLESSY et al., 1981). The lack of systematic
δ18O/test size variation observed for G. ruber (white)
suggests that in the study area this species calcify without environmentally-induced test size and stable isotope variations and/or along a similar range of depths during ontogeny.
G. trunatulinoides is a deep dwelling species
which undergoes vertical migration during its ontogeny (HEMLEBEN et al., 1989; LOHMANN, 1995). This implies the calcification of an ontogenetic calcite test in shallow, warmer waters during juvenile stages and a secondary calcification crust in deeper, cooler waters during adult stages (HEMLEBEN et al., 1989). Thereafter, G. truncatulinoides incorporates a lighter and heavier δ18O signature during primary and
secondary calcification, respectively (LOHMANN, 1995; MULITZA et al., 1997). However, its bulk test chemistry is a mixture of two end-member calcite and depends on the relative proportion of each calcite (LOHMANN, 1995). In this work it was not intended to identify calcification crust. Hence, the systematic
δ18O increase with size fraction reflect migratory
behavior.
Apparent depth of calcification
Several studies have demonstrated the potential of δ18O measurements in core top planktonic
foraminifera to reflect species´ calcification depth (NIEBLER et al., 1999; RAVELO; FAIRBANKS, 1992). Plankton studies demonstrated that the symbiont-bearing G. ruber (white) is a surface
dwelling species associated with the mixed surface layer (KEMLE-VON MUCKE; OBERHANSLI, 1999). In the region, the depth of maximum G. ruber
density (0-40 m; Sorano, pers. com.) is coincident with the estimated annual mixed layer depth (ca. 50 m).
The reflected depth of calcification here estimated (ca. 100 m) agreed with previous reported data from the region (CHIESSI et al., 2007) based on annual temperature and the same paleotemperature equation. The difference between this estimated depth of calcification and the plankton habitat depth may be due to seasonal flux, vertical migration and/or post-depositional effects (MULITZA et al., 2003). However, since seasonal flux in this species seems to occur mainly during summer this should be reflected in a sediment mean flux-weighed shift towards lighter than annual mean δ18O values (MULITZA et al.,
2003), thus making this explanation improbable. Although dissolution effects are unlikely because of the relatively shallow sampling water depth (ca. 2000 m) with respect to lysocline depth in the modern South Atlantic ocean (ca. 4100 m; FRENZ; HENRICH, 2007), bioturbation may occur in areas of low sedimentation rates such as the study region (3cm/1000kyr, TOLEDO et al., 2005). Nonetheless, differences between living and sediment G. ruber
(white) δ18O measurements (0.5-1.0%) were also
observed in global studies (MULITZA et al., 2003; WAELBROECK et al., 2005) discarding late Holocene samples with possible bioturbation. In this paper, δ18O / sieve size relationship suggests G. ruber
(white) calcification along a similar depth range during ontogeny, while Mulitza et al. (2003) and Waelbroeck et al. (2005) suggest calcification in deeper waters during ontogenesis or gametogenesis as a probable explanation of this observed isotopic difference. This difference seems to be higher in low latitudes where stratification of the water column is more pronounced and in areas of low surface salinity (WAELBROECK et al., 2005). These authors stated that the relationship between δ18O equilibrium calcite
and δ18O from sediment planktonic foraminifera is
complex and depends on local hydrography. Therefore, differences between plankton and sediment
G. ruber δ18O values must be taken into account
during paleoceanographic interpretations based on sediment samples (WAELBROECK et al., 2005).
For the deep dwelling G. truncatulinoides
(right) the depth of calcification estimated agreewith Mulitza et al. (1997) for tropical waters and suggests primary calcification below the highly stratified mixed layer waters (ca. 250 m) and adult calcification of a secondary crust in deeper cold waters (ca. 400 m). Moreover, this adult calcification depth coincides with the temperature known to trigger the calcification of the secondary crust (8-10ºC, HEMLEBEN et al., 1989).
δ13C/test Size Relationship and δ13C offsets
known in other regions in both plankton (WILLIAMS et al., 1981; DUPLESSY et al., 1981) and sediment samples (HEMLEBEN et al., 1989; RAVELO; FAIRBANKS, 1995; ELDERFIELD et al., 2002). This increase is commonly explained invoking different rates of calcification, respiration and photosynthesis (in symbiotic species) along foraminiferal ontogeny. These factors influence the chemistry of the microenvironment of foraminifera and hence the δ13C registered in the tests (ZEEBE et
al., 1999; WOLF-GLADROW et al., 1999). For G. truncatulinoides (right) this increase opposed the
seawater δ13CDIC gradient (decrease with depth)
contradicting the depth of calcification reflected by
δ18O values. The highest δ13C values observed in G. ruber (white) compared with G. truncatulinoides in
size fractions agree with other studies (WILLIAMS et al. 1981; RAVELO; FAIRBANKS, 1995) and likely reflects calcification of G. ruber in shallower waters.
Physiological effects result in size-dependent offsets from predicted δ13C values, suggesting the
need to limit test size fractions used in paleoceanographic studies. Ravelo and Fairbanks (1995) observed G. ruber (white) δ13C offsets varied
with regional hydrography although they attributed it to uncertainties in seawater δ13CDIC values. The use of
small amount of tests per analysis in the largest size fractions together with scarce δ13CDIC values available
in the region precludes evaluating differences in δ13C
offsets between core tops. However, it is clear that
δ13C measurements of the largest size fractions
(300-355µm and >(300-355µm) of G. ruber (white) are closer to
predicted δ13CDIC values from the estimated depths of
calcification. This agree with Elderfield et al. (2002) and Ravelo and Fairbanks (1995) and indicates that physiological size-related effects decrease with size and/or that opposed physiological effects cancel each other in the largest test size fractions. Thus, the largest test size fractions of G. ruber (white) are more
adequate for paleoceanographic interpretations based on δ13C measurements. For G. truncatulinoides (right)
δ13C offsets also vary with test size indicating
physiological size-related influence on δ13C offsets.
Elderfield et al. (2002) observed that the largest size fractions of G. truncatulinoides were closer to predicted δ13CDIC values in the depth of calcification.
In this work this was not so clear. This suggests that other factors than size-related physiological effects are influencing δ13C offsets in G. truncatulinoides. This line up with Ravelo and Fairbanks (1995) who observed size-related offsets even using a larger amount of G. truncatulinoides tests per analysis. They
demonstrated that temperature also affects δ13C offsets
in G. truncatulinoides (right) showing the complexity
in G. truncatulinoidesδ13C fractionation.
C
ONCLUSIONS ANDP
ALEOCEANOGRAPHICI
MPLICATIONSDespite limitations due to the use of relatively small amount of tests per analysis and limited local δ13CDIC values, measurements of isotopic
composition (δ18O and δ13C) of sieve test size fractions
of two planktonic foraminifera species (G. ruber
(white) and G. truncatulinoides (right)) in core top
samples from the Brazilian Continental Margin allowed evaluation of isotopic variability within and between size fractions. Comparison of measured δ18O
and δ13C values with predicted modern seawater δ18OEQ and δ13CDIC values allowed estimation of the
calcification depth and of δ13C offsets, respectively,
for each test size fraction for both species.
Within a single size fraction, maximum variability between replicates using 4-6 tests of
G. ruber (white) per analysis for δ18O and δ13C
indicates that the use of a larger amount of tests per isotopic analysis will improve accuracy when searching for within-size fraction average population values.
Considering G. ruber (white), lack of
significant δ18O differences between sieve size
fractions suggests that this species calcify within a similar depth range during ontogeny. The difference between estimated calcification depth (ca. 100 m) and G. ruber mixed layer habitat depth (ca. 50 m) must be
taken into account for paleoceanographic interpretations. Regarding δ13C values, a significant
increment with sieve size fraction reflected the influence of physiological effects during fractionation and indicates the importance of limiting the sieve size fraction in paleoceanographic studies. The highest sieve size fractions (300-355µm and >355µm) better reflect δ13CDIC values of surface
waters in the region and thus are more suitable for reconstruction of ancient surface water nutrient conditions.
Regarding G. truncatulinoides (right), the δ18O increment with sieve size fraction reflected the
vertical migration of this species along thermocline waters with calcification of juvenile tests in shallower waters (ca. 250 m) and adult tests in deeper cooler waters (ca. 400 m). δ13C measured values also
increased with sieve size fraction, contrasting with the vertical seawater δ13CDIC gradient. Variation in δ13C
offsets of G. truncatulinoides (right) suggests that
caution must be taken when using δ13C measured in
this species for paleoceanographic interpretations.
A
CKNOWLEDGMENTSSuperior (CAPES). We thank Petrobras for providing the samples. The study benefited greatly from the comments of the two anonymous reviewers. We thank Alvar Carranza for his help with the English version of the manuscript.
R
EFERENCESANTONOV, J. I.; LOCARNINI, R. A.; BOYER, T. P.; MISHONOV, A. V.; GARCIA, H. E. World Ocean Atlas, 2005, v.2: Salinity. LEVITUS, S. (Ed.). NOAA Atlas NESDIS G2, U.S. Washington, D.C.: Government Printing Office, 2006. 182 p.
ARZ, H. W.; PATZOLD, J.; WEFER, G. Correlated millennia-scale changes in surface hydrography and terrigenous sediment yield inferred from last-glacial marine deposits off northeastern Brazil. Quat. Res., v. 50, p. 157-166, 1998.
ARZ, H. W.; PATZOLD, J.; WEFER, G. The deglacial history of the western tropical Atlantic as inferred from high resolution stable isotope records off northeastern Brazil. Earth and planet. Sci. Letts, v. 167, p. 105-117, 1999.
BAINBRIDGE, A.E. GEOSECS Atlantic Expedition, Hydrographic Data, 1972-1973, v. 1. Washington,D. C.: US Government Printing Office, 1981. 121 p.
BARD, E. Present status of the radiocarbon calibration for the late Pleistocene. In: FOURTH INTERNATIONAL CONFERENCE ON PALEOCEANOGRAPHY. 15, GEOMAR Report, p. 52-53. GEOMAR, Kiel. 1993. BERGER, W. H.; KILLIKGLEY, J. S.; VINCENT, E. Stable
isotopes in deep-sea carbonates: Box core ERDC-92, West Equatorial Pacific. Oceanol. Acta, v. 1, n. 2, p. 203-215, 1978.
BROECKER, W. S.; MAIER-REIMER, E. The influence of air and sea exchange on the carbon isotope distribution in the sea. Glob. Biogeochem. Cycl., v. 6, n. 3, p. 315-320, 1992.
CHIESSI, C. M.; Ulrich, S.; Mulitza, S.; Patzold, J. Wefer, G.. Signature of the Brazil-Malvinas Confluence (Argentine Basin) in the isotopic composition of planktonic foraminifera from surface sediments. Mar. Micropaleontol., v. 64, p. 52-66, 2007.
DEUSER, W. G.; ROSS, E. H.; HEMLEBEN, C.; SPLINDLER, M. Seasonal changes in species composition, numbers, mass, size, and isotopic composition of planktonic foraminifera settling into the deep Sargasso Sea. Palaeogeogr. Palaeoclimatol. Palaeoecol., v. 33, p. 103-127, 1981.
DUARTE, C. L. S.; VIANA, A. R. Santos Drift System: stratigraphic organization and implications for late Cenozoic palaeocirculation in the Santos Basin, SW Atlantic Ocean. In: VIANA, A. R.; REBESCO, M. (Ed.). Economic and Palaeoceanographic Significance of Contourite Deposits. Geolog. Soc., London, Spec. Publs, v. 276, 171-198. 2007.
DUPLESSY, J.; BLANC, P.; BE, A. W. H. Oxygen-18 enrichment of planktonic foraminifera due to gametogenic calcification below the euphotic zone. Science, v. 213, p. 1247-1249, 1981.
ELDERFIELD, H.; VAUTRAVERS, M.; COOPER, M. The relationship between test size and Mg/Ca, Sr/Ca, δ18O and δ13C of species of planktonic foraminifera. Geochem. Geophys. Geosystems, v. 3, n. 8, 2002. EMRICH, K.; ELHALT, D. H.; VOGEL, J. C. Carbon
isotope fractionation during the precipitation of calcium carbonate. Earth planet. Sci. Letts, v. 8, p. 363-371, 1970.
GARFIELD, N. The Brazil Current at subtropical latitudes. PhD thesis, University of Rhode Island, Narragansett. 1990.
FRENZ, M.; HENRICH, R. Carbonate dissolution revealed by silt grain-size distribution: comparison of Holocene and Last Glacial Maximum sediments from the pelagic South Atlantic. Sedimentology, v. 54, n. 2, p. 391-404, 2007.
HEMLEBEN, C.; SPINDLER, M.; ANDERSON, O. R. (Ed.). Shell Ontogeny. In: Modern Planktonic Foraminifera. New York: Springer-Verlag, 1989. p. 221-257.
HUT, G. Consultants group meeting on the stable isotope reference samples for geochemical and hydrological investigations, Rep, to Dir. Ge., Int. At. Energy Agency, Vienna, 1987. 42 p.
KEMLE-VON MUCKE, O.; HEMLEBEN, C. Foraminifera.
In: South Atlantic Zooplankton. v. 1.
BOLTOVSKOY, D. (Ed.). Leiden: Backhuys Publishers, 1999. 868 p.
KIM, S. T.; O´NEIL, J. R. Equilibrium and nonequilibrium oxygen isotope effects in synthetic carbonates. Geochim. Cosmochim. Acta, v. 61, p. 3461-3475, 1997.
KROON, D.; DARLING, K. Size and upwelling control of the stable isotope composition of Neogloboquadrina dutertrei (D`Orbigny), Globigerinoides ruber
(D`Orbigny) and Globigerina bulloides (D`Orbigny): examples from the Panama Basin and Arabian Sea. J. Foram. Res., v. 25, n. 1, p. 39-52, 1995.
LEGRANDE, A. N.; SCHMIDT, G. A. Global gridded data set of the oxygen isotopic composition in seawater.
Geophys. Res. Lett., v.33, L12604,
doi:10.1029/2006GL026011, 2006.
LOCARNINI, R. A.; MISHONOV, A. V.; ANTONOV, J. I.; BOYER, T. P.; GARCIA, H. E. World Ocean Atlas, 2005, v. I: Temperature. LEVITUS, S. (Ed.). NOAA Atlas NESDIS G1, U.S. Washington,D.C.: Government Printing Office, 2006, 182 p.
LOHMANN, G. P. A model for variation in the chemistry of planktonic foraminifera due to secondary calcification and selective dissolution. Paleoceanography, v. 10, n. 3, p. 445-457, 1995.
LOWEMARK, L.; HONG, W.; YUI, T.; HUNG, G. A test of different factors influencing the isotopic signal of planktonic foraminifera in surface sediments from the South China Sea. Mar. Micropaleontol., v. 55, p. 49-62, 2005.
MARTINSON, D.G., PISIAS, N.G., HAYS, J.D., IMBRIE, J., T. C. MOORE, J. E SHACKLETON, N.J. Age Dating and the Orbital Theory of the Ice Ages: Development of a High-Resolution 0 to 300,000-Year Chronostratigraphy. Quat. Res., v. 27, p. 1-29, 1987. MULITZA, S.; DURKOOP, A.; HALE, W.; WEFER, G.;
MULITZA, S.; DONNER, B.; FISCHER, G.; PAUL, A.; PATZOLD, J.; RUHLEMANN, C.; SEGL, M. The South Atlantic oxygen isotope record of planktonic foraminifera. In: WEFER, G., MULITZA, S. RATMEYER, V (Ed.). The South Atlantic in the Late Quaternary: Reconstruction of Material budgets and current systems. Berlin: Springer-Verlag, 2003. p. 121-142.
NIEBLER, H. S.; HUBBERTEN, H. W.; GERSONDE, R. Oxygen isotope values of planktic foraminifera: a tool for the reconstruction of surface water stratification. In: FISHER, G.; WEFER, G. (Ed.). Use of proxies in Paleoceanography: Examples from the South Atlantic. Springer-Verlag Berlin Heidelberg, 1999, p. 165-189. OPPO, D. W.; FARIBANKS, R. G. Carbon isotope
composition of tropical surface water during the past 22,000 years. Paleoceanography, v. 4, n. 4, p. 333-351, 1989.
RAVELO, A. C.; FAIRBANKS, R. G. Oxygen isotopic composition of multiple species of planktonic foraminifera: recorders of the modern photic zone temperature gradient. Paleoceanography, v. 7, n. 6, p. 815-831, 1992.
RAVELO, A. C.; FAIRBANKS, R. G. Carbon isotopic fractionation in multiple species of planktonic foraminifera from core-tops in the Tropical Atlantic. J. Foramin. Res., v. 25, n. 1, p. 53-74, 1995.
ROHLING, E. J.; COOKE, S. Stable oxygen and carbon isotopes in foraminiferal carbonate shells. In: BARUN, K. SEN GUPTA (Ed.). Modern foraminifera. Kluwer Academic Publishers, Printed in Great Britain. 1999, p. 239-258.
ROMANEK, C. S.; GROSSMAN, E. L.; MORSE, J. W. Carbon isotopic fractionation in synthetic aragonite and calcite: effects of temperature and precipitation rate. Geochim. Cosmochim. Acta, v. 56, p. 419-430, 1992. SHACKLETON, N. Attainment of isotopic equilibrium
between ocean water and the benthonic foraminifera genus Uvigerina: Isotopic changes in the ocean during the last glacial: Colloques Internationaux Du C.N.R.S., v.219, p. 203-209, 1974
SILVEIRA, I, C; SCHMIDT, A. C. K; CAMPOS, E. J.; GODOI, S. S.; IKEDA, Y. A corrente do Brasil ao largo da Costa Leste Brasileira. Rev. Bras. Oceanogr., v. 48, n. 2, p. 171-183, 2000.
SPERO, H. J.; BIJMA, J.; LEA, D. W.; BEMIS, B. E. Effect ion seawater carbonate concentration on the foraminiferal carbon and oxygen isotopes. Nature, v. 390, p. 497-500, 1997.
SPERO, H. J.; LEA, D. W. Intraspecific stable isotope variability in the planktic foraminifera Globigerinoides sacculifer: Results from laboratory experiments. Mar. Micropaleontol., v. 22, p. 221-234, 1993.
TOLEDO, F. A. L.; COSTA, K. B.; CAMILLO Jr., E.; QUADROS, J. P. Inferências sobre taxas de Sedimentação através do estudo de isótopos de oxigênio em Foraminíferos Bentônicos. In: CONGRESSO DA ASSOCIAÇÃO BRASILEIRA DE ESTUDOS DO QUATERNÁRIO, X, Guarapari - ES. Boletim de Resumos Expandidos. ABEQUA, X, v. 1, p. 72-77, 2005.
TOLEDO, F. A. L.; CACHÃO, M.; COSTA, K. B.; PIVEL, M. A. G. Planktonic foraminifera, calcareous nannoplankton and ascidian variations during the last 25 kyr in the Southwestern Atlantic: A paleoproductivity signature? Mar. Micropaleont., v. 64, p. 67-79, 2007. TOMCZAK, M.; GODFREY, J. Regional oceanography:
an introduction.New York: Elsevier, 1994. 422 p. UNDERWOOD, A. J. Experiments in ecology - Their
logical design and interpretation using analysis of variance. Cambridge: Cambridge University Press, 1997. VAN MORKHOVEN, F. P. C. M.; BERGGREN, W. A.; EDWARDS, A. S. Cenozoic cosmopolitan deep-water benthic foraminifera. Oertli, H. J (Ed.). Elf Aquitaine, Pau. Bull. Cent. Rech. Explor.-Prod., Mem. n. 11. 1986.
WAELBROECK, C.; MULITZA, S.; SPERO, H.; DOKKEN, T.; KIEFER, T.; CORTIJO, E. A global compilation of late Holocene planktonic foraminiferal δ18O: relationship
between surface water temperature and δ18O. Quat. Sci.
Rev., v. 24, p. 853-868, 2005.
WEFER, G.; BERGER, W. H.; BIJMA, J.: FISCHER, G. Clues to Ocean History: a Brief Overview of Proxies. In: FISCHER, G. WEFER, G (Ed.). Use of Proxies in
Paleoceanography: Examples from the South Atlantic.
Berlin: Springer-Verlag, 1999. p. 1-68.
WILLIAMS, D. F.; BE, A. W. H.; FAIRBANKS, R. G. Seasonal stable isotopic variations in living foraminifera from Bermuda plankton tows. Palaeogeogr. Palaeoclimatol. Palaeoecol., v. 33, p. 71-102, 1981. WOLF-GLADROW, D. A.; BIJMA, J.; ZEEBE, R. E. Model
simulation of the carbonate chemistry in the microenvironment of symbiont bearing foraminifera. Mar. Chem., v. 64, p. 181-198, 1999.
ZEEBE, R. E.; BIJMA, J.; WOLF-GLADROW, D. A. A diffusion-reaction model of carbon isotope fractionation in foraminifera. Mar. Chem., v. 64, p. 199-227, 1999.