THE DYNAMICS OF FLUORESCENT DISSOLVED ORGANIC MATTER IN THE
PARANAGUÁ ESTUARINE SYSTEM, SOUTHERN BRAZIL
Paloma Kachel Gusso-Choueri1,2*, Rodrigo Brasil Choueri2,3, Ana Teresa Lombardi4 and Eunice C. Machado5
1Universidade Federal do Paraná
Programa de Pós-Graduação em Ecologia e Conservação, Setor de Ciências Biológicas (Curitiba - PR - Brasil, 81531-980)
2Universidade Santa Cecília - Departamento de Ecotoxicologia
(Rua Oswaldo Cruz, 266, 11045-907 Santos, SP, Brasil)
3Universidade Federal de São Paulo - Campus Baixada Santista
(Avenida Ana Costa, 178, 11060-000 Santos, SP, Brasil)
4Universidade Federal de São Carlos - Departamento de Botânica
(Rodovia Washington Luis, km 235, 13565-905 São Carlos, SP, Brasil)
5Universidade Federal do Paraná - Centro de Estudos do Mar
(Avenida Beira Mar, s/n, 83255-971 Pontal do Paraná, PR, Brasil) *Corresponding author: [email protected]
A
B S T R A C TThe aim of this study was to investigate the dynamics of the fluorescent dissolved organic matter (FDOM) in Paranaguá Estuarine System (PES) as to infer about the contribution of allochthonous FDOM to the estuarine waters in relation to tidal condition and seasons. Fluorescence spectroscopy was used for such purpose and DOM characterization through fluorescence emission was performed using excitation wavelengths of λex 350 nm and λex 450 nm, the two main fluorescence groups known to be present in natural DOM. Relations between emission wavelength (λem) and environmental variables, and the relevance of these variables to the different tides and seasons were identified by principal component analysis. The results showed that the first class of fluorophores (λex 350 nm) changed from the river (freshwater) towards the estuary, whilst the second class (λex 450 nm) has a more conservative nature and does not change as significantly as the first. Allochthonous DOM contribution to the estuarine system is intensified during the rainy season, especially in spring tides, whereas in the dry season the ratio of autochthonous DOM to total DOM in PES waters increased. We concluded that the variation of maximum
λem of the first class of fluorophores (λex 350 nm) is mainly related to allochthonous contribution, whilst the maximum of emission for the second class of fluorophores (λex 450 nm) is dependent on the contribution of the different sources of organic matter (freshwater and marine water DOM contribution).
R
E S U M OO objetivo deste estudo foi investigar a dinâmica da matéria orgânica fluorescente (FMOD) no Complexo Estuarino de Paranaguá (CEP) para inferir sobre a contribuição da FMOD alóctone nas águas estuarinas em relação à condição de maré e estações do ano (seca e chuvosa). Empregou-se a técnica de espectroscopia de fluorescência, através da utilização de dois comprimentos de onda de excitação, os quais correspondem a duas classes conhecidas de fluoróforos, λex 350 nm e λex 450 nm, para desta forma determinar o
comprimento de onda de máxima emissão (λem) da fluorescência da MOD. Relações entre λem e variáveis
ambientais e a relevância das relações nas diferentes condições de maré (sizígia e quadratura) e estações do ano (seca e chuvosa) foram identificadas com o uso de análise de componentes principais. Os resultados demonstraram que a primeira classe de fluoróforos (λex 350 nm) foi alterada durante a transição rio - estuário, enquanto a segunda classe (λex 450 nm) apresentou um comportamento mais conservativo. A contribuição da MOD alóctone no estuário foi intensificada durante a estação chuvosa, especialmente durante as marés de sizígia, enquanto na estação seca a MOD autóctone é preponderante na composição da MOD total no CEP. Conclui-se que a variação nos λem da primeira classe de fluoróforos (λex 350 nm) é principalmente relacionada à contribuição alóctone, enquanto as diferenças nos λem da segunda classe (λex 450 nm) estão relacionadas com as flutuações nas contribuições das diferentes fontes de MOD no CEP. Descriptors: Humic substances, Estuaries, FDOM’s source, Tidal cycle, Estuarine turbidity maximum, Fluorescence spectroscopy.
Descritores: Substâncias húmicas, Estuários, Fonte de FMOD, Ciclos de maré, Máximo de turbidez estuarina, Espectroscopia de fluorescência.
I
NTRODUCTION
In estuaries the interactions between freshwater, saltwater, terrestrial and atmospheric systems occur with considerable intensity. They are dynamic ecosystems that respond to environmental forces with different time scales, such as semi-diurnal tides, spring and neap tides (fortnightly), riverine input variation (seasonal), and others. In addition, estuaries are among the most productive ecosystems known (UNDERWOOD; KROMKAMP, 1999) and great part of their production is supported by the terrestrial contribution of nutrients and organic materials such as humic substances.
Terrestrial humic substances are a major source of the fluorescent dissolved organic matter (FDOM) in estuarine waters (COBLE et al., 1998). This is the optically active portion of dissolved organic matter (DOM), being historically referred to as Gelbstoff or yellow substances. Besides the DOM of terrestrial origin, other contributions to the bulk of coastal and estuarine DOM are those from autochthonous sources, e.g. the DOM produced in situ by the biota (ROCHELLE-NEWALL; FISHER, 2002; MAYER et al., 1999), and also by processes such as the UV-induced polymerization of sugars, amino acids and other small molecules (HARVEY et al., 1983). The characterization of DOM in estuaries is important for the understanding of its role in the functioning of the ecosystem (BENNER, 2002) since DOM dynamics interfere greatly in the carbon cycle. The DOM composition can affect, for example, microbial and plankton ecology (WILLIAMSON et al., 2001; CHOUERI et al., 2007), mobility of organic and inorganic contaminants (SANTOS et al., 2008), speciation and bioavailability of metals (NOGUEIRA et al., 2009; CHOUERI et al., 2009), toxicity of pollutants such as polycyclic aromatic hydrocarbons (DIAMOND et al., 2000), remineralization of nutrients, surface properties of minerals and carbon budget (HEDGES et al., 2002, and references therein). Different approaches are used to characterize FDOM in aquatic environments and many of them exploit its optical properties, i.e. light absorption and fluorescence emission. Because fluorescence can reveal important information about the FDOM’s composition and biogeochemical cycling (BURDIGE et al., 2004), different approaches have been developed within the technique to study DOM fluorescence, such as Fluorescence Excitation and Emission Spectra, Fluorescence/Absorption Relation, Excitation-Emission Matrix Spectra, Synchronous Spectra, Fluorescence Quantum Yield (BLOUGH; DEL VECCHIO, 2002; COBLE, 2007).
Fluorescence Excitation and Emission Spectra has been largely used for the purpose of tracing the origin of the DOM in continental, estuarine
and coastal ecosystems (DE- SOUZA-SIERRA et al., 1994, 1997; COBLE, 1996; LOMBARDI; JARDIM, 1999; CLARK et al., 2002; STEDMON et al., 2003). Considering that FDOM is a heterogeneous mixture of aliphatic and aromatic polymers, the rationale of this technique is based upon the characteristic of FDOM’s components emitting fluorescence at different wavelength maxima (λem) when excited by specific
wavelengths (λex), depending on the nature and
complexity of the FDOM’s molecules.
Multivariate analysis methods have been used to aid in the interpretation of FDOM’s fluorescence data. The application of multivariate analyses, such as Principal Component Analysis (PCA) (e.g. PERSSON; WEDBORG, 2001; BOEHME et al., 2004) and more recently Parallel Factor Analysis (PARAFAC) (e.g. STEDMON et al., 2003; STEDMON;MARKAGER, 2005), has led to new insights into the sources and concentrations of groups of fluorophores within the bulk of the FDOM. However, such techniques have been applied exclusively to Excitation-Emission matrices (EEM) data. To date, the integration of FDOM data and environmental variables through multivariate analysis has not been applied. Such an approach can help in the study of the dynamics of FDOM in estuaries, source tracking, and the assessment of the potential influence of the environment on FDOM dynamics.
The Paranaguá Estuarine System (PES) is an important site in terms of environmental protection. Nevertheless, it has been affected by anthropogenic pressures, such as port activities, fisheries and agriculture. A detailed characterization of the DOM in PES waters is of ecological and geochemical interest considering that the sources and transformations of such material can be traced and, consequently, insights may be provided into the fate of these substances in the ecosystem.
phosphorous (total-P), nitrite (NO2-), nitrate (NO3-),
ammonium (NH4+), phosphate (PO43-) and silicate
(SiO32-) were assessed through the application of a
PCA. The associations between environmental variables, and the relevance of these associations for each season and tide, were also discussed in the light of the PCA. This is the first attempt to use fluorescence analysis as a tracer of the source, behavior, and transformations of FDOM in the Paranaguá Estuarine System; in addition, the application of multivariate analysis to integrate fluorescence and environmental data provided an ecological explanation for the FDOM results.
M
ATERIAL ANDM
ETHODSStudy Area
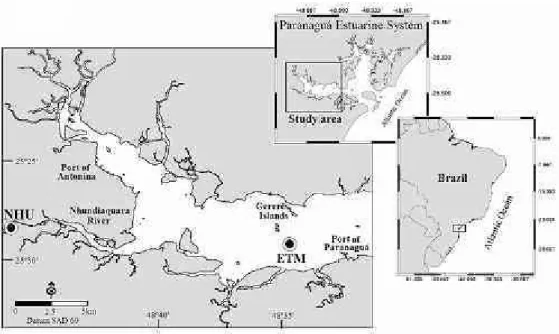
The Paranaguá Estuarine System (PES) is located at 25°16’ - 25°34’S and 48°17’ - 48°42’W (Brazil). This system is physically divided into 2 main bays: Paranaguá Bay (W-E direction) and Laranjeiras Bay (N-S direction), with a total area of 612 km2 (Fig.
1). The climate is humid subtropical (Cfa), with an average annual rainfall of 2500 mm in the drainage basin. Two well-defined seasons dominate: rainy summer and dry winter (KNOPPERS et al., 2004).
The drainage area of the PES is 3361 km2 and the
average annual freshwater discharge is 200 m3 s-1
(KNOPPERS et al., 2004). The PES encompasses different environments such as salt marshes, mangrove swamps, sandy beaches, coastal rocks, tidal channels, smaller estuaries formed by several streams and Atlantic rainforest. The site is part of the Cananéia-Iguape Estuarine-Lagoons System, an important area for environmental preservation that has been considered as part of the Ramsar’s list of international protection wetlands since 2000 (IBAMA, 2008). Sixteen protected areas have been established and approximately 19% of the Atlantic rainforest remnants, considered "Biosphere Reserve" by UNESCO, are situated in this region. Besides the ecological importance of the PES, its area also harbors important economic activities, being distinguished by the presence of the major grain exporting port in South America, that of Paranaguá. Other products potentially hazardous to the environment, such as fertilizers, petroleum derivatives and minerals, are handled at the port. Additional environmental pressures in the PES are the unplanned urban development bordering the estuary and the consequent increasing discharge of untreated sewage, uncontrolled urban landfills and agricultural activities.
Sampling
Estuarine water samples were collected within the extension of the estuarine turbidity maximum (ETM) of Paranaguá Bay (Fig. 1) during spring and neap tides of rainy (December 2005) and dry season (August 2006). The mean rainfall in the three-month period before sampling in the rainy and dry season was 201.7±103.9mm and 49.8±24.2mm, respectively (data provided by the technological institute Simepar). Despite the ETM displacement into the bay along the tidal cycle (MANTOVANELLI et al., 2004), a fixed sampling station (25º29.26’S; 48º35.37’W) was set up at a place at which the field collections in both rainy and dry seasons could be undertaken within the ETM zone. The ETM’s location was confirmed by in situ water turbidity measurements using an AP 2000 Policontrol turbidimeter. The depth at the sampling station varied between 6.8 and 7.0 m.
Surface and bottom waters were sampled with Niskin bottles every 2 hours over a period of 12 hours (a complete tidal cycle) during spring and neap tide events in both rainy and dry seasons. For D.O. analysis, glass bottles with glass stoppers were carefully filled to overflowing with water samples and immediately fixed to be later analyzed by Winkler’s method. All D.O. samples were kept at water temperature, 29 to 31 ºC in the rainy season and 21 ºC in the dry season. The samples were kept in the dark for no longer than 8 h after sampling. The samples for nutrient analysis were placed in high density polyethylene bottles, kept under ice and in the dark during fieldwork. Onshore, nutrient samples were immediately filtered through calcined glass-fiber filters (Schleicher & Schuell GF-52C) and kept at 4 ºC for no longer than 48 h.
To define a reference fluorescence emission wavelength (λem) for the allochthonous FDOM,
surface (0.33 to 0.48 m) freshwater samples (n=3) were collected in the Nhundiaquara River (point "NHU" in Figure 1, 25°25’40.6"S; 48°52’37.3"W), the main source of freshwater flowing into Paranaguá Bay. Sampling at the Nhundiaquara River was performed on one single occasion, since the λem
"fingerprint" of allochthonous FDOM is not expected to change significantly with season as compared to the difference in λem that is applicable to this study, i.e.
allowing for the distinction between continental and marine FDOM. The reference fluorescence (λem) value
for the autochthonous FDOM was obtained from samples with higher marine influence taken at the ETM with salinity 29-30 (n=16).
Analytical Methods
Salinity was measured in the field with a hand refractometer (Atago) and pH measurements were made with a Hanna pH meter. Dissolved
nutrients (total-N, total-P, NO2-, NO3-, NH4+, PO43-,
SiO3-2) were analyzed by colorimetric methods in
accordance with Grasshoff et al. (1983) after filtration of water samples as recommended by Head (1985) for particle-rich waters. Dissolved oxygen concentration was determined by Winkler’s method (GRASSHOFF et al., 1983), with an automatic Metrohm Dosimat titration unit with a precision of 0.01 ml. For total seston quantification, water samples were filtered through pre-weighed and calcined glass fiber filters (Schleicher & Schüll GF-52C); the retained material being dried and quantified using the gravimetric
method (STRICKLAND; PARSONS, 1972).
Chlorophyll a was quantified by filtering water samples through Schleicher & Schüll GF-52C filters, followed by acetone extraction and fluorescence measurements (STRICKLAND; PARSONS, 1972).
Fluorescence Spectroscopy
Samples were filtered through 0.22 µm membrane filters (Sartorius) and stored in sterile amber glass flasks. The filters were previously soaked in 1 M HNO3 for 24h to remove metallic elements that
could cause quantitative and qualitative alterations, such as quenching, in the fluorescence signal (LOMBARDI; JARDIM, 1999). The whole filtering procedure was performed in a sterile laminar flow cabinet and samples were kept in the dark at 4ºC until analysis. This sample conservation procedure resulted in no pH variation in the samples (determined before and after storage), confirming that no microbial or light degradation had occurred.
Fluorescence determinations were performed using a commercial spectrofluorometer (JASCO, model FP 6500, Japan) equipped with a 150W xenon lamp as the light source. The equipment includes internal configuration to automatically correct for intensity variation and spectral characteristics of the light source and those of the excitation monochromator. This is important to keep the output currents from the monitoring photomultiplier tubes constant even if there be variations in the light source. Additionally, all samples were analyzed in the same period, therefore preventing any possible long term variations in lamp intensity and instrument setup. All spectra were recorded with a 10 nm slit-width for the emission monochromator and 5 nm for the excitation monochromator. Scan velocity was adjusted to 200 nm min-1 for both monochromators. Instrumental error,
estimated as 0.16 %, was calculated by repeatedly measuring the fluorescence of a single sample and estimating the coefficient of variation of this series of data (n=10).
classes of fluorophores to characterize the FDOM in our samples: a first class of fluorophores, excitable within the range 310-390 nm, and a second class excitable within 410-470 nm. Within those ranges, a fixed excitation of 350 nm (λex 350 nm) was defined
empirically for the first class and 450 nm (λex 450 nm)
for the second class of fluorophores. All fluorescence emission spectra were recorded from 370 to 600 nm. Fluorescence intensity was recorded for both classes of fluorophores and reported in arbitrary units (A.U.). Raman peak corrections in the samples were made by subtracting the spectra obtained for the samples from those obtained for blank samples prepared with Milli-Q water. All fluorescence measurements were performed at 21±1ºC and samples were used with their natural pH that ranged within 6.0 - 7.5. According to Baker et al. (2007) such pH variation does not affect the fluorescence significantly, so pH was not adjusted and was kept as in the sampling. Self-shading effects were not expected since a quartz-cuvette of 1-cm lightpath was used, and the water samples were not concentrated prior to the fluorescence determinations.
Statistical Analysis Univariate Methods
The mean values of environmental variables and λem for both λex 350 nm and λex 450 nm recorded
for surface and bottom samples, in the spring and neap tides of dry and rainy seasons were tested for statistical differences. Firstly, the data series were tested for normality (Kolmogorov-Smirnov’s test) and homoscedasticity (Bartlett’s method). The statistical differences of mean values of each data series (n=6) which followed Analysis of Variance (ANOVA) assumptions were tested through ANOVA followed by post hoc Tukey test. Non-parametric statistical tests
(Kruskal-Wallis test, with Dunn’s multiple
comparisons as post-test) were used to compare data series that violated ANOVA assumptions. Differences between surface and bottom samples were analyzed only within the same tide and season, either through
ANOVA followed by Bonferroni’s multiple
comparisons test, or Kruskal-Wallis followed by Dunn’s multiple comparisons test.
Least squares linear regression analyses were undertaken to examine the relationships between salinity and the maximum λem and intensity at λex 350
nm and at λex 450 nm fluorophore classes. This
analysis helps in indentifying the variation of the fluorimetric characteristics of the DOM (λem and
intensity) in relation to the contribution of autochthonous and allochthonous sources. The significance of linear regressions was assessed through ANOVA F-test. For all the statistical tests, an α = 0.05
was considered.
Multivariate Analysis (Principal Component Analysis)
Principal Component Analysis (PCA) was used to highlight associations among the variables measured in this study. Basically, this technique establishes a new set of variables (principal components) that are linear combinations of the original variables, based on the correlation matrix of the original dataset. The new variables, although fewer in number, account for the inherent variation of the data to the maximum possible extent, clarifying the data relations with minimal loss of information. Associations between λem at λex 350 nm and λex 450
nm, chemical, and biological parameters (salinity, D.O., chlorophyll a, seston, total-N, total-P, NO2-,
NO3-, NH4+, PO43- and SiO32-) were sought. The
selected variables to be interpreted were those associated with the factors with a loading ≥ 0.45, as
recommended by Tabachnic and Fidell (1996). The relevance of the observed correlations to each case (each data record of neap and spring tide of rainy and dry season), i.e. the ’factor score’, was also quantified in the PCA. All the analyses were performed using the STATISTICA 8.0 software (StatSoft Inc., USA).
R
ESULTSMean values and standard deviation of the environmental variables analyzed in the ETM of the PES for a whole tidal cycle, in rainy and dry seasons, and spring and neap tides, as well as for those of Nhundiaquara River and samples with the highest marine influence (29 - 30 salinity) are shown in Table 1. No significant variation was obtained for most dissolved nutrients (PO4-3, NH4+, NO3-, SiO3-2),
chlorophyll-a, and total-N and total-P (ANOVA, p>0.05) between Nhundiaquara river samples and those under marine influence. A different tendency were obtained for salinity, seston, and NO2- that were
lower in the freshwater samples than in the marine samples (ANOVA, p<0.05), and D.O. that was higher in the lower than in the higher salinity samples (ANOVA, p<0.05).
Contrasting dry and rainy seasons, the results obtained for the environmental variables at the ETM showed a significant increase in dissolved NH4+,
NO2-, and NO3- in the dry season as compared with the
river values (ANOVA, p<0.05). In addition, the mean NH4+ concentration in the neap tide of the dry season
was also higher than that obtained for the marine sample (ANOVA, p<0.05). In the rainy season, ETM results for the environmental variables showed that salinity and the concentrations of nitrogen derived compounds (NO2, NO3-, total-N and, to a lesser extent,
NH4+) were lower than the marine values. Although
Fluorescence Measurements (λex 350 nm and λex 450 nm)
Mean results and standard deviations of the maximum λem and fluorescence intensity for both λex
350 nm and λex 450 nm obtained in the ETM over a
whole tidal cycle, both in rainy and dry seasons and spring and neap tides, are presented in Table 2, which also reports the fluorescence results for the allochthonous and autochthonous reference samples. The maximum λem for λex 350 nm and λex 450 nm
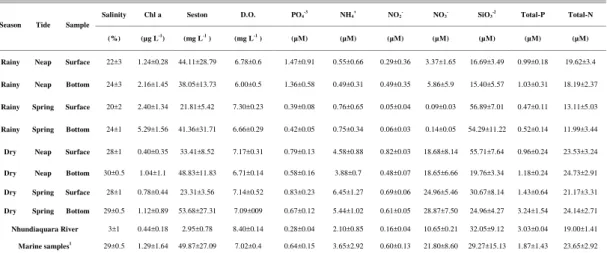
for surface and bottom samples in the spring and neap tides of the dry and rainy seasons are shown in Figure 2. The maximum λem of the first class of fluorophores
(λex 350 nm) for the Nhundiaquara river’s FDOM
(allochthonous FDOM reference) was different from that of the estuarine samples with the highest salinity (autochthonous FDOM reference) (Fig. 2a). Longer maximum λem was recorded for the allochthonous
FDOM (λem 448.4 ±0.5 nm) than for the
autochthonous FDOM (λem 441.9 ±1.5 nm)
(Kruskal-Wallis; p<0.05). However, for the second class of fluorophores (λex 450 nm), no difference for the
maximum λem was obtained when contrasting
allochthonous (516.2 ±1.8 nm) and autochthonous (516.0 ±3.7 nm) FDOM (Kruskal-Wallis; p>0.05) (Fig. 2b).
Table 1. Mean values and standard deviation of the environmental variables analyzed in the Estuarine Turbidity Maximum in the Paranaguá Estuarine System for a whole tidal cycle, in rainy and dry seasons, and spring and neap tides. These values are also presented for Nhundiaquara River and marine samples.
1 Samples collected in the ETM with higher marine influence (higher salinity)
Table 2. Mean results and standard deviations of λem and fluorescence intensity for both λex 350 nm and λex 450 nm in the
Estuarine Turbidity Maximum of Paranaguá Estuarine System for a whole tidal cycle, in rainy and dry seasons, and spring and neap tides. Mean results and standard deviations of λem and fluorescence intensity for allochthonous and autochthonous
references are also presented.
Salinity Chl a Seston D.O. PO4-3 NH4+ NO2- NO3- SiO3-2 Total-P Total-N Season Tide Sample
(%) (µg L-1 ) (mg L-1
) (mg L-1
) (µM) (µM) (µM) (µM) (µM) (µM) (µM)
Rainy Neap Surface 22±3 1.24±0.28 44.11±28.79 6.78±0.6 1.47±0.91 0.55±0.66 0.29±0.36 3.37±1.65 16.69±3.49 0.99±0.18 19.62±3.4
Rainy Neap Bottom 24±3 2.16±1.45 38.05±13.73 6.00±0.5 1.36±0.58 0.49±0.31 0.49±0.35 5.86±5.9 15.40±5.57 1.03±0.31 18.19±2.37
Rainy Spring Surface 20±2 2.40±1.34 21.81±5.42 7.30±0.23 0.39±0.08 0.76±0.65 0.05±0.04 0.09±0.03 56.89±7.01 0.47±0.11 13.11±5.03
Rainy Spring Bottom 24±1 5.29±1.56 41.36±31.71 6.66±0.29 0.42±0.05 0.75±0.34 0.06±0.03 0.14±0.05 54.29±11.22 0.52±0.14 11.99±3.44
Dry Neap Surface 28±1 0.40±0.35 33.41±8.52 7.17±0.31 0.79±0.13 4.58±0.88 0.82±0.03 18.68±8.14 55.71±7.64 0.96±0.24 23.53±3.24
Dry Neap Bottom 30±0.5 1.04±1.1 48.83±11.83 6.71±0.14 0.58±0.16 3.88±0.7 0.48±0.07 18.65±6.66 19.76±3.34 1.18±0.24 24.73±2.91
Dry Spring Surface 28±1 0.78±0.44 23.31±3.56 7.14±0.52 0.83±0.23 6.45±1.27 0.69±0.06 24.96±5.46 30.67±8.14 1.43±0.64 21.17±3.31
Dry Spring Bottom 29±0.5 1.12±0.89 53.68±27.31 7.09±009 0.67±0.12 5.44±1.02 0.61±0.05 28.87±7.50 24.96±4.27 3.24±1.54 24.14±2.71
Nhundiaquara River 3±1 0.44±0.18 2.95±0.78 8.40±0.14 0.28±0.04 2.10±0.85 0.16±0.04 10.65±0.21 32.05±9.12 3.03±0.04 19.00±1.41
Marine samples1 29±0.5 1.29±1.64 49.87±27.09 7.02±0.4 0.64±0.15 3.65±2.92 0.60±0.13 21.80±8.60 29.27±15.13 1.87±1.43 23.65±2.92
Season Tide Sample λem /λex350 λem /λex450 Intensity
λex350
Intensity
λex450
(nm) (nm) (A.U.) (A.U.)
Rainy Neap Surface 443.85±2.02 514.68±1.59 145.35±34.12 275.60±26.55
Rainy Neap Bottom 444.18±0.87 513.92±1.57 121.65±30.78 238.75±59.28
Rainy Spring Surface 445.48±031 514.28±0.69 103.25±8.1 275.17±24.64
Rainy Spring Bottom 445.92±0.46 513.88±1.32 96.62±3.71 257.50±7.08
Dry Neap Surface 443.53±1.37 517.03±3.04 53.83±13.12 139.77±13.11
Dry Neap Bottom 441.20/±1.54 513.27±4.14 85.62±15.97 220.05±26.39
Dry Spring Surface 441.85±2.10 519.97±4.31 77.98±24.5 186.00±35.23
Dry Spring Bottom 442.20±1.34 517.47±1.64 63.95±12.12 198.22±47.28
- - Allochthonous
reference 448.40±0.21 516.20±0.60 107.81±1.45 353.55±12.83
- - Autochthonous
Fig. 2. Variation of λem of surface and bottom samples, in the spring and neap tide of the dry
and rainy seasons, obtained by: (2a) λex of 350 nm and (2b) λex of 450 nm. Error bars represent
standard deviation (SD) of n = 6. Gray patterned stripes in the back represent the range of variation (mean ± SD) for allochthonous (light gray) and autochthonous (dark gray) λem
Considering the first class of fluorophores (λex 350 nm), the maximum λem for the ETM was
always shorter than the allochthonous reference FDOM. It was only during the spring tide of the rainy season that the ETM had longer maximum λem for both
surface and bottom waters (Kruskal-Wallis; p<0.05). In the dry season during neap and spring tides for surface and bottom waters, ETM maximum λem
fluorescence was similar to the autochthonous reference λem. In contrast, comparing ETM surface
waters within both tides and seasons, longer λem in the
rainy season as compared with those of the dry season in spring tides (ANOVA; p<0.05) were obtained. For ETM bottom waters, the spring tide of the rainy season showed significantly longer λem than any other
tide or season (ANOVA; p<0.05).
Regarding the second class of fluorophores (λex 450 nm), the maximum λem for allochthonous and
autochthonous FDOM were similar, even considering different tides and seasons. Samples of bottom water did not show any difference between tides or seasons (Kruskal-Wallis; p>0.05), whereas surface water showed significantly longer λem in the dry than in the
rainy season for the spring tides (Kruskal-Wallis, p<0.05). No statistical differences were found between surface and bottom samples, in the same tide and season, for either first or second-class fluorophores (ANOVA; p>0.05).
The fluorescence emission spectra for the first class of fluorophores of estuarine samples ranged from 47 A.U., occurring at λem = 439 nm, and
206 A.U. occurring at λem = 446 nm. For the second
class of fluorophores, the values ranged from the 127 A.U. obtained at λem = 511 nm and a maximum
intensity of 312 A.U. recorded at maximum λem =
516 nm.
Linear Correlations: Maximum λem vs. Salinity,
and Intensity vs. Salinity
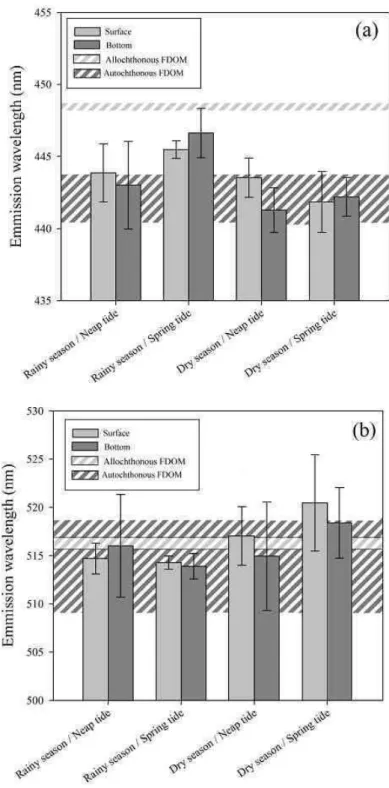
Figure 3 shows the plots of maximum λem
(λex 350 nm - Fig. 3a, and λex 450 nm - Fig. 3b) as a
function of salinity. The maximum λem of the first
class of fluorophores shows a negative and significant linear correlation (r=0.63; p<0.05) with salinity, whereas λem of the second class of fluorophores is
positively and significantly correlated with salinity (r=0.32; p<0.05).
The plots of fluorescence intensity (A.U.) at
λex 350 nm (Fig. 4a) and λex 450 nm (Fig. 4b) against
salinity are shown in Figure 4. For both classes of fluorophores, fluorescence intensity was negatively correlated with salinity (r=0.68 for λex 350 nm; r=0.75
for λex 450 nm; p<0.05 for both).
Principal Component Analysis
Within the scope of this study, the factors relevant for analysis are those in which the variables of wavelength of maximum fluorescence (λem) at λex 350 nm and/or λex 450 nm weighed
significantly. These were the first two factors of the PCA (F1 and F2) which together represented 54.5% of the total variance in the data matrix. The first factor (F1) accounted for 41.0% of the total variance in the dataset. The λex 350 nm and
chlorophyll a were negatively associated with F1 with significant loadings (higher than the pre-established loading cut-off), whereas another group of variables (λex 450 nm, salinity, total-P, total-N, NO2-, NO3-, and
NH4+) was positively associated with F1. The second
factor (F2) explained an additional 13.5% of the variance in the original dataset and grouped, with significant loadings, λex 450 nm, salinity, dissolved
oxygen, and SiO32-. Orthophosphate (PO43-) was
negatively associated with these variables with a significant loading.
Figure 5 shows the projection of variables (a) and cases (b) on the factorial plane, formed by factor 1 (horizontal axis) and factor 2 (vertical axis). In Figure 5a, the associations between variables detailed in the above paragraph can be distinguished. In Figure 5b, three groups of cases can be defined: one for spring tide/rainy season (white triangles and light gray diamonds) with a strong negative association with F1; a second group of cases for the dry season (neap and spring tide together - dark gray squares, dark gray triangles, black circles, and black diamonds) with a strong positive association with F1; and lastly, a group for neap tide/rainy season (white squares and light gray circles) negatively associated with F2, as well as a fairly negative association with F1.
The results of PCA confirmed the significant negative association between maximum λem of the
first class of fluorophores (λex 350 nm) and salinity.
Observation of Figure 5a and 5b allows the identification of associations between variables that are represented by vectors in Figure 5a, and cases, represented by points in Figure 5b. Thus Figure 5 shows that the rainy season has notably influenced both the λem of the first class of fluorophores and
chlorophyll a concentration towards higher values, since the vectors for these variables (Fig. 5a) are pointing in the same direction as the rainy season points are placed in the factor space F1 x F2 (Fig. 5b). Conversely, the vectors for salinity and some dissolved nutrients (total-P, total-N, NO2-, NO3-,
NH4+) are pointing in the opposite direction to the
rainy season points, which implies that these variables presented lower values in this season.
Figs 3a and 3b. Wavelength of maximum emission fluorescence (λem) for λex 350 nm (3a)
and λex 450 nm (3b) plotted against salinity. The fit line represents the least squares linear
Figs 4a and 4b. Data of fluorescence intensity at λex 350 nm (4a) and λex 450 nm (4b) plotted
against salinity. The fit line represents the least squares linear regression.
D
ISCUSSION
In general, the results for the environmental variables showed little variation between freshwater and marine samples, as confirmed by the analysis of variance. This suggests that the input of dissolved nutrients from the Nhundiaquara River into the estuary can be significant. However, our results also suggest that the Nhundiaquara River is not the main source of seston to the ETM. The low concentration of seston in the river may be related to the location of its source and great part of its course, which flows through areas of rocky outcrops (BIGARELLA et al., 1978) with high resistance to erosion (LICHT et al., 1997). Since approximately 70% of the coastal watershed of the
State of Paraná flows into the PES
(MANTOVANELLI, 1999), other rivers are probably more important sources of particulate matter for the ETM of the PES than the Nhundiaquara River. The analysis of variance also revealed a seasonality of some environmental variables, among them salinity (lower in the rainy season) and some dissolved nutrients (NH4+, NO2-, and NO3-) (increased in the dry
season and decreased in the rainy season); this pattern will be further discussed in the light of the results of the PCA.
The results of maximum λem obtained in this
study are in accordance with those of the literature for both the first (λex 350 nm) and second classes of
fluorophores (λex 450 nm) (DE- SOUZA-SIERRA et
al., 1994; COBLE, 1996; LOMBARDI; JARDIM, 1999; BLOUGH; DEL VECCHIO, 2002). In agreement with the data given in the literature, our results showed that the fluorescence emission maximum is dependent on the excitation wavelength, which is the result of multiple fluorophores, jointly referred to as classes of fluorophores (DE-SOUZA- SIERRA et al., 1994; LOMBARDI; JARDIM, 1999). In agreement with the findings of Coble (1990), who noticed a red shift in the emission maximum as the excitation wavelength was increased, our results showed that the second class of fluorophores is red-shifted (longer λem) compared with the first class.
The excitation wavelength from 320 to 360 nm is commonly used to register the fluorescence spectra of natural waters and to identify peaks related to humic-like substances (COBLE, 1996). Using λex
350 nm, so defining the first class of fluorophores, we obtained maximum λem ranging from 437 to 448 nm,
which is within the range for fluorescence emission maxima obtained in several investigations that focused on various natural water samples (fresh, estuarine, and marine). Several authors have reported fluorescence emission maxima ranging from 420 to 480 nm (DE- SOUZA-SIERRA et al., 1994; LOMBARDI; JARDIM, 1999; BAKER; SPENCER, 2004; LUCIANI et al., 2008).
The second class of fluorophores (λex 450
nm) has previously been described by Lombardi and Jardim (1999) who studied the fluorescence of marine and terrestrial organic materials and found λex/λem of
450/522 and 450/524 nm, respectively. Also, Hemmingsen and McGown (1997) reported a λem of
520 nm for commercial humic acids excited at 460 nm. Thus the present results of λem ranging from 510
to 527 nm are in agreement with the data previously given in the literature.
The general pattern of continental DOM fluorescence emission at longer wavelengths as compared with marine DOM fluorescence for the first class of fluorophores obtained in the present study is in accordance with other results given in the literature. Donard et al. (1989) studied the fluorescence emission of DOM from the Mediterranean Sea and obtained longer λem for coastal as compared with marine
samples when λex 313 nm was used. Also studying the
fluorescence of marine DOM obtained from the Mediterranean Sea, Lombardi and Jardim (1999) reported shorter λem for marine DOM (λem 437 nm)
than for a soil fulvic acid (λem 452 nm) when fixed λex
350 nm was used. Note that λex 350 nm is the same as
that used in the present study and we obtained λem 442
nm for the estuarine samples. De-Souza-Sierra et al. (1994) showed variations in the fluorescent properties of marine DOM, including progressive shifts of up to 40 nm towards longer wavelengths as seawater mixed with river waters. In addition, Coble (1996) and Del-Castillo et al. (1999), using the excitation-emission matrix spectroscopy technique, reported shorter λem
towards higher salinity at λex 330 to 350 nm.
The FDOM’s blue shift (shorter λem) towards
higher salinity for the λex 350 nm that is observed in
Figure 2(a) (i.e. the difference between autochthonous and allochthonous FDOM) of the present study supports the negative linear correlation between
λem/λex350 nm and salinity. This difference in λem
between allochthonous and autochthonous FDOM can be attributed to differences in molecular mass and aromaticity of the FDOM present in the two different environments. According to Baker and Spencer (2004), the more red-shifted is the peak, the higher the molecular mass and aromaticity of the FDOM; conversely, the more blue-shifted it is, the lower the molecular mass and aromaticity of the FDOM.
fluorescence efficiency (MOPPER et al., 1991; ZIEGLER; BENNER, 2000). According to data given in the literature, processes such as microbial activity (BOYD; OSBURN, 2004), photodegradation (COBLE et al., 1998), and autochthonous production of organic material (RAYMOND; BAUER, 2001) can account for the blue-shifted characteristic of FDOM in estuarine and marine waters compared with terrestrial FDOM. In addition, particular characteristics of ETM can boost some of these processes. Boyd and Osburn (2004) observed that allochthonous DOM was preferentially biodegraded over autochthonous DOM resulting in a wavelength shift. These authors hypothesized that this could be the result of conformational changes taking place in allochthonous DOM while it is subjected to different ionic strength from freshwater to estuarine waters. Furthermore, the authors propose that this process may facilitate further microbial degradation of the allochthonous DOM. It has also been shown that the increasing salinity gradient from rivers to estuaries may increase DOM flocculation and particle settling, eventually removing selectively the DOM responsible for fluorescence at longer wavelengths from the water column (DE- SOUZA- SIERRA et al., 1997).
Another factor that can contribute to the shortening of λem of estuarine FDOM in relation to
continental FDOM is the input of marine FDOM in the ETM. Previous studies have shown that marine DOM molecules are typically less aromatic (BENNER, 1998; CHEN et al., 2003) compared to continental DOM, which is rich in tannins and lignins (STEDMON et al., 2003). In addition, marine humic like organic materials are less aromatic, have lower C/N ratios and lower levels of conjugated chromatophores, contain more carboxylic groups and sugars than do terrestrial organic materials. These characteristics are consistent with observations that marine humics have a blue-shifted fluorescence relative to terrestrial humics (COBLE, 2007). As discussed above, in this present study it was also observed that in water samples with higher salinities FDOM’s λem is shorter than that of river samples for
the first-class fluorophores.
In relation to the second class of fluorophores (λex 450 nm), the similarity we obtained
for the reference values of FDOM from freshwater and estuarine waters is in agreement with other data given in then literature (DE- SOUZA-SIERRA et al., 1994; LOMBARDI; JARDIM, 1999). According to Clark et al. (2002), although there are differences between riverine FDOM and marine FDOM, some of the fluorophores are similar. Boyd and Osburn (2004) stated that the second class of fluorophores has more conservative characteristics during the mixing of fresh and estuarine waters. According to the authors this is due to a resistance of these substances to microbial
degradation. In the present study, the linear regression with positive slope between λex 450 nm (second class
of fluorophores) and salinity may be influenced by seasonal differences in the relative contribution of the sources of the second-class fluorophores rather than be related to a marine contribution, since λex 450 nm did
not vary between continental and marine sources of FDOM.
The intensity of DOM’s fluorescence at a certain wavelength is given by a number of different factors, including absorptivity and concentration. A linear relationship is expected between fluorescence intensity and organic carbon concentration (e.g. SMART et al., 1976; BURDIGE et al., 2004). Similarly to the present results (Figs 4a and 4b), it has been reported that in most estuarine waters, fluorescence intensity decreases linearly with salinity (DORSCH; BIDLEMAN, 1982; HAYASE et al., 1987; LAANE; KRAMER, 1990; DE-SOUZA- SIERRA et al., 1997). This linear variation has been assigned to conservative behavior on the part of the organic matter contained in freshwater upon its mixing with sea water (COBLE, 2007; BOWERS; BRETT, 2008).
The environmental interpretation based on the PCA analysis is that during the rainy season, the ETM zone of the PES presented lower salinity, higher
λem of FDOM (λex 350 nm, first-class fluorophores),
increased levels of chlorophyll a, and lower concentrations of nutrients. Higher λem at λex 350 nm
indicates that the FDOM detected during the rainy season in the ETM has higher complexity, i.e. it is mostly composed of allochthonous FDOM, with a lower contribution of marine FDOM. The low salinity observed confirms a higher contribution of freshwater during the rainy season. This is corroborated by the results of Mantovanelli (1999) who reported a freshwater contribution to the PES four times higher in rainy (182 m3 s-1) than in dry (41 m3 s-1) seasons.
Although the red-shifted characteristic of FDOM (λex 350 nm) in the ETM during the rainy
season was detected in both neap and spring tides, it was more clearly present in the spring tide. This may be due to the higher amplitude of spring tides, in which the estuarine waters reach continental areas and transport allochthonous organic matter more frequently and intensively than during neap tides, therefore contributing to an increase in the allochthonous FDOM in the estuary. This is supported by the results of Marone and Jamiyanaa (1997), who reported average tidal amplitudes of 1.4 m for neap tides and 1.7 m for spring tides as characteristic of the PES. Thus the 0.3 m difference is enough to wash out larger portions of the coastal areas.
inorganic nutrients were observed. This indicates enhanced primary production in the estuary at this time of the year, which is to be expected as the higher water temperature and solar radiation in the rainy season (summer) stimulate primary production. According to Coble et al. (1998) and Siegel and Michaels (1996), phytoplankton growth contributes to the pool of marine FDOM and, consequently, in situations of higher phytoplankton activity, FDOM emission would show a blue shift. However, an association has been detected between the red-shifted emission of the first class of fluorophores and the high phytoplankton activity of the rainy season. This leads to the reasoning - and reinforces it - that, during spring tides in the rainy season the allochthonous contribution is more significant than the autochthonous phytoplankton contribution to the pool of estuarine FDOM in the PES. In addition, previous studies have proposed that phytoplankton do not directly produce FDOM, it rather acts as a source of organic materials that are converted into FDOM
through processes mediated by bacteria
(ROCHELLE-NEWALL; FISHER, 2002; TRANVIK; BERTILSSON, 2001). Consequently, a time-lag between high phytoplankton activity and the production of typical marine FDOM can be expected.
The PCA also revealed that during the dry season (winter), in both spring and neap tides, salinity was higher and the wavelength of maximum emission for the FDOM at λex 350 nm was shorter, indicating a
reduced contribution of freshwater in the estuary, as well as a lower input of allochthonous FDOM. Consequently, a higher ratio of marine FDOM to the ETM of the Paranaguá Estuarine System was observed. In addition, Figure 5 shows inorganic nutrients as the principal components of the dry season samples; chlorophyll-a, also representative, is negatively correlated. The lower levels of chlorophyll-a chlorophyll-and the higher concentrchlorophyll-ations of inorgchlorophyll-anic nutrients indicate a reduction of primary production during the dry season - winter in the PES.
PCA applied to our data set showed that the fluorescence for second-class fluorophores (λex 450
nm) in the dry season occurred mainly at longer wavelengths than did that of the rainy season (Fig. 5). This indicates a red shift in the fluorescence of second-class fluorophores during the dry season in relation to that of the rainy season. Since the λex 450
nm of continental and estuarine sources are similar, as shown in this study and corroborated by previous ones (DE-SOUZA-SIERRA et al., 1994; LOMBARDI; JARDIM, 1999), the seasonal variation of λem of the
FDOM excitable at 450 nm may be due to an oscillation in the contribution of the different sources of organic matter in the PES over the year.
C
ONCLUSIONS
In the PES, the environmental variables showed little variation between the Nhundiaquara River and the ETM, suggesting that the input of dissolved nutrients from the river into the estuary may be significant. However, the seston in the ETM probably derives from sources other than the Nhundiaquara River.
Some environmental variables showed a seasonal pattern in the ETM of the PES, among them being salinity (lower in the rainy season) and some dissolved nutrients (NH4+, NO2-, and NO3-) (increased
in the dry season and decreased in the rainy season). An increase in the freshwater input leads to a red-shift in the first-class FDOM maxima λem in the ETM.
However, for the second-class of fluorophores, λem
was similar for both freshwater and estuarine environments, indicating that at least part of the Nhundiaquara’s riverine FDOM is similar to the estuarine fluorophores.
The seasonality observed in the hydrological processes in the PES modulates the FDOM composition and dynamics in the ETM. In the rainy season, the higher rainfall leads to an increase in the contribution of allochthonous first-class FDOM in the ETM, with a lower contribution of marine FDOM in this season. Consequently, the fluorescence of FDOM (λex 350 nm) is red-shifted in the rainy season in
relation to the dry season, as supported by the PCA. In contrast, in the dry season the input of allochthonous first-class FDOM into the ETM is diminished, following a reduction in the contribution of freshwater in the estuary, which results in the blue shift observed in the dry season.
The second-class FDOM also showed a seasonal variation in the maxima λem in the ETM of
the PES. This is related to seasonal changes in FDOM sources other than those related to the Nhundiaquara River and the sea, since λex 450 nm did not vary
between continental and estuarine sources of FDOM.
A
CKNOWLEDGEMENTS
writing of the report or in the decision to submit this paper for publication. All the authors have approved the final article.
R
EFERENCES
BAKER, A.; SPENCER, R. G. M. Characterization of dissolved organic matter from source to sea using fluorescence and absorbance spectroscopy. Sci. Tot. Environ., v. 33, p. 217- 232, 2004.
BAKER, A.; ELLIOTT, S., LEAD, J.R. Effects of filtration and pH perturbation on freshwater organic matter fluorescence. Chemosphere, v. 67, n. 10, p. 2035-2043, 2007.
BENNER, R. Cycling of dissolved organic matter in the ocean. In: HESSEN, D. O.; TRANVIK, L. J. (Ed.). Aquatic humic substances: ecology and biogeochemistry.
Ecol. Stud., v. 133, n. 12, p. 317-331, 1998.
BENNER, R., Chemical composition and reactivity, in HANSELL D. A.; CARLSON, C. A. (Ed.).
Biogeochemistry of marine dissolved organic matter. New York: Academic Press, 2002. p. 59-90. BIGARELLA J.J.; BECKER R.D.; MATOS D.J.; WERNER
A. A Serra do Mar e a porção oriental do Estado do Paraná. Curitiba: Secretaria de Estado do Planejamento, Governo do Paraná, 1978.
BLOOM, P. R.; LEENHEER. J. A. Vibrational, electronic, and high-energy spectroscopic methods for characterizing humic substances. In: HAYES, M. H. B.; MACCARTHY, P.; MALCOLM, R. L.; SWIFT, R. S. (Ed.). Humic substances: II. In search of structure. New York: John Wiley & Sons, 1989.
BLOUGH N. V.; DEL VECCHIO, R. Chromophoric DOM in the coastal environment. In: HANSELL D. A.; CARLSON, C. A. (Ed.). Biogeochemistry of marine dissolved organic matter. San Diego: Academic press, 2002. p 509-546.
BOEHME, J.; COBLE, P. G.; CONMY, R.; STOVALL-LEONARD, A. Examining CDOM fluorescence variability using principal component analysis: seasonal and regional modeling of three-dimensional fluorescence in the Gulf of Mexico. Mar. Chem., v. 89, p. 3-14, 2004. BOYD, T. J.; OSBURN, C. L. Changes in CDOM fluorescence from allochthonous and autochthonous sources during tidal mixing and bacterial degradation in two coastal estuaries. Mar. Chem. v. 89, p. 189-210, 2004.
BOWERS, D.; BRETT, H. L. The relationship between CDOM and salinity in estuaries: an analytical and graphical solution. J. mar. Sys., v. 73, p. 1-7, 2008. BURDIGE, D. J.; KLINE, S. W.; CHEN, H. Fluorescent
dissolved organic matter in marine sediment pore waters.
Mar. Chem., v. 89, n. 1-4, p. 289-311, 2004.
CHEN, J.; LEBOEUF, E. J.; DAI, S.; GU, B. Fluorescence spectroscopic studies of natural organic matter fractions.
Chemosphere, v. 50, p. 639-647, 2003.
CHOUERI, R. B.; MELÃO, M. G. G.; LOMBARDI, A. T.; VIEIRA, A. A. H. The effects of a cyanobacterium exopolysaccharides on the life-history of Ceriodaphnia
cornuta SARS. J. Plankt. Res., v. 29, p. 339-345, 2007.
CHOUERI, R. B.; GUSSO-CHOUERI, P. K.; MELÃO, M. G. G.; LOMBARDI, A. T.; VIEIRA, A. A. H. The influence of cyanobacterium exudates on copper uptake
and toxicity to a tropical freshwater cladoceran. J. Plankt. Res., v. 31, p. 1225-1233, 2009.
CLARK, C. D.; JIMENEZ-MORAIS, J.; JONES, G.; ZANARDI-LAMARDO, E.; MOORE, C. A.; ZIKA, R. G. A time-resolved fluorescence study of dissolved organic matter in a riverine to marine transition zone.
Mar. Chem., v. 78, p. 121-135, 2002.
COBLE, P. G. Characterization of marine and terrestrial DOM in seawater using excitation-emission spectroscopy. Mar. Chem., v. 51, p. 325-346, 1996. COBLE, P. G. Marine Optical Biogeochemistry - The
chemistry of ocean color. Chem. Rev., v. 107, p. 402-418, 2007
COBLE, P. G.; GREEN, S.A.; BLOUGH, N.V.; GAGOSIAN, R.B. Characterization of dissolved organic matter in the Black Sea by fluorescence spectroscopy.
Nature, v. 348, p. 432-35, 1990.
COBLE, P. G.; DEL CASTILLO, C. E.; AVRIL, B. Distribution and optical properties of CDOM in the Arabian Sea during the 1995 summer monsoon. Deep-Sea Res. II, v. 45, p. 2195-2223, 1998.
DE-SOUZA- SIERRA, M. M.; DONARD, O. F. X.; LAMOTTE, M.; BELIN, C.; EWALD, M. Fluorescence spectroscopy of coastal and marine waters. Mar. Chem., v. 47, p. 127-144, 1994.
DE-SOUZA-SIERRA, M. M.; DONARD, O. F. X.; LAMOTTE M. Spectral identification and behavior of dissolved organic fluorescent materials during estuarine mixing processes. Mar. Chem., v. 58, p. 51-58, 1997. DEL-CASTILLO, C. E.; COBLE, R. E.; MORELL, J. M.;
LOPEZ, J. M.; CORREDOR, J. E. Analysis of the optical properties of the Orinoco River plume by absorption and fluorescence spectroscopy. Mar. Chem.,
v. 66, p. 35-51, 1999.
DIAMOND, S. A.; MOUNT, D. R.; BURKHARD, L. P.; ANKLEY, G. T.; MAKYNEN, E. A.; LEONARD, E. N. Effect of irradiance spectra on the photo induced toxicity of three polycyclic aromatic hydrocarbons. Environ. Toxicol. Chem., v. 19, p. 1389-1396, 2000.
DONARD, O. R. X.; LAMOTTE, M.; BELIN, C.; EWALD, M. High-sensitivity fluorescence spectroscopy of Mediterranean waters using a conventional or a pulsed laser excitation source. Mar. Chem., v. 27, p. 117-136, 1989.
DORSCH, J. E.; BIDLEMAN, T. F. Natural organics as fluorescent tracers of river - sea mixing. Estuar. coast. Shelf Sci., v. 15, p. 701-707, 1982.
GRASSHOFF, K.; EHRHARDT, M.; KREMLING, K.
Methods of seawater analysis. Germany: Verlag Chemie, 1983.
HARVEY, G. B.; BORAN, D. A.; CHESAL, L. A.; TOKAR, J. M. The structure of marine fulvic and humic acids.
Mar. Chem., v. 12, p. 119-132, 1983.
HAYASE, K.; YAMAMOTO, M.; NAKAZAWA, I.; TSUBOTA, H. Behavior of natural fluorescence in Sagami Bay and Tokyo Bay Japan: vertical and lateral distribution. Mar. Chem., v. 20, p. 265-276, 1987. HEAD, P.C. Practical estuarine chemistry: A handbook.
Cambridge: University Press, 1985.
HEMMINGSEN, S. L.; MCGOWN, L. B. Phase-resolved fluorescence spectral and lifetime characterization of commercial humic substances. Appl. Spectrosc., v. 51, p. 921-929, 1997.
IBAMA. 2008. APACananéia-Iguape-Peruíbe. Available from www.ibama.gov.br/apacip. Accessed June 5th 2009.
KNOPPERS, B. A.; MACHADO, E. C.; BRANDINI, N.; SOUZA, W. F. L.; Sediment, oxygen and nutrient fluxes in three estuarine systems of SE Brazil. In: LACERDA, R.; SANTELLI, E.; DUURSMA, E.; ABRÃO, J. (Ed.).
Facets of environmental Geochemistry in tropical and subtropical environments. Berlin: Springer Verlag, 2004. p. 253-275.
LAANE, R. W. P. M.; KRAMER, K. J. M. Natural fluorescence in the North Sea and its major estuaries.
Neth. J. Sea Res., v. 26, p. 1-9, 1990.
LICHT, O.A.B.; PIEKARZ, G.F.; CALDASSO DA SILVA, J.C.; LOPES Jr.; I. Levantamento geoquímico multi-elementar de baixa densidade no estado do Paraná (Hidrogeoquímica - resultados preliminares). A Terra emrevista: Rev. Técn. informat. CPRM , n. 3, p.
34-46, 1997.
LOMBARDI, A. T.; JARDIM W. F. Fluorescence spectroscopy of high performance liquid chromatography fractionated marine and terrestrial organic materials.
Water Res., v. 33, p. 512-520, 1999.
LUCIANI, X.; MOUNIER, S.; PARAQUETTI, H. H. M.; REDON, R.; LUCAS, Y.; BOIS, A.; LACERDA, L. D.; RAYNAUD, M.; RIPERT, M. Tracing of dissolved organic matter from the Sepetiba Bay (Brazil) by PARAFAC analysis of total luminescence matrices.
Mar. environ. Res., v. 68, p. 148-157, 2008.
MANN, K.H. Ecology of coastal waters. Malden: Blackwell Science, 2000.
MANTOVANELLI, A. Caracterização da dinâmica hídrica e do material particulado em suspensão na Baía de Paranaguá e em sua bacia de drenagem.
1999. 152 p. Dissertação (Mestrado) - Universidade Federal do Paraná, Curitiba, Paraná, 1999.
MANTOVANELLI, A.; MARONE, E.; DA SILVA, E. T.; LAUTERT, L. F.; KLINGENFUSS, M. S.; PRATA JR, V. P.; NOERNBERG, M. A.; KNOPPERS, B.A.; ANGULO, J. Combined tidal velocity and duration asymmetries as a determinant of water transport and residual flow in Paranaguá Bay estuary. Estuar. coast.Shelf Sci., v. 59, p. 523-537, 2004.
MARONE, E.; JAMIYANAA, D. Tidal characteristics and a numerical model for the M2 tide at the Estuarine Complex of the Bay of Paranaguá, Paraná, Brazil.
Nerítica, v. 11, n. 1-2, p. 95-107, 1997.
MAYER, L. M.; SCHICK, L. L.; LODER, T. C. Dissolved protein fluorescence in two Maine estuaries. Mar. Chem., v. 64, p, 171-9, 1999.
MOPPER, K.; ZHOU, X.; KIEBER, R. J.; KIEBER, D. J.; SIKORSKI, R. J.; JONES, R. D. Photochemical degradation of dissolved organic carbon and its impact on the oceanic carbon cycle. Nature, v. 353, p. 60-62, 1991.
NOGUEIRA, P. F. M.; MELÃO, M. G. G.; LOMBARDI, A. T.; NOGUEIRA, M. M. Natural DOM Affects Copper speciation and bioavailability to Bacteria and Ciliate.
Archs environ.Contamin. Toxicol., v. 57, p. 274-281, 2009.
PERSSON, T.; WEDBORG, M. Multivariate evaluation of the fluorescence of aquatic organic matter. Anal. Chim. Acta, v. 434, p. 179-192, 2001.
RAYMOND, P. A.; BAUER, J. E. Riverine export of aged terrestrial organic matter to the North Atlantic Ocean.
Nature, v. 409, p. 497-500, 2001.
ROCHELLE-NEWALL, E. J.; FISHER, T. R. Chromophoric dissolved organic matter and dissolved organic carbon in Chesapeake Bay. Mar. Chem., v. 77, p. 23-41, 2002. SANTOS, M. A. P. F.; MELÃO, M. G. G.; LOMBARDI, A.
T. The effects of humic substances on copper toxicity to
Ceriodaphnia silvestrii Daday (Crustacea, Cladocera).
Ecotoxicology, v. 17, p. 449-454, 2008.
SIEGEL, D. A.; MICHAELS, A. F. Quantification of non-algal light attenuation in the Sargasso Sea: implications for biogeochemistry and remote sensing. Deep-Sea Res.,
v. 43, p. 321-345, 1996.
SMART, P. L.; FINLAYSON, B. L.; RYLANDS, W. D.; BALL, C. M. The relation of fluorescence to dissolved organic carbon in surface waters. Water Res., v. 10, p. 805-811, 1976.
STEDMON, C. A.; MARKAGER, S.; BRO, R. Tracing dissolved organic matter in aquatic environments using a new approach to fluorescence spectroscopy. Mar. Chem., v. 82, n. 3/4, p. 239-254, 2003.
STEDMON, C. A.; MARKAGER, S. Resolving the variability in dissolved organic matter fluorescence in a temperate estuary and its catchment using PARAFAC analysis.Limnol. Oceanogr., v. 50, p. 686-97, 2005. STRICKLAND, J. D. H.; PARSONS. T. R. A practical
handbook of sea-water analysis. J. Fish.Res. Bd Can.,
v.2, p. 167- 311, 1972.
TABACHNIC, B. G.; FIDELL, L. S. Using multivariate statistics. New York: Harper Collins College Publishers, 1996.
TRANVIK, L.; BERTILSSON, S. Contrasting effects of solar UV radiation on dissolved organic sources for bacterial growth. Ecol.Lett., v. 4, p. 458-463, 2001. UNDERWOOD, G. J. C.; KROMKAMP, J. Primary
production by phytoplankton and microphytobenthos in estuaries. Adv. Ecol. Res., v. 29, p. 3-153, 1999.
WILLIAMSON, C. E.; NEALE, P. J.; GRAD, G.; DE LANGE, H. J.; HARGREAVES, B. R. Beneficial and detrimental effects of UV on aquatic organisms: implications of spectral variation. J. appl. Ecol., v. 11, p. 1843-1857, 2001.
ZIEGLER S.; BENNER R. Effects of solar radiation on microbial production and dissolved organic matter cycling in a shallow, subtropical lagoon. Limnol. Oceanogr., v. 45, p. 257-266, 2000.
(Manuscript received 14 June 2010; revised 13 December 2010; accepted 23 May 2011)