• Nenhum resultado encontrado

Rev Bras Med Esporte vol.11 número4

N/A
N/A
Protected

Academic year: 2018

Share "Rev Bras Med Esporte vol.11 número4"

Copied!
4
0
0

Texto

(1)

Rev Bras M ed Esporte _ Vol. 11, Nº 4 – Jul/Ago, 2005

209e

1. Exercise Physiology Laboratory – M ogi das Cruzes University, SP.

2. Physical Education Post-Graduation Program, Catholic University of Bra-silia, DF.

3. Department of Physiological Sciences – São Carlos Federal University, SP.

Received in 5/1/05. 2nd version received in 28/4/05. Approved in 12/5/05.

Correspondence to: Dr. Herbert Gustavo Simões, Universidade Católica de Brasília, Programa de M estrado em Educação Física, Sala G 115, QS07, LT 01 S/N EPCT Águas Claras – 72030-170 – Taguatinga, DF. Voiced: (55 61) 3569330, fax: (55 61) 356 9350. E-mail: hsimoes@pos.ucb.br

Comparison betw een direct and indirect protocols of

aerobic fitness evaluation in physically active individuals

Luiz Gustavo da M atta Silva1, M ateus Elias Pacheco1, Carmen Sílvia Grubert Campbell1,2,

Vilmar Baldissera3 and Herbert Gustavo Simões1,2

O

RIGINAL

A

RTICLE

Key w ords: Individual anaerobic threshold. Individual glucose threshold. Critical

velocity. Vmax. Performance. ENGLISH VERSION

ABSTRACT

The individual anaerobic threshold (IAT), individual glucose thresh-old (IGT), critical velocity (CV), and the velocity associated to VO2max

(Vmax) and to 3,000 m running performance (Vm3km) have been used for the aerobic evaluation and exercise prescription in run-ners. How ever, a comparison of these variables and their useful-ness for physically active non-athlete individuals w ere not investi-gated yet. The objectives of this study w ere to compare and to verify the relationship betw eenVmax, Vm3km, CV, IAT and IGT in physically active non-athlete individuals. Eleven healthy and phys-ically active individuals (20.7 ± 1.8 yr., 74.2 ± 14.5 kg, 48.9 ± 5.8 mlO2.kg.min-1), randomly accomplished to the follow ing running

tests on different days: 1) 3,000 m performance for Vm3km; 2) an all-out 500 m running track and 3) an incremental treadmill test for IAT, IGT, VO2max and Vmax determination. The CV w as determined

by linear regression (distance-time relation) by using the 3,000 m and 500 m running tests. The running velocities corresponding to IAT, IGT, Vmax, Vm3km and CV w ere 184.8 ± 27.7; 182.8 ± 27.9; 211.1 ± 30; 213.4 ± 32.2 and 199.8 ± 30.4 m.min-1, respectively.

Despite the high correlation betw een the parameters studied, the CV overestimated the IAT and IGT (P < 0.001). How ever, no signif-icant differences w ere verified betw een Vmax and Vm3km (P > 0.05). We concluded that the Vm3km can be used for Vmax esti-mation and that CV identification on track may be useful for aero-bic evaluation as w ell as for delimiting the high to severe exercise intensity domains. How ever, the CV does not seem be a good es-timation of anaerobic threshold for physically active individuals.

INTRODUCTION

The aerobic evaluation is possible due to the determination of the maximum oxygen intake (VO2max) and the associated running velocity (Vmax)(1,2) as w ell as the anaerobic threshold identified

based on the responses of blood lactate (lac) and blood glucose (gluc)(3-7).

The Vmax is an intensity in w hich the VO2max may be reached and has been associated w ith the average velocity employed in 3,000 m running performance (Vm3km)(1,2). It has been evidenced

that the Vm3km presents high correlation w ith the velocity corre-sponding to the individual anaerobic threshold (IAT), being useful to predict the anaerobic threshold of track runners(6).

It has also been evidenced that the IAT protocol identifies the highest exercise intensity that can be maintained in lac(3) dynamic

steady state and that this protocol suffers no influence from small methodological variations such as the number and duration of stag-es and the type of w arm-up exercisstag-es previously performed(8).

Simões et al.(6) reported similarities betw een gluc and lac

re-sponses of runners during track incremental tests and proposed the identification of the individual glucose threshold (IGT), w hich intensity w as not different from IAT.

VO2max, Vmax, IAT and IGT have been used in the aerobic

as-sessment(1,6,7,9) and their identification depends on expensive

equip-ments (treadmills, equipequip-ments for ventilatory analysis and lactate and glucose analyzers) as w ell as on the participation of skilful pro-fessionals and the use of invasive techniques for blood collections. As alternative, easy-to-apply and non-invasive protocols have been proposed w ith emphasis for the application of mathematical mod-els that enable the identification of the critical velocity (CV) based on the distance-time relation in performance tests conducted in track running, sw imming and cycling(9-15).

CV is a parameter of aerobic fitness that has show n to be sensi-ble to the endurance training(16), w ith high correlation w ith the

anaer-obic threshold(15,17,18), being identified based on hyperbolic and

lin-ear m odels(10). M ost studies on the CV w ere conducted w ith

athletes(9,11-14) and as far as w e know, the literature lacks of studies

that investigate the relation betw een CV and other parameters of aerobic fitness in non-athlete individuals. The CV has been com-pared w ith the anaerobic threshold identified both by the steady concentration of 4 mmol.l-1 of lac(12) according to methodology

de-scribed by Heck et al.(19) as w ell as from techniques that consider

the individual behavior in relation to the lac(13) and ventilation(20)

re-sponse and it has been demonstrated that the CV may overesti-mate the anaerobic threshold intensity(13,14,20).

Despite previous studies have related the performance of mid-dle-distance runners w ith Vmax, CV and anaerobic threshold(9,10,20,21),

the parameters CV, Vmax, Vm3km, IAT and IGT have not yet been compared for non-athlete physically active individuals.

OBJECTIVES

To compare intensities associated to IAT, IGT, Vmax, CV and Vm3km and to analyze the possibility of using indirect tests in the assessment and prescription of exercise intensities for non-ath-lete physically active individuals.

M ETHODS

(2)

inform-210e

Rev Bras M ed Esporte _ Vol. 11, Nº 4 – Jul/Ago, 2005 ing about the procedures, risks and benefits resulting from their

participation.

Before being submitted to physical tests, the volunteers partic-ipated of a four-w eek adaptation program composed of tw o w eek-ly exercise sessions involving motor coordination, muscular stretch-ing, running at sub maximal velocity and some trials of the tests to be applied in the methodology of the present study. The trials in-cluded 500 m and 3,000 m cadenced running in order to provide apprenticeship on the execution of tests to be applied for the de-termination of CV.

At the end of the adaptation period, specific tests w ere per-formed, w hich w ere preceded of 15 minutes of w arm-up and mus-cular stretching exercises. Each participant w ere informed to hy-drate himself adequately and to ingest meals at least three hours before tests, besides avoiding the performance of exercises dur-ing the 48 hours before his participation.

w here: VVVVVOOOOO22 sub maximal222 : oxygen intake at sub maximal load. LoadLoadLoadLoadLoad sub

maximal: velocity at stage prior to the beginning of treadmill

inclina-tion increase during incremental test. CCCCC: oxygen cost

Statistical analysis

Data are expressed as average and standard deviation. The anal-ysis of variance ANOVA for repeated measures w ith post hoc Tukey-Kramer test w ere used in order to compare IAT, IGT, Vmax, VC and Vm3km velocities. The correlations betw een variables w ere deter-mined w ith the application of the Pearson correlation test. The sig-nificance level adopted w as of p < 0.05.

RESULTS

The determination of CV, IAT and IGT for all participants w as similar to that presented in figures 1 and 2. The average results of velocities corresponding to IAT, IGT, CV, Vmax and Vm3km are pre-sented in table 2.

TABLE 1

Characteristics of the individuals studied n = 11 Age Weight VVVVVO2max

(years) (kg) (mlO2.kg.min-1)

Average 20.7 74.2 48.9

± SD 01.8 14.5 05.8

Determination of Vm3km and CV

The Vm3km w as obtained through 3,000 m running performed in the shortest time as possible. The CV w as determined by means of linear model using the distance-time relation based on the per-formance in 3,000 m and 500 m running, w hich w ere measured in running track in different days. The linear regression straight line inclination defined the CV, as proposed by Hill(10) (figure 1).

Determination of IAT and IGT

According to methodology used by Simões et al.(6,7), the test

w as performed in treadmill (Johnson JET 7000, USA) at 1% incli-nation, initial velocity corresponding to 75% of the Vm3km and increments of 0.5 km.h-1 each three minutes w ith 1 min of interval

for the collection of 25 ml of capillary blood from the earlobe. The blood samples w ere transferred into Eppendorf tubes containing 50 ml of NaF 1% for gluc and lac dosages (YSI 2300 STAT plus – Ohio USA).

The heart rate (HR) w as controlled during the entire test (Polar Sport Tester, Finland). When volunteers reached 95% of the theo-retical maximal HR previously defined by the equation of Wilson & Tanaka(22) and/or w hen the exertion subjective perception

indicat-ed by volunteer reachindicat-ed 17 points in the scale proposindicat-ed by Borg(23),

the velocity w as maintained and only the treadmill inclination w as raised 1% each minute w ith no intervals up to voluntary exhaus-tion(7,24).

Blood samples w ere also collected each three minutes during 12 minutes of post-exercise recovery for the kinetic analysis of lac and IAT identification (Stegmann et al.)(3). The IGT w as identified as

the velocity corresponding to the moment in w hich the gluc pre-sented an increase during the test (figure 2).

Determination of VVVVVO2max and Vmax

The VO2max w as determined in the same incremental test ap-plied for the IAT and IGT identification. Ventilatory variables w ere measured during the 20 final seconds of each stage (VO2000 Aero-sport-M edgraphics) and the VO2 obtained at the end of the test (moment of voluntary exhaustion) w as considered as the VO2max. The running velocity associated to VO2max (Vmax) w as determined through method proposed by Di Prampero(25) as follow s:

Vmax = VO2max . C

-1 C = VO

2sub maximal . load sub maximal -1

1 2 3 4 5 6 7 8

196 204 212 220 228 236 244 244

1-5% inclin

3' 6' 9' 12'

velocidade de corrida (m.min-1

)

1 2 3 4 5 6

lactato glicose

IAT IGT

Fig. 2 – Incremental test in treadmill for the identification of IAT, IGT, VO2max and Vmax for a given individual (modified from Simões et al.(7)).

gluc

os

e (m

m

ol.l

-1)

lac

tat

e (m

m

ol.l

-1)

running velocity (m.min-1)

lactate glucose

The ANOVA show ed no differences statistically significant be-tw een Vmax and Vm3km as w ell as bebe-tw een IAT and IGT (table 2) and all parameters presented high correlations betw een each oth-er (table 3). CV, IAT and Vmax, despite highly correlated, w oth-ere dif-ferent from each other (P < 0.001), therefore reflecting difdif-ferent parameters.

0 500 1000 1500 2000 2500 3000 3500

0 100 200 300 400 500 600 700

inclinação (VC) "y-interception"

(AWC) VC=270,8 m.min-1

AWC=129,96 m

Fig. 1 – Determination of CV for a given participant through linear model (distance – time relation) based on 3,000 m and 500 m tests. The regres-sion straight line inclination defines the CV.

dis

tanc

e (m

)

time (s) Inclination (CV)

(3)

Rev Bras M ed Esporte _ Vol. 11, Nº 4 – Jul/Ago, 2005

211e

DISCUSSION

The high correlation observed betw een the variables studied suggests that, besides the use of direct tests (w ith measurements of lac, gluc and VO2), the aerobic fitness may also be assessed based on non-invasive indirect tests such as the CV and Vm3km determinations. In the present study, no differences betw een Vmax and Vm3km and betw een IAT and IGT w ere observed. On the oth-er hand, the CV w as low oth-er than Vmax and Vm3km and ovoth-eresti- overesti-mated the IAT and IGT in approximately 8.7% , suggesting that the CV should not be used as anaerobic threshold reference.

The similarity observed betw een results of Vmax and Vm3km is in agreement w ith results from other studies performed w ith run-ners(1,26,28). How ever, the contribution of the present study is that

these results could be also observed in non-athlete physically ac-tive individuals, suggesting that the use of running performance results such as the Vm3km is a low -cost practical method for Phys-ical Education professionals w ho w ant to assess their students/ clients and to prescribe individualized training programs.

The Vmax identification is very important and seems to be ef-fective in the evaluation and prescription of training intensities for long-distance runners(2). The effects of training on the Vmax/Vm3km

in non-athlete individuals needs further investigations. How ever, Smith et al.(2) observed significant evolution on VO

2max and on the

performance in middle-distance running (improvements on the Vm3km) in runners after training programs performed at the Vmax intensity.

In relation to the anaerobic threshold determination based on the lac and gluc responses, our results indicate that the IAT and IGT reflect the same parameter (table 2). A possible explanation for the increase on gluc after reaching the anaerobic threshold during incremental tests (figure 2) is that the adrenergic activity and the release of hormones associated to hyperglycemia – such as adren-aline, glucagon and cortisol – are increased at intensities above the anaerobic threshold(29), resulting in increased gluc and enabling the

IGT identification(6,7,29). The identification of a glycemic threshold

and the possibility of using this parameter in order to delimit inten-sity domains w ith prevalence of gluc uptake and production is rel-evant and needs to be better investigated. Studies on the IGT iden-tification and its application in diabetic individuals have been performed by our research group and w e have observed that in-tensities below IGT seem to be adequate to promote a better con-trol of the blood glucose content in individuals presenting hyperg-lycemia(30).

In relation to the CV, even w ith the use of only tw o predictive series for its identification (distances of 500 m and 3,000 m), the

results obtained are in agreement w ith other studies, suggesting that the CV is slightly higher than the anaerobic threshold and low -er than the Vmax(11,14,15,20,31). Thus, despite the validity of CV as an

aerobic fitness parameter has been investigated and discussed by many authors, our results emphasize that the IAT and CV identified different intensities and that the CV cannot be used as anaerobic threshold reference.

On the other hand, the CV presented high correlation w ith the other parameters, indicating that its determination in running track may be a low -cost, accessible and practical alternative to assess young and physically active individuals. M oreover, its identification has been proposed as a low -cost method that, besides assessing the aerobic fitness and predicting the performance in endurance events(20), allow s delimiting high to severe exercise intensity

do-mains(32). Gaesser and Poole(33) defined three exercise intensity

domains based on their different metabolic profiles as follow s: a) moderate, w hich corresponds to intensities low er than or equal to the “ anaerobic threshold” ; b) high intensity, w hich is greater than the anaerobic threshold but does not exceed the critical pow er or critical velocity; and c) the severe domain, w hich corresponds to intensities above the critical pow er or critical velocity.

At intensities corresponding to the “ critical pow er” or “ critical velocity” , the VO2 reaches a steady state. On the other hand, at intensities above the critical pow er (ex. 8-10% above the critical pow er), the VO2 may reach its maximum value (VO2max)

(34). Hill et

al.(32), in tests performed in cycle ergometer, observed that the

up-per limit of the severe intensity is an intensity above w hich the exhaustion w ould occur before the VO2max w as reached and re-ceived the denomination of extreme domain. These authors iden-tified that the upper limit of the severe domain and the low er limit of the extreme domain occurred at approximately 135% of the critical pow er, w hile the low er limit of the severe domain w as sim-ply above the critical pow er. Based on the findings of the present study, the CV identification allow s assessing the aerobic fitness and identifying the “ high” and “ severe” intensities domains, thus providing subsides for the selection of exercise intensities w ithin intensity domains of interest.

The Vmax and Vm3km corresponded to approximately 107% of the CV, in other w ords, intensities w ithin the severe domain that w ould allow reaching VO2max during exercises performed at this intensity. For the high intensity domain, intensities below CV (and above IAT) could be selected(2) and our results indicated that the

CV and the anaerobic threshold velocities (IAT and IGT) correspond-ed to 94 and 87% of the Vm3km (or Vmax), respectively, yet sug-gesting that intensities relative to Vm3km may be used to esti-mate and/or to prescribe exercises w ithin the intensity domains of interest (moderate, high or severe).

CONCLUSION

We conclude that the Vm3km and Vmax, as w ell as IAT and IGT reflect the same parameter, w hile the CV overestimates IAT and IGT and should not be used as anaerobic threshold reference. Fi-nally, w e suggest that the CV and Vmax (or Vm3km) may be useful in the characterization of the domain of interest in w hich the exer-cise is performed, thus allow ing its application in the training pre-scription.

ACKNOWLEDGM ENTS

To CNPq and to the M ogi das Cruzes University for the financial support through the Scientific Initiation Scholarship Program.

All the authors declared there is not any potential conflict of inter-ests regarding this article.

TABLE 2

Results of velocities (m.min-1) corresponding to the parameters studied

Vmax Vm3km CV IAT IGT (m.min-1) (m.min-1) (m.min-1) (m.min-1) (m.min-1)

Average 211.1 213.4 199.8♣ 184.8182.8

± SD 30, 032.2 030.4♣ 027.7027.9

♦: p < 0.001 in relation to Vmax, Vm3km and CV. ♣: p < 0.001 in relation to all parameters.

TABLE 3

Correlation betw een the parameters studied CV IAT Vmax IGT

Vm3km r = 0.99* r = 0.97* r = 0.92* r = 0.97*

CV – r = 0.97* r = 0.94* r = 0.98*

IAT – – r = 0.96* r = 0.99*

Vmax – – – r = 0.95*

(4)

212e

Rev Bras M ed Esporte _ Vol. 11, Nº 4 – Jul/Ago, 2005

REFERENCES

1. Hill DW, Row ell AL. Responses to exercise at the velocity associated w ith VO2max. M ed Sci Sports Exerc 1997;29:113-6.

2. Smith TP, M cNaughton LR, M arshall KJ. Effects of 4-w k training using Vmax/ Tmax on VO2max and performance in athletes. M ed Sci Sports Exerc 1999;31: 892-6.

3. Stegmann H, Kindermann W, Schnabel AF. Lactate kinetics and individual anaer-obic threshold. Int J Sports M ed 1981;2:160-5.

4. Coen B, Urhausen A, Aguilar L, Weilw r B, Kindermann W. Control of training in middle and long-distance running by means of the individual anaerobic thresh-old. Int J Sports M ed 1991;12:519-24.

5. Schuetz W, Traeger K, Anhaeupl T, Schanda S, Rager C, Vogt J, et al. Adjust-ment of metabolism, cathecolamines and b-adrenoreceptor to 90 min of cycle ergometry. Eur J Appl Physiol Occup Physiol 1995;70:81-7.

6. Simões HG, Campbell CSG, Kokobun E, Denadai BS, Baldissera V. Blood glu-cose responses in human mirror lactate responses for individual anaerobic thresh-old and for lactate minimum in track tests. Eur J Appl Physiol Occup Physiol 1999;80:34-40.

7. Simões HG, Campbell CSG, Katsanos C, Nakamura A, Kushinick M , Baldissera V, et al. Blood glucose threshold and the metabolic responses to incremental exercise tests w ith and w ithout prior lactic acidosis induction. Eur J Appl Physiol 2003;89:603-11.

8. Coen B, Urhausen A, Kindermann W. Individual anaerobic threshold: method-ological aspects of its assessment in running. Int J Sports M ed 2001;22:8-16.

9. Denadai BS, et al. Avaliação aeróbia: Determinação indireta da resposta do lac-tato sanguíneo. 1a ed. Rio Claro, SP: M otrix, 2000.

10. Hill DW. The critical pow er concept: a review. Sports M ed 1993;4:237-54.

11. Housh TJ, Devries HA, Housh DJ, Tichy M W, Smyth KD, Tishy AM . The relation-ship betw een critical pow er and the onset of blood lactate accumulation. J Sports M ed Phys Fitness 1991;31:31-6.

12. Kokubun E. Velocidade crítica como estimador do limiar anaeróbio em natação. Revista Paulista de Educação Física 1996;1:5-20.

13. M artin L, Whyte GP. Comparison of critical sw imming velocity and velocity at lactate threshold in elite triathletes. Int J Sports M ed 2000;21:366-8.

14. M cLellan TM , Cheung KSY. A comparative evaluation of the individual anaerobic threshold and the critical pow er. M ed Sci Sports Exerc 1992;24:543-50.

15. Wakayoshi K, Ikuta K, Yoshida T, Udo M , M oritani T, M utoh Y, et al. Determina-tion and validity of critical velocity as and index of sw imming performance in the competitive sw immer. Eur J Appl Physiol 1992a;64:153-7.

16. Jenkins DJ, Quigley BM . Endurance training enhances critical pow er. M ed Sci Sports Exerc 1992;24:1283-9.

17. Denadai BS, Greco CC, Donega M R. Comparação entre velocidade do limiar anaeróbio e a velocidade crítica em nadadores com idade entre 10 a 15 anos. Revista Paulista de Educação Física 1997;2:128-33.

18. Wakayoshi K, Yoshida M , Udo M , M oritani T, M utoh Y, M iyashita M . A simple method for determining critical speed as sw imming fatigue threshold in com-petitive sw imming. Int J Sports M ed 1992b;13:367-71.

19. Heck H, M ader A, Hess G, M ucke S, M uller R, Hollmann W. Justification of the 4 mmol/l lactate threshold. Int J Sports M ed 1985;6:117-30.

20. Kranenburg KJ, Smith DJ. Comparison of critical speed determined from track running and treadmill tests in elite runners. M ed Sci Sports Exerc 1996;28:614-8.

21. Campbell CSG. Regressão linear. In: Denadai BS, editores. Avaliação aeróbia: determinação indireta da resposta do lactato sanguíneo. 1a ed. Rio Claro, SP: M otrix, 2000.

22. Wilson TM , Tanaka H. M eta-analysis of the age-associated decline in maximal aerobic capacity in men: relation to training status. Am J Physiol Heart Circ Physiol 2000;278:829-34.

23. Borg GAV. Psychophysical bases of perceived exertion. M ed Sci Sports Exerc 1985;14:377-81.

24. Jones AM , Doust JH. The validity of the lactate minimum test for determination of the maximal lactate steady state. M ed Sci Sports Exerc 1998;30:1304-13. 25. Di Prampero PE. The energy cost of human locomotion on land and in w ater. Int

J Sports M ed 1996;5:55-72.

26. Grant S, Craig I, Wilson J, Aitchison T. The relationship betw een 3 km running performance and selected physiological variables. J Sports Sci 1997;15:403-10.

27. Daniels J, Scardina N, Hayes J, Foley P. Elite and subelite female middle- and long-distance runners. In: Sport and Elite Performers. D.M . Landers Champaign, IL: Human Kinetics, 1984;57-72.

28. Lacour JR, Padilla-M agunacelaya S, Barthélémy JC, Dormois D. The energetics of middle-distance running. Eur J Appl Physiol 1990;69:38-43.

29. Simões HG. Respostas hormonais e metabólicas durante os testes de determi-nação do limiar anaeróbio individual (IAT) e ponto de equilíbrio entre produção e remoção do lactato sanguíneo (LM ). Tese de Doutorado, Departamento de Ciên-cias Fisiológicas Universidade Federal de São Carlos-UFSCAR, São Carlos-SP, 2002.

30. Simões HG. Limiar glicêmico. In: Denadai BS, editores. Avaliação aeróbia: deter-minação indireta da resposta do lactato sanguíneo. 1a ed, Rio Claro, SP: M otrix, 2000.

31. Housh DJ, Housh TJ, Bauge SM . A methodological consideration for determina-tion of critical pow er and anaerobic w ork capacity. Res Q Exerc Sport 1990;61: 406-9.

32. Hill DW, Poole DC, Smith JC. The relationship betw een pow er and the time to achieve VO2max. M ed Sci Sports Exerc 2002;34:709-14.

33. Gaesser GA, Poole DC. The slow component of oxygen uptake kinetics in hu-man. Exerc Sport Sci Rev 1996;24:35-71.

Imagem

Fig. 1 – Determination of CV for a given participant through linear model (distance – time relation) based on 3,000 m and 500 m tests

Referências

Documentos relacionados

In the present study, no differences on the physical characteris- tics betw een prepubescent sw immer boys and girls w ere observed, according to results of the study of Damsgaard

One concludes that the use of indicatives of physical activity levels (PAL), total daily energy expenditure (TEE), activity energy expenditure (AEE) and basal energetic expenditure

An interesting finding of this study is that the muscular strength gain of men and w omen follow ed a similar order, in other w ords, arm curl &gt; bench press &gt; squat.

Although a significant w ater loss w as observed in female rugby players during almost-intense training (active dehydration), no sig- nificant alteration in the fat

ripheral markers of inflammation (cellular-1 soluble adhesion mole- cule, vascular cell-1 soluble molecule, chemoattractive protein for macrophages –1) after 12 w eeks of

Know ing the importance of a correct diagnosis w ith regard to body fat, once the adequate amount of body fat is vital for good health conditions, this study w as developed w ith

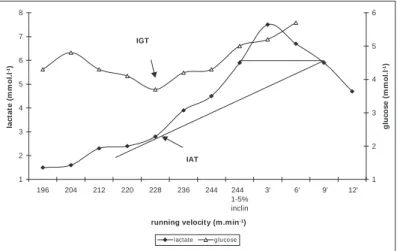
The main objective of this study w as to compare tw o different lactate threshold identification methods, one using a variable blood lactate concentration in order to respect

New studies should be conducted w ith the objective of elaborating independence measure instruments that could be used in the rehabilitation context of patients w ith spinal