Manuscript Draft
Manuscript Number: AQUA-D-07-00286
Title: MODELLING LOCAL FOOD DEPLETION EFFECTS IN MUSSEL RAFTS OF GALICIAN RIAS
Article Type: Research Paper
Keywords: Carrying capacity, mussel rafts, mathematical modelling
Corresponding Author: Dr. Pedro Duarte, Ph.D.
Corresponding Author's Institution:
First Author: Pedro M Duarte, Phd
Order of Authors: Pedro M Duarte, Phd; Uxio Labarta, Phd; Maria José Fernández-Reiriz , Phd
1
MODELLING LOCAL FOOD DEPLETION EFFECTS IN MUSSEL RAFTS OF 1
GALICIAN RIAS 2
3
4
Pedro Duarte1* 5
Uxio Labarta2 6
Maria José Fernández-Reiriz 2 7
8
1 University Fernando Pessoa. CEMAS, 349 Praça 9 de Abril, 4249-004 Porto, Portugal 9
Telephone: 351225071300 10
Fax: 351225508269 11
e-mail: pduarte@ufp.pt 12
*author for correspondence 13
14 2
Consejo Superior de Investigaciones Científicas. Instituto de Investigaciones Marinas, 15
17
Abstract 18
19
Mollusc culture is one of the most important types of mariculture, with suspension 20
feeding bivalves being among the most cultivated organisms. This is a passive type of 21
culture with bivalves feeding on phytoplankton and detritus. In the last years, there has 22
been a growing concern about carrying capacity (CC) of natural ecosystems for bivalve 23
culture, because of decreases in growth rates and mass mortalities due to overstocking. 24
CC may be evaluated at several spatial scales, ranging from the ecosystem scale to the 25
scale of the cultivation leases and limited by different processes. Several methods have 26
been proposed for CC estimation. The simplest are based on average properties 27
integrated over various time scales, like water renewal rate, phytoplankton primary 28
production and bivalve clearance rate. If the time scale of the former two processes is 29
larger than the time scale for bivalve filtration than, bivalve standing stock is over 30
ecosystem CC. More complex approaches are based on ecosystem box modelling or 31
coupled physical-biogeochemical models. The objective of this work is to evaluate CC 32
for mussel rafts in Galician Rias as a function of mussel loads and current velocities. 33
For this purpose an analytical model was developed and used to find conditions that 34
maximize raft production. Obtained results suggest that CC at the raft scale has not been 35
exceeded by current culture practices. However, it does not seem advisable to increase 36
mussel loads per raft. Therefore, any possible increase in mussel production should be 37
considered at a higher spatial scale. 38
39
Ke ywords: Carrying capacity, mussel rafts, mathematical modelling 40
Introduction 42
43
Carrying capacity (CC) for bivalve cultivation has been the subject of several research 44
projects, stimulated by declines of growth and survival rates in areas where bivalves are 45
abundant. CC estimates for different ecosystems that may be used to regulate 46
aquaculture practices, have been published (Bacher et al., 1998; Ferreira et al. 1998; 47
Duarte et al. 2003). In areas where aquaculture of molluscs is incipient, farmers need to 48
know the maximal densities that may be cultivated in order to obtain maximum 49
economic benefit (Héral, 1993). Overcrowded culture conditions may lead to an 50
increased incidence of shellfish diseases (Dijkema and van Stralen, 1989). Additionally, 51
environmental agencies could benefit with the knowledge of how to regulate bivalve 52
aquaculture in order to prevent ecological impacts. High culture biomass may result in a 53
negative impact on local environment through an increase on organic loading and 54
consequent increased oxygen demand beneath culture leases, phytoplankton biomass 55
reduction and increased nutrient turnovers (Prins et al., 1998; Smaal et al., 2001), 56
compromising the sustainability of culture environments. On the other hand, bivalve 57
growth may assist in eutrophication control through nitrogen and phosphorus removal 58
from the water column (Shpigel, 2005). 59
60
CC has been defined, with respect to bivalve culture, as the maximum standing stock 61
that may be kept within a particular ecosystem to maximize production without 62
negatively affecting growth rate (Carver and Mallet, 1990). Alternatively, and more 63
recently, CC has been described as the standing stock at which the annual production of 64
the marketable cohort is maximized (Bacher et al., 1998; Smaal et al. 1998), or the total 65
time, primary production time and bivalve clearance time (Dame and Prins, 1998). 67
These definitions are focused on target species, despite a growing tendency in Eastern 68
Countries for “ecological aquaculture” that is based on multi-species culture where 69
producers and consumers are grown together in order to facilitate nutrient recycling 70
(e.g. Fang et al., 1996; Grant, 1999). In this approach, the objective is not only to 71
maximize production, but also to optimize species combinations and distributions in 72
such a way as to reduce the environmental impacts of aquaculture. The growing 73
appreciation of multiple ecosystems’ services and the need for sustainable management 74
has lead ecologists to model the many interactions between and among species and 75
between species and their environment. A general definition of CC at the ecosystem 76
level could be “the level to which a process or variable may be changed within a 77
particular ecosystem, without driving its structure and function over certain acceptable 78
limits, established in terms of water quality and/or other parameters” (Duarte, 2003). 79
80
There are several examples where carrying capacities for bivalve cultivation have been 81
exceeded by non-sustainable practices. These include the bay of Marénnes-Óleron 82
(France), where oyster (Crassostrea gigas) growth has been significantly reduced with 83
increased stock densities over the years (Héral, 1993; Raillard and Ménesguen, 1994). 84
Similarly, mussel’s (Mytilus edulis) growth in the Oosterschelde estuary (Netherlands) 85
has been compromised by increased standing stocks (Smaal et al., 2001). 86
87
CC estimates depend on available data and knowledge on bivalve ecophysiology - a 88
field where there were considerable progresses over the last years. Generally, bivalve 89
growth is calculated using scope for growth (SFG). SFG depends on clearance, 90
computed as a function of food quantity and quality, temperature and physiologic 92
parameters. In the literature it is possible to find equations and parameters describing 93
the ecophysiology of several species - e.g. Barillé et al. (1997) and Ren and Ross (2001) 94
for oyster (C. gigas); Hawkins et al. (1998) for clam (Cerastoderma edule), oyster (C. 95
gigas) and mussel (Mytilus edulis); Scholten & Smaal (1998) for mussel (Mytilus 96
edulis); Hawkins et al. (1999) for green-lipped mussel (Perna canaliculus); Hawkins et 97
al. (2002) for scallop (Chlamys farreri); Navarro et al. (1991), Babarro et al. (2000), 98
Figueiras et al. (2002) and Fernandez-Reiriz et al. (2007) for mussel (Mytilus 99
galloprovincialis). 100
101
The problem of CC may be approached at several spatial scales, ranging from a whole 102
ecosystem, e.g a bay or an estuary, through a particular cultivation area, including 103
several cultivation units, to a cultivation unit, such as a raft. Different processes and 104
variables may limit CC at these different scales. At the ecosystem scale, bivalve 105
production is more likely to be limited by phytoplankton production, whereas at smaller 106
scales, physical mixing is more likely to be the limiting factor. For example, at the scale 107
of a mussel raft, it is expectable that mussels clear the water faster than phytoplankton 108
divides. Therefore, feeding depends upon food input from adjacent water (Duarte et al., 109
2005). 110
111
The methods used for CC estimation may be divided into two main categories: 112
calculation budgets and mathematical models. Models may be divided in box models, 113
coupled physical-biogeochemical models and local depletion models. For a revision on 114
these different approaches see Duarte (2003). 115
The focus of the present work will be on local depletion models (e.g. Grant et al., 1998). 117
These models are usually applied to the cultivation unit scale, which is divided in 118
several cells, allowing modelling of seston supply decay downstream, as a result of 119
bivalve feeding. Examples may be found in Pilditch et al. (2001), Bacher et al. (2003), 120
Aure et al. (2007) and in Ferreira et al. (2007). Local depletion models are forced by 121
current velocities at the boundaries, solving the transport equation (1), including those 122
boundary conditions and local sources and sinks. 123
124
125
( )
( )
( )
2 2 22 2 2
uS vS wS
dS S S S
Sources Sinks
Ax Ay Az
dt x y z x y z
∂ ∂ ∂ ∂ ∂ ∂
+ + + = + + + −
∂ ∂ ∂ ∂ ∂ ∂ (1)
126
127
Where, 128
u, v and w - current speeds in x, y and z directions (m s-1); A – Coefficient of eddy 129
diffusivity (m2 s-1); S – A conservative (Sources and Sinks are null) or a non 130
conservative variable in the respective concentration units. 131
132
Local depletion models emphasize the potential importance of altering the geometry of 133
cultivation structures to optimize seston supply. In these models, there is no feedback 134
from the cultivation units to the ecosystem. However, they may be very useful, among 135
other things, to parameterize local depletion effects at larger scale models. Bacher et al 136
(2003) developed a software tool that integrates a local depletion model with a 137
Geographical Information System (GIS) interface for Sungo Bay (People’s Republic of 138
China). This tool allows the user to choose a particular area on the GIS and run it using 139
by Ferreira et al. (2007) to screen for economically optimal production, using marginal 141
analysis. The same authors also provided a tool to examine interactions between 142
shellfish aquaculture and eutrophication. 143
144
Mussel raft culture takes place in Galician Rías since 1946. It started with 125 m2 rafts 145
and evolved to 500 m2 rafts (Pérez Camacho and Labarta, 2004). After a period of rapid 146
increase in raft numbers, between 1960 and 1970 (Pérez Camacho et al., 1991), an 147
increase in raft area took place, probably, with the aim of increasing mussel production. 148
Empirical evidence (data presented by Pérez Camacho et al. (1991)), as well as common 149
sense, suggests that larger rafts allow larger yields. However, it is expectable that over a 150
certain raft size, part of the mussels may be food limited, specially, under low current 151
velocities, as water flowing beneath the raft is cleared from food particles by mussels 152
located upstream, with potential negative implications on raft yields. This leads to the 153
need of optimizing raft dimensions and to understand whether it is better to invest in a 154
larger number of smaller rafts or a smaller number of larger rafts. Furthermore, in order 155
to optimize mussel production at the ecosystem scale, it is important to quantify local 156
food depletion effects. Therefore, the objectives of the present work are to: 157
1) Develop a carrying capacity model (CC) based on local food depletion effects at 158
mussel rafts; 159
2) Use the model to estimate raft CC as a function of water flow, food 160
concentration, mussel physiology and raft dimensions. 161
162
Methodology 163
Study area 165
166
Galician Rias are flooded tectonic valleys on the northwest of the Iberian Peninsula 167
(Fig. 1). They are the ground for the highest mussel production in Europe – 250 X 106 168
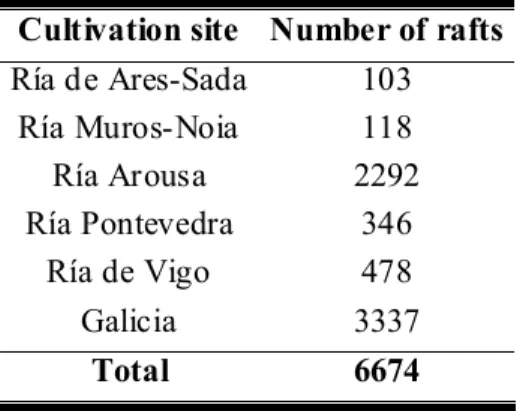
kg year-1. This production is based on floating rafts. At present, there are over six 169
thousand mussel rafts in Galician Rias (Table 1), with an area of 500 m2, with 500 170
hanging ropes 12 m long (Fig. 2) (Figueiras et al., 2002). The cultivation process may 171
be divided in three stages: (i) obtaining the seed; (ii) growing the seed; (iii) thinning out 172
the juveniles and growing them until commercial (adult) size. The different duration of 173
the commercial cycle (one year) and the cultivation cycle (16 – 18 months) leads to the 174
frequent need of keeping different size mussels in the same rafts. 175
176
Conceptuals 177
178
The model presented here is a local depletion model and was conceived to estimate 179
carrying capacity (CC) of mussel rafts as a function of water flow, food concentration, 180
mussel physiology and raft dimensions. It was designed to estimate CC at the 181
cultivation leases scale, not accounting for feedbacks between local food depletion 182
effects and ecosystem properties. 183
184
Fig. 2 is a simplified scheme of a mussel raft of the type used in Galicean Rias, showing 185
the transport of food in one horizontal dimension. Given the area of mussel rafts (500 186
m2) it is assumed that bivalve food supply depends on advection of suspended particles 187
assumption, food concentration changes, as water flows across a mussel raft, may be 189
described by equation 2: 190
191
1 1 . .
dC
Q CR C N M L T
dx
− −
= − (2)
192
193
Where, 194
Q – Water flow [L3T-1]; C – Food concentration [ML-3]; x – Distance [L]; CR – 195
Clearance rate of an average mussel [L3T-1mussel-1]; N – Mussel number per unit of 196
length [mussel L-1] (obtained by dividing the total number of mussels in a raft by the 197
distance travelled by the water within the raft). 198
199
This equation holds for those situations when water flows perpendicular to the sides of 200
mussel rafts. The solution of equation 2 is: 201
202
. . . exp
0 CR N x
Cx=C − Q
(3)
203
204
Where C0 and Cx are food concentrations before water enters the mussel raft and at a 205
distance x within the raft, respectively. Studies of raft culture demonstrate that there is 206
local seston depletion due to suspension feeding, with chlorophyll reduction up to 60% 207
as it passes though the rafts (Pérez Camacho et al., 1991). The same authors state that 208
production on the parts of the raft located upstream, tend to be higher than at the 209
opposite side. This probably holds for those rafts that have only one anchoring system, 210
entrance into the mussel raft [MT-1mussel-1] may be calculated from the product of CR 212
by equation 3, obtaining equation 4: 213
214
. . . exp
. 0 CR N x
CR C
FR x= − Q (4)
215
216
Assuming no pseudo faeces production, as is the case in Galicean Rías, due to low 217
suspended matter loads (Figueiras et al., 2002) ingestion rate IR = FR. According to (4) 218
IR increases asymptotically with Q towards CR.C0 and decreases exponentially with N 219
towards zero. 220
221
An averageIR, integrated over the water path within the raft may be calculated as: 222
223
1 . .
. exp . 0
0
1. . 0. .
. exp exp
0
. x CR N x
dx CR C Q x IR x
x CR N x CR N Q C Q Q N x − ∫ = ⇔ ∆ − − + − ∆ (5) 224 225
Mussel scope for growth (SFG) may be obtained from 6: 226
227
.
SFG=IR AE−R (6)
228
229
Where, 230
AE is absorption efficiency and R respiration. 231
Total scope for growth (TSFG) (also referred as production) may be calculated by 233
inserting equation 5 and multiplying the result by N: 234
235
236
1. . 0. .
. exp exp
0
.
x CR N x CR N
Q C
Q Q
TSFG AE R N
N x − − + − = ∆ − (7) 237
The value of N that maximizes TSFG may be obtained by derivation of TSFG with 238
respect to N: 239
240
241
(
)
1. . 1. 0. . 0.
. exp exp .
0
1. . 0. .
. exp exp
0
. 2
.
1. . 0. .
. exp exp
0
.
x CR N x CR x CR N x CR
Q N x
C
Q Q Q Q
x CR N x CR N
Q x
C
Q Q
dTSFG
AE N
dN N x
x CR N x CR N Q C Q Q A N x − − − + − − ∆ − − − + − ∆ = + ∆ − − + −
∆ E−R
242
(8) 243
244
Assuming 0x =0, 245
246
(
)
1. . 1. 1. .
. exp . . exp 1
0 0
. 2
.
1. .
. exp 1
0
.
x CR N x CR x CR N
Q N x Q x
C C
Q Q Q
dTSFG
AE N
dN N x
x CR N Q C Q AE R N x − − − ∆ − − − + ∆ = + ∆ − − + − ∆ 248 (9) 249 250 251
The number of mussels per metre that maximizes production is therefore: 252
253
. ln
. . 1. 0
1. R x AE x CR C N x CR Q ∆ = − (10) 254 255
The corresponding total number of mussels within the raft is obtained from (11): 256
257
. N x
N total = ∆ (11)
258
259
The product of SFG by Ntotal is raft production. The relationship between Production, 260
flow rate and bivalve abundance is depicted in Figs. 3c, 4c and 4c, showing the 261
parabolic relationship between the former and abundance, described in Bacher et al. 262
(1998), and the asymptotic increase of the former with current speed (a surrogate for 263
flow rate). 264
265
The main difference between the models of Grant et a l. (1998), Pilditch et al. (2001), 266
the former are based on a numerical solution of a transport equation (cf. – Introduction), 268
where the cultivation leases are discretized into boxes, the latter is based on an 269
analytical model. In most situations, it is not possible to find an analytical solution to 270
the CC problem. For example, when bivalve biomass density changes across model 271
domain and over time, as in models that simulate bivalve growth, there are feedbacks 272
between biomass and food consumption that prevent obtaining an analytical solution. 273
However, in the present case, the model was designed for application over short time 274
and spatial scales, when it is reasonable to assume that mussel biomass density does not 275
change significantly. In this situation, it is possible to assume that bivalve feeding is a 276
constant flux and therefore obtain a relatively simple analytical solution. The main 277
advantage of the current approach is the easiness to obtain an estimate of CC, once the 278
necessary parameters are introduced into equation 10, using a simple spreadsheet. To 279
achieve the same goal with a numerical model, it is necessary to perform several 280
simulations under different bivalve densities and to find, iteratively, the value that 281
maximizes TSFG. A similar approach to the one described in this work was based on a 282
model by Incze et al. (1981) and applied by Sarà & Mazzola (2004), to calculate the 283
number of rafts that maximise food ingestion by bivalves. In this model, a geometric 284
decrease in food concentration across each raft was assumed, in accordance with the 285
exponential decaying function presented above (equation 2). An analytical solution to 286
the problem was also obtained. This model differed from the one presented herein, not 287
only because it was applied to a different spatial scale (an array of rafts), but also 288
because it did not include a SFG maximizing function. The focus of the present work is 289
optimizing mussel production at the raft level. 290
The main assumptions of the approach developed in this work are: (i) Mussel size 292
homogeneity in the rafts; (ii) Unidirectional flow across the rafts. In spite of the size of 293
the mussel cultivation rafts at Galician Rías (500 m2) (Figueiras et al., 2002), the 294
assumption of mussel size homogeneity across the rafts does not always holds, because 295
some farmers choose to separate bivalves at different cultivation phases by different 296
rafts, whereas some keep different cultivation phases at the same raft. In the last case, 297
the model may be applied separately to different parts of the raft. Regarding the 298
assumption of a unidirectional flow, it is a common place in local depletion models (e.g. 299
Bacher et al. (2003) and Ferreira et al. (2007)), over spatial scales on the order of 300
hundreds to thousands of meters, therefore it seems more acceptable at the scale of a 301
cultivation raft. This assumption may not hold in cases when strong turbulence develops 302
between mussel ropes. However, assuming that turbulence will be isotropic, the average 303
behaviour across the direction perpendicular to the dominant flow will be similar to that 304
described by equation 2. Some preliminary experimental evidence suggests that lateral 305
flow maybe important in mussel rafts (Blanco et al., 1996) contradicting, at least 306
partially, the above assumption. However, in this case, the model presented here 307
behaves conservatively, leading to an underestimate of CC, since it will not take into 308
account lateral seston fluxes. 309
310
Calculations 311
312
Several calculations were performed with the above equations, to analyse the 313
dependence of IR, SFG and raft production on food concentration, current speeds - 314
used as a surrogate for flow rate – and mussel biomass. Equation 10 was used to obtain 315
adults and compare these estimates with actual data. In this case, it was assumed only 317
one type of mussels per raft. 318
319
Another set of calculations was carried out for hypothetical rafts containing all mussel 320
types in different layouts: seeds, juveniles and adults, (i) along the downstream 321
direction; (ii) along the upstream direction; (iii) parallel to the flow. In these cases, the 322
“normal” (Labarta et al, 2004) number of mussels was assumed (2500, 1000 and 700 323
mussels per metre of rope for seeds, juveniles and adults, respectively) and several 324
combinations of current speeds and food concentrations tested to compute SFG for each 325
mussel type. It was assumed that seeds occupy 14% of raft area, whereas juveniles and 326
adults occupy 43% each. In cases (i) and (ii) food concentration at the upstream limit of 327
the raft area allocated to each mussel class was calculated using equation 3. Equation 7 328
was used for each class to evaluate production. 329
330
Finally, calculations were made after the “best” of the cultivation layouts described in 331
the previous paragraph was achieved in terms of raft production, to analyse the 332
possibility of increasing the number of ropes per raft. Therefore, raft production was 333
calculated as a function of increasing number of ropes with mussels, keeping the 334
number of mussels per rope constant. In these calculations, two approaches were 335
followed: (i) assuming that current speed within the rafts is not affected by rope density; 336
(ii) reducing within raft current speed and flow as a function of drag exerted by mussel 337
ropes. To estimate drag effects, the approach described by Jackson and Winant (1983) 338
for a kelp bed and applied to Saldanha Bay mussel raft culture by Grant et al. (1998), 339
was followed. Drag (D) exerted by individual mussel ropes is described by equation 12: 340
2
D=CDρu dlropes (12)
342
343
CD – Drag coefficient (0.5 for flow approaching a cylinder); ρ – seawater density (1.03 344
g cm-3); u – current velocity (variable); d – diameter of the cluster of mussels 345
surrounding the rope (c.a. 12 cm); l – rope length (12 m); ropes – rope number per m2 346
(c.a. 0.9). 347
348
From equation 12 it is possible to estimate drag per unit area within the raft as 0.75u2. 349
Increasing rope density leads to increased drag. Since drag scales as u2, it is possible to 350
estimate the relative decrease in current velocity as a function of a drag increase. 351
352
For all calculations the following conditions were used: 353
(i) A CR of 2.7 L/h/mussel for a standard 0.3 g meat DW individual (Fernandez 354
Reiriz and Labarta, 2004). 355
(ii) An AE of 0.59 was calculated from AE = 0.95-0.18/OCI. OCI stands for 356
organic contents of ingested matter, where a value of 0.5 was assumed 357
(Fernandez Reiriz and Labarta, 2004). 358
(iii) A respiration rate of 0.21 mL / h / mussel was considered for a standard 0.3 359
g meat DW mussel (Fernandez Reiriz and Labarta, 2004). 360
(iv) Allometric coefficients of 0.62 and 0.75 were used for CR and respiration, 361
respectively (Fernandez Reiriz and Labarta, 2004). 362
(v) To convert IR and SFG from mass to energy units a value of 23500 J / g 363
was assumed for mussel energetic contents (Bayne et al., 1985). 364
(vi) To convert from mL of oxygen respired to energy units a value of 20.36 J / 365
367
All values are well within ranges observed in Galician Rias (Fernandez Reiriz and 368
Labarta, 2004). 369
370
Results and discussion 371
372
In the next paragraphs obtained results will be presented and discussed in the order 373
described above (cf. – Methodology – Calculations). 374
375
The solutions of equations 5 – 7, regarding raft average IR, SFG and raft production, 376
are presented in Figs. 3, 4 and 5 for seed, juvenile and adult mussels, respectively. 377
Results obtained show that IR increases asymptotically with current speed and 378
decreases exponentially with biomass (Figs. 2a, 3a and 4a). This decrease is more 379
noticeable for results obtained with juvenile and adult mussels due to their higher 380
clearance rates. Under high current speeds and low mussel stocks, the time scale for 381
filtration (e.g. over 20 minutes for “normal” seed stocks of 2500 mussels per meter of 382
rope (cf. – Methodology – calculations)) is less that the time scale for water renewal 383
(less than 4 minutes for higher current speeds (0.11 m s-1)), whereas the opposite is true 384
at low current velocities, leading to possible food limitation. Similar trends are apparent 385
for SFG (Figs. 2b, 3b and 4b), with negative values for juvenile and adult mussels, 386
when low current velocities combine with high mussel biomasses. Mussel production 387
(Figs. 2c, 3c and 4c) exhibits a parabolic response to mussel biomass under low current 388
velocities. This response is nearly linear, in the opposite situations. The parabolic 389
response results from the compromise between mussel individual growth and total 390
reduces but, within certain limits, total production tends to increase due to the larger 392
number of individuals. However, after individual growth is reduced above a threshold, 393
total production decreases (Bacher et al., 1998). 394
395
Under current speeds ranging between 0.01 and 0.11 m s-1 and POM between 0.25 and 396
1.0 mg/L, the number of mussels that maximizes raft production (equation 10), 397
assuming only one mussel age class per raft, range between near zero till some tens of 398
thousands for seeds, and several thousands for juveniles and adults (Fig. 6). Under a 399
current speed and POM concentration representative of “normal” conditions observed 400
near cultivation rafts within the Galician Rias (Perez-Camacho and Labarta, 2004) – up 401
to 2-3 cm s-1 and 0.5 mg L-1, respectively – predicted seed, juveniles and adult values 402
per metre of cultivation rope are within the same order of magnitude as those used in the 403
cultivation rafts: a few thousands for seeds and several hundreds for juveniles and 404
adults. Considering that in the model, these mussel abundances are those that maximize 405
total SFG, it is apparent that under the mentioned “normal” conditions, raft CC has not 406
been exceeded. It is noteworthy that in these calculations, self-thinning effects at the 407
rope level, related to the multilayer matrices formed by the mussels (Guiñez and 408
Castilla, 1999), were not taken into account. Mussel number was predicted under the 409
assumption that intraspecific competition for food occurs only at the raft level. 410
411
Figs. 7, 8 and 9 synthesize results obtained with equation 7 for three different 412
cultivation scenarios as described above (cf. – Methodology – Calculations). It is 413
apparent that under very low food concentrations and current speeds, mussels located 414
downstream may exhibit negative production values. Average production estimates 415
0.70 and 0.12 kg meat DW h-1 for the scenarios represented in Figs 7, 8 and 9, 417
respectively. Therefore, when seed mussels are located upstream, receiving more food, 418
raft production is larger than when adult mussels occupy that position. This may be 419
explained by the fact that adult mussels clear the water very quickly and less food 420
remains for mussels located downstream. When a parallel disposition is used in relation 421
to the flow, with all mussel classes receiving food without prior filtration, production is 422
reduced because each class receives a smaller proportion of inflowing water 423
(proportional to the percentage of the raft they occupy). Therefore, it is apparent that 424
disposing different mussel classes in the seeds, juveniles and adults sequence, within 425
cultivation densities normally used in Galician Rías, it seems a good option in terms of 426
raft production, when the rafts are allowed to rotate with seeds always located at the 427
upstream end. 428
429
Considering this mussel sequence, raft production was calculated as a function of 430
increasing number of ropes (cf. – Methodology – Calculations). Results obtained are 431
presented in Fig. 10, where mussel production is plotted as a function of rope density. 432
The choice of plotting adult mussel production together with overall production is 433
justified by the fact that, according to preliminary calculations, adult mussel SFG is the 434
most sensitive to increases in raft standing stocks. Increasing rope density from 0.9 435
(normal value) till 4.7 per m2, leads to a 5-fold increase in drag and a corresponding 50.5 436
= 2.2 decrease in current speed and current flow. When drag is considered, even a 1.5 437
fold increase in rope density leads to a reduction on adult mussel production (located at 438
the downstream end of the raft). Increasing rope density over 2-times its normal value, 439
mussel production decreases for rope densities above 1.5 times its normal value. 441
However, overall production may increase until a rope density 3 times its normal value. 442
443
From the results obtained in this work, it is apparent that mussel number per raft is close 444
to raft CC. Any increase in rope density may lead to a decrease in adult mussel growth. 445
In fact, the predicted decrease could be even more important if other suspension feeders 446
(epifauna fouling) that may be present on the ropes were considered, such as sponges 447
and barnacles. According to Pérez Camacho et al. (1991), the intensive filtering activity 448
of mussels and their dominance in the raft fauna (95% of total biomass) outcompetes 449
most filter feeders. The importance of these potentially competing organisms was 450
discussed by Grant et al. (1998) in the light of available literature. However, the cited 451
authors did not reach a clear conclusion, suggesting the need for further research. 452
According to the same authors, rope density in culture rafts in Saldanha Bay is c.a. 3 453
ropes m-2, with average current speeds of 0.075 m s-1- well within the ranges observed 454
in Galician Rias. In Saldanha Bay, raft size is smaller (c.a. 11 X 14 m) than values 455
considered in this work, leading to shorter time scales of water renewal, which may 456
support a large rope density. In fact, rope density reached 4 ropes/m2 in Galicia, at the 457
beginning of mussel farming activity in 1946, when raft area was solely 125 m2 (Pérez 458
Camacho and Labarta, 2004). 459
460
In order to get some insight into the potential effects of raft size on mussel production, 461
calculations were carried out with equation 10, to estimate the number of mussels 462
optimising overall raft production for rafts with areas from 125 till 500 m2 (Pérez 463
Camacho et al., 1991; Pérez Camacho and Labarta, 2004). Equation 7 was then used to 464
corresponds to a “potential” maximum yield. These calculations were performed 466
separately for rafts with seed, juvenile and adult mussels, using the same POM 467
concentration ranges and current velocities synthesised in Fig. 6. Afterwards, overall 468
averages were calculated for each raft size, pooling together data for seeds, juveniles 469
and adults. Since current velocity and POM ranges were not subjected to any 470
probability density function, the calculated averages are not representative of the real 471
system. Nevertheless, they may be used for comparison purposes. Obtained results are 472
shown in Fig. 11, suggesting that an increase in raft size of c.a. 300% (from 125 till 500 473
m2), corresponds to an increase in potential raft yield of solely 73%. Separate results for 474
rafts with seeds, juveniles or adults, lead to the same results. The predicted decrease in 475
raft potential yield per unit area (70%), as a result of an increase in raft area, suggests 476
that mussels became more food limited under larger rafts. Therefore, these results 477
suggest that raft area is an important variable to take into account when mussel 478
production is to be optimized at the level of raft parks. Here, a compromise should be 479
achieved between production costs – higher when more rafts are used - and mussel 480
production per raft. Larger scale effects (e.g. at the level of raft parks and at the 481
ecosystem level) should also be investigated prior to any definite recommendation. 482
Furthermore, maximizing production does not necessarily correspond to maximising 483
profit. In fact, according to Ferreira et al. (2007), a producer who bases his decisions on 484
average or total production and revenue principles will earn less profit than one who 485
uses marginal analysis 486
487
Conclusions 488
From the above results, it is apparent that CC at the raft scale in Galician Rías has not 490
been exceeded by current culture practices. In fact, increasing rope density 1.5X does 491
not decline mussel production, suggesting that there is some room for an increase on 492
mussel loads. However, it seems advisable to be conservative about model estimates, 493
especially when the model does not suggest the possibility for a large increase in rope 494
density without affecting the growth of adult mussels. Therefore, any possible increase 495
in mussel production should be considered at a higher spatial scale. Alternatively, 496
changing raft dimensions and the total number of rafts should be considered, for it 497
seems plausible that by reducing raft size, better yields per unit area may be obtained. In 498
any case, larger scale effects of mussel culture – at the scale of the raft parks and at the 499
ecosystem scale - should be considered before any final recommendation is given. 500
501
Ac knowledgements 502
503
This work was supported by the project-contract with de PROINSA 504
(PGIDIT06RMA018E and CSIC 20061089). The authors wish to thank Maria João 505
Guerreiro for her helpful comments on an earlier version of this manuscript. 506
507
References 508
509
Aure, J., Strohmeier, T., Strand, O., 2007. Modelling current speed and carrying 510
capacity in long-linr blue mussel (Mytilus edulis) farms. Aquaculture Research 38, 304-511
312. 512
Babarro, J.M.F., Fernández-Reiriz, M.J., Labarta, U., 2000. Feeding behaviour of seed 514
mussel Mytilus galloprovincialis cultivated on the raft: environmental parameters and 515
seed origin. Journal of Shellfish. Research 19, 195-201. 516
517
Bacher, C., Duarte, P., Ferreira, J.G., Héral, M., Raillard, O., 1998. Assessment and 518
comparison of the Marennes-Oléron Bay (France) and Carlingford Lough (Ireland) 519
Carrying Capacity with ecosystem models. Aquatic Ecology 31, 379 - 394. 520
521
Bacher, C., Grant, J., Hawkins, A.J.S., Fang, J., Zhu, M., Besnard, M., 2003. Modelling 522
the effect of food depletion on scallop growth in Sungo Bay ( China). Aquatic Living 523
Resourses 16, 10-24. 524
525
Barillé, L., Héral, M. , Barillé-Boyer, A., 1997. Modélisation de l’ecophysiologie de 526
l’huître Crassostrea gigas dans un environment estuarien. Aquatic Living Resources 10, 527
31 – 48. 528
529
Bayne, B.L., Brown, D. A., Burns, K., Dixon, D.R., Ivanovici, A., Livingstone, D.R., 530
Lowe, D.M., Moore, M.N., Stebbing, A.R.D., Widdows, J., 1985. The effects of stress 531
and pollution on marine animals. Praeger Publisher, New York, 384 pp. 532
533
Blanco, J., Zapata, M., Moroño Á., 1996. Some aspects of the water flow though mussel 534
rafts. Scientia Marina 60, 275 – 282. 535
536
Carver, C.E.A., Mallet, A.L., 1990. Estimating carrying capacity of a coastal inlet for 537
539
Dame, R.F., Prins, T.C., 1998. Bivalve carrying capacity in coastal ecosystems. Aquatic 540
Ecology 31, 409 – 421. 541
542
Dijkema, R., van Stralen, M., 1989. Mussel cultivation in the Netherlands. World 543
Aquaculture 20, 53-62. 544
545
Duarte, P., Meneses, R. , Hawkins, A.J.S., Zhu, M., Fang, J., Grant, J. 2003. 546
Mathematical modelling to assess the carrying capacity for multi-species culture within 547
coastal water. Ecological Modelling 168, 109-143. 548
549
Duarte, P., Hawkins, A.J.S, Pereira, A., 2005. How does estimation of environmental 550
carrying capacity for bivalve culture depend upon spatial and temporal scales? In: 551
Dame, R., Olenin, S. (Eds.), The comparative role of suspension feeders in aquatic 552
systems. NATO ARW in Nida, Lithuania, 3-9 October, 2003: 121 - 135. Kluwer 553
Scientific Publishers, Dordrecht, The Netherlands. 554
555
Fang, J., Sun, H., Yan, J., Kuang, S., Feng, L., 1996. Polyculture of scallop Laminaria 556
japonica in Sungo Bay. Chinese Journal of Oceanology and Limnology 14, 322-329. 557
558
Fernandez-Reiriz, M.J., Labarta, U., 2004. Procesos fisiológicos y disponibilidad de 559
alimento del mejillón en las rías gallegas. In Labarta U. (Ed). Bateeiros, mar, mejillón. 560
Una perspectiva bioeconómica. CIEF. Fundación Caixagalicia. Santiago. pp 45-73. 561
Fernandez-Reiriz, M.J.,Duarte, P., Labarta,U., in press. Modelos de comportamiento 563
alimentario en el mejillón de las Rías de Galicia. In: Biologia y Cultivo del mejillon 564
(Mytilus galloprovincialis) en Galicia..Madrid, Biblioteca de Ciencias (CSIC). 565
566
Ferreira, J., Duarte, P., Ball, B., 1998. Trophic capacity of Carlingford Lough for 567
aquaculture - analysis by ecological modelling. Aquatic Ecology 31, 361 – 379. 568
569
Ferreira, J., Hawkins, A.J.S. and Bricker, S.B.. Management of productivity, 570
environmental effects and profitability of shellfish aquaculture – the Farm Aquaculture 571
Resource Management (FARM) model. Aquaculture (2007), doi: 572
10.1016/j.aquaculture.2006.12.017. 573
574
Figueiras, F.G., Labarta, U., Fernández Reiriz, M.J., 2002. Coastal upwelling, primary 575
production and mussel growth in the Rías Baixas of Galicia. Hydrobiologia 484, 121-576
131. 577
578
Grant, J. S. D., J., Monteiro , P. Pitcher , G., Heasman, K., 1998. Shellfish culture in 579
the Benguela system: A carbon budget of Saldanha Bay for raft culture of Mytilus 580
galloprovincialis. Journal ol Wildffish Research 17, 41-49. 581
582
Grant, J., 1999. Ecological constraints on the sustainability of bivalve aquaculture. In N. 583
Snennevig, H. Reinertsen and M. New (eds.) Sustainable Aquaculture, food for the 584
future?: 85-96. Balkema. 585
Guiñez, R., Castilla, J.C., 1999. A tridimensional self-thinning model for multilayered 587
intertidal mussels. The American Naturalist 154, 341-357. 588
589
Hawkins, A.J.S., Bayne, B.L., Bougrier, S., Héral, M., Iglesias, J.I.P., Navarro, E., 590
Smith, R.F.M., Urrutia, M.B., 1998. Some general relationships in comparing the 591
feeding physiology of suspension-feeding bivalve molluscs. Journal of Experimental 592
Marine Biology and Ecology 219, 87-103. 593
594
Hawkins, A.J.S., James, M.R., Hickman, R.W., Hatton, S., Weatherhead, M., 1999. 595
Modelling of suspension-feeding and growth in the green-lipped Perna canaliculus 596
exposed to natural and experimental variations of seston availability in the Marlborough 597
Sounds, New Zealand. Marine Ecology Progress Series 191, 217–232. 598
599
Hawkins, A.J.S., Duarte, P., Fang, J.G., Pascoe, P.L., Zhang, J.H., Zhang, X.L., Zhu, 600
M., 2002. A functional model of responsive suspension-feeding and growth in bivalve 601
shellfish, configured and validated for the scallop Chlamys farreri during culture in 602
China. Journal of Experimental Marine Biology and Ecology 281, 13-40. 603
604
Héral, M., 1993. Why carrying capacity models are useful tools for management of 605
bivalve molluscs culture. In R. Dame (ed.) Bivalve filter-feeders in estuarine and coastal 606
ecosystems: 455-477.. NATO ASI Series. 607
608
Incze, L.S., Lutz, R.A., True, E., 1981. Modelling carrying capacity for bivalve 609
molluscs in open, suspended-culture systems. Journal of the World Mariculture Society 610
612
Jackson, G.A., Winant, C.D., 1983. Effect of a kelp forest on coastal currents. 613
Continental Shelf Research 2, 75-80. 614
615
Labarta, U., Fernandez-Reiriz, M.J., Perez-Camacho, A., Perez-Corbacho, E., 2004. 616
Bateeiros, mar, mejillón. Una perspectiva bioeconómica. Centro de Investigaciones 617
Económicas y Financieras (CIEF). Fundación CaixaGalicia. Santiago de Compostela. 618
274 pp. 619
620
Navarro, E., Iglesias, , J.I.P., Pérez-Camacho, A., Labarta, U. Beiras, R., 1991. The 621
physiological energetics of mussels (Mytilus galloprovincialis) from different 622
cultivation rafts in the Ria de Arousa. Aquaculture 94: 197-212. 623
624
Pérez Camacho, A., Gonzalez, R., Fuentes, J., 1991. Mussel cultura in Galicia (N.W. 625
Spain). Aquaculture 94, 263-278. 626
627
Pérez-Camacho, A., Labarta, U., 2004. Rendimientos y producción del mejillón: Bases 628
biológicas para la innovación. In Labarta, U. (Ed). Bateeiros, mar, mejillón. Una 629
perspectiva bioeconómica. CIEF. Fundación Caixagalicia. Santiago. pp 93-121. 630
631
Pilditch, C. A., Grant, J., Bryan, K.R., 2001. Seston supply to sea scallops (Placopecten 632
magellanicus) in suspended culture. Canadian Journal of Fisheries and Aquatic Science 633
58, 241-253. 634
Prins, T.C., Smaal, A., Dame, R., 1998. A review of the feedbacks between bivalve 636
grazing and ecosystem processes. Aquatic Ecology 31, 349 – 359. 637
638
Raillard, O., Ménesguen, A., 1994. An ecosystem model for the estimating the carrying 639
capacity of a macrotidal shellfish system. Marine Ecology Progress Series 115, 117 – 640
130. 641
642
Ren, J.S., Ross, A.H., 2001. A dynamic energy budget model of the Pacific oyster 643
Crassostrea gigas. Ecological Modelling 142, 105-120. 644
645
Sarà, G., Mazzola, A., 2004. The carrying capacity for Mediterranean bivalve 646
suspension feeders: evidence from analysis of food availability and hydrodynamics and 647
their integration into a local model. Ecological Modelling 179, 281-296. 648
649
Scholten, H., Smaal, A.C., 1998. Responses of Mytilus edulis L. to varying food 650
concentrations: testing EMMY, an ecophysiological model. Journal of Experimental 651
Marine Biology and Ecology 219, 217-239. 652
653
Shpigel, M., 2005. Bivalves as biofilters and valuate by-products in land-based 654
aquaculture systems: In: The Comparative Roles of Suspenson-Feeders in Ecosystems, 655
R.F. Dame, S. Olenin (Eds), Kluwer Academic Publishers, Dordrecht, pp 183-198. 656
657
Smaal, A.C., Héral., M. (eds) 1998. Modelling bivalve carrying capacity. Aquatic 658
Ecology 4, pp. 439. 659
Smaal, A. Stralen, M., Schuiling, E., 2001. The interaction between shellfish culture and 661
ecosystem processes. Canadian Journal of Fisheries and Aquatic Science 58, 991 – 662
Table 1 – Number of mussel rafts in Galician rías.
Cultivation site Number of rafts Ría de Ares-Sada 103
Ría Muros-Noia 118 Ría Arousa 2292 Ría Pontevedra 346
Ría de Vigo 478
Galicia 3337
Figure captions
Fig. 1 – Location of four Rías Baixas on the NW of the Iberian Peninsula.
Fig. 2 – Scheme of a mussel raft with symbols as described for the model (see text).
Fig. 3 – Ingestion rate (a), mean scope for growth (b) and mussel production (c) for a raft with “seed” mussels solely (0.05 g meat DW) as a function of mussel abundance and current speed, assuming a concentration of POM of 0.5 mg L-1 and ranges in mussel abundance and current speed within those observed (see text).
Fig. 4 – Ingestion rate (a), mean scope for growth (b) and mussel production (c) for a raft with juvenile mussels solely (1.0 g meat DW) as a function of mussel abundance and current speed, assuming a concentration of POM of 0.5 mg L-1 and ranges in mussel abundance and current speed within those observed (see text).
Fig. 5 – Ingestion rate (a), mean scope for growth (b) and mussel production (c) for a raft with adult mussels solely (2.25 g meat DW) as a function of mussel abundance and current speed, assuming a concentration of POM of 0.5 mg L-1 and ranges in mussel abundance and current speed within those observed (see text).
Fig. 6 – Mussel number per metre of rope (obtained from equation 10) that optimizes global SFG and production for a raft with “seed” (a), juveniles (b) and adults (c), as a function of current speed and POM concentration (see text).
Fig. 7 – Upper left figure: Schematic top view of a mussel raft with seeds, juveniles and adults in the downstream direction, with the former occupying 14% of raft area and the remaining 86% (43% each). The remaining figures show production of each age class calculated with equation 7, for ranges in current speeds (a surrogate for flow) and POM concentrations within those observed (see text).
Fig. 8 – Upper left figure: Schematic top view of a mussel raft with seeds, juveniles and adults in the upstream direction, with the former occupying 14% of raft area and the remaining 86% (43% each). The remaining figures show production of each age class calculated with equation 7, for ranges in current speeds (a surrogate for flow) and POM concentrations within those observed (see text).
Fig. 9 – Upper left figure: Schematic top view of a mussel raft with seeds, juveniles and adults aligned with the current direction, with the former occupying 14% of raft area and the remaining 86% (43% each). The remaining figures show production of each age class calculated with equation 7, for ranges in current speeds (a surrogate for flow) and POM concentrations within those observed (see text).
upstream end of the raft. When drag is considered, current speed within the raft is reduced as a function of drag (see text).