A Work Project, presented as part of the requirements for the Award of a Masters Degree in Management from the NOVA – School of Business and Economics, in
accordance with the Double Degree program (LUISS Guido Carli)
IAS/IFRS Mandatory Adoption and
Cross-Border M&A
Francesca Romana Gambini 2260
A Project carried out on Corporate Finance area, under the supervision of: Prof. Miguel Ferreira
Abstract
This study investigates the effect of the mandatory implementation of IAS/IFRS on
cross-border M&A activity. I test the hypothesis that the improvement in the
comparability of financial statements among the adopting countries facilitates
border transactions. According to the expectations, I find support for enhanced
cross-border M&As following the mandatory adoption of IFRS due to a likely increase in the
comparability of financial reports. Additionally, listed targets from IFRS adopting
countries do experience stronger positive influence on foreign M&A transactions than
unlisted target from adopting countries and listed targets from IFRS non-adopting
countries.
1. Introduction
The IFRS Foundation and the IASB were established in 2001 with the purpose of
banding together a uniform set of high quality, relevant, understandable and
internationally accepted financial reporting standards. The idea of convergence – i.e. all
major capital markets using the same accounting principles - is not new and it dates
back to the late 1950, as a reaction to the upsurge of cross-border capital flows due to
the post World War II economic integration (FASB, 2015). Evolving from such belief,
the objective of the IAS/IFRS is to provide a global framework setting out the concepts
for the preparation and presentation of financial statements to external users.
The 2005 represented a significant crossroads for the European countries, as the
regulation of the European Parliament and of the Council (No. 1606/2002) explicitly
ruled the adoption and use of IFRS: as of January 1st 2005, all the companies exposed to
the Member States’ law “shall prepare their consolidated accounts in conformity with
the international accounting standards”. Specifically, the mandatory adoption only
applies to all European companies whose debt or equity securities trade in a regulated
market, although unlisted companies are allowed to voluntary adopt the principles.
In this research, I test the hypothesis that the mandatory implementation of IFRS is
likely to improve the comparability of financial statements among adopting countries,
smoothing the evaluation of the reported information, thus facilitating and enhancing
cross-border corporate transactions. It is reasonable to predict increased foreign
investment activity due to the criticality of analyzing financial reports in M&A
recognizing investment opportunities, identifying possible targets, analyzing financial
reports over the due diligence process, and integrating after the acquisition.
The choice of considering M&As rather than foreign portfolio investments is motivated
by the possibility to discriminate between listed and unlisted firms and use the listing
status as a detection mean, since IFRS adoption is only mandatory for listed companies.
Moreover, M&As are preferred to foreign direct investments as the latter also include
greenfield investments1 for which the reporting principles in the target country are not
as relevant as in the case of M&As. (Henock and Oktay, 2014).
The goal of the study is to test the effect of the IFRS adoption on cross-border mergers
and acquisitions, given the mandatory amendment in financial reporting in the EU and
other countries. The evidence in Henock and Oktay (2014) is used as reference point
and benchmark for the comparison of the results, though the current analysis sets sights
on completing and deepening the explanations of the authors’ outcomes by widening
the range of the results and performing the test over different and broader samples.
The results are consistent with the hypothesis concerning the enhancement of
cross-border M&As due to a probable increase in the comparability of accounting reports
following the mandatory adoption of IFRS. The evidence supports Henock and Oktay
(2014) results that the odds of cross-border acquisitions of listed companies in the IFRS
adopting countries rise significantly after the IFRS obligatory implementation. These
findings are hardened when compared with those concerning unlisted targets from IFRS
1
adopting countries and listed targets from IFRS non-adopting countries. Lastly, I find
evidence for a greater increase in cross-border investments in the IFRS adopting
countries than non-adopting countries.
2. Related Studies
During the last decade an increasing number of countries adopted the IAS/IFRS
accounting principles or agreed to implement them in the near future. However, even if
the compulsory adoption for listed targets represented a milestone in the accounting
history of many countries, a number of researches investigate the potential benefits and
the economic consequences of the IFRS adoption affecting firms and markets.
For instance, Daske, Leuz et al. (2008) find that both market liquidity and companies’
cost of capital increase when the IFRS are introduced. In particular, there is evidence
for capital markets positive effects only in those countries with greater incentives to
provide transparent and higher quality information. Naranjo, Saavedra and Verdi (2012)
direct instead their attention towards the theory that information asymmetry can impact
on firms’ financing decisions, showing that after the IFRS adoption companies are more
willing to look for external financing and to issue equity rather than debt instruments.
Besides, several studies focus their empirical research to give evidence for an increased
comparability of financial reports due to the mandatory adoption of IFRS. Similarly to
the analysis conducted in this paper, De Fond, Hu et al. (2010) state that dictating a
single set of accounting rules can improve financial statements comparability and foster
mutual fund investments rather than M&As. The observation here is that in many
foreign funds, investment decisions are made both by fund managers and individuals:
while the first are assumed to be experienced investors, the funds’ definitive target
countries are likely to be chosen by the less experienced individuals. By contrast, in
M&A transactions only qualified executives carry deep assessments on the acquired
firms’ financial reports (Henock and Oktay, 2014). Nevertheless, they find evidence for
increased foreign mutual fund ownership following the mandatory adoption of IFRS in
those countries showing sounder credibility to properly apply the principles.
Relatedly, Yip Wing-yue and Young (2012) study the effect of IFRS mandatory
adoption on information comparability in 17 European countries by looking at the
“similarity of accounting functions, the degree of information transfer and the
relationship between earnings and the book value of equity”. They observe improved
comparability due to higher quality information resulting from the IFRS adoption.
In contrast, Rossi and Volpin (2004) argue that improved quality of reporting heads to a
reduction of cross-border M&As. Even so, this statement actually reinforce the results
obtained in the research presented in this paper, as the increase in cross-border M&A
activities can merely be attributed to the increased comparability of financial statements
rather than to the improved quality of reporting.
Though, Christensen, Lee and Walker (2008) offer an interesting insight that is worth
mentioning. According to their results, the IFRS adoption does not necessarily translate
into higher quality accounting information. The reason is that the IFRS are
principle-based, thus meaning that there could be more chances for misreporting, given the
3. Sample data selection and description
This research examines completed M&A transactions whose announcement date ranges
between January 1, 2000 and December 31, 2010. The deals are collected for the period
considered through the Thomson One Database, distinctly selecting domestic and
cross-border mergers and acquisitions. With the intention to study and compare different
samples, I portioned the transaction to combine listed and unlisted target companies
from IFRS adopting countries and from IFRS non-adopting countries. Specifically, a
higher number of observations are collected compared to Henock and Oktay’s research
(2014) by considering a larger number of IFRS adopting and non-adopting countries.
Also, specific attention is directed towards the classification of the acquirers involved:
the dataset only contains M&As whose acquirer is a publicly traded company in order
to avoid potential bias due to going-private transactions or to M&As carried out by shell
companies (Henock and Oktay, 2014).
The sample in the base model refers to 9,713 completed deals of listed targets from the
IFRS adopting countries. Next, the set of listed and unlisted target companies from
IFRS adopting countries (27,713 deals) are benchmarked with transactions involving
listed and unlisted targets from IFRS non-adopting countries (41,360 deals).
In addition, annual macroeconomic variables are also collected. Data concerning GDP
growth, population growth and inflation rate are gathered through the World Bank
dataset, while statistics relative to currency exchange rate and the GNP to GDP ratio are
obtained via Penn World Tables. Interbank rates are collected using the OECD online
statistics and missing information relative to this variable are filled with the available
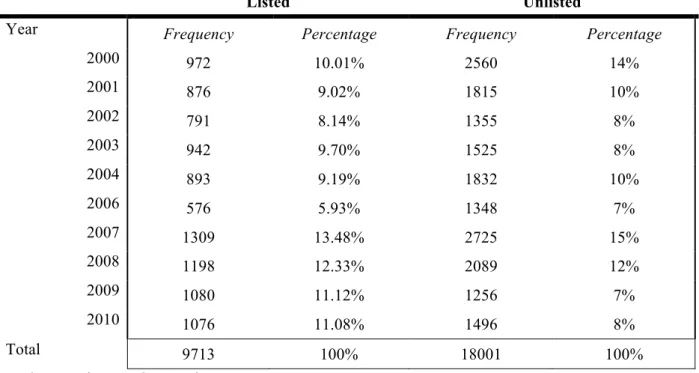
Table A.2 (reported in the Appendix) shows the distribution of the sample across years
and across countries. The time-series distribution2 for listed and unlisted targets
companies from the IFRS adopting countries presents an intensification of M&A
activities in 2000 and 2001 and in 2007 and 2008. In particular, before 2007 there is a
higher concentration of M&As of unlisted targets, but the pattern is then reversed from
2008. The inverted trend may be credited to the mandatory adoption of IFRS in 2005,
thus providing one first possible indication for a positive effect driven by the predicted
improved comparability of financial statements.
Following, considering the sample distribution for IFRS adopting countries and the
sample distribution for IFRS non-adopting countries3, it is possible to observe a higher
number of deals carried out by Australia and UK among the adopter countries, and by
the United States, Japan and Canada among the non-adopter countries. Given the strong
concentration around these nations, countries effects are taken into account when
estimating the impact of IFRS adoption on cross-border transactions so as to obtain and
interpret within-country estimates.
4. Methodology 4.1 Research Design
In order to capture the effect of the of the IAS/IFRS mandatory adoption in the EU and
other countries, the probability of an M&A deal being a cross-border transaction,
carried out for target firms in the IFRS adopting countries, is compared before and after
the mandatory adoption of the accounting principles in 2005. That is, the amount of
2
Refer to Panel 2.A in the Appendix for more details. 3
investments in IFRS adopting companies realized from abroad before 2005 is compared
to the amount realized after 2005.
With the purpose of measuring the odds of cross-border M&As, a regression analysis is
conducted with the use of the logit model. Because the dependent variable of the model
is a dummy variable taking the value one if the transaction observed is realized overseas
and zero otherwise, the logit method allows the estimation of the probability to
exclusively assume values between 0 and 1. Indeed, the logit model uses an iterative
estimation technique that is particularly employed for equations that are non linear in
the coefficients, known as “maximum likelihood” (ML). The advantage of using the
binomial logit relies on several properties: with large samples, as in this case, ML
produces normally distributed coefficients, giving unbiased and minimum variance and
allowing for the use of the traditional hypothesis testing procedure. (Studenmund, 2011)
As reported by Henock and Oktay (2014), different methods have been applied in the
literature. For instance, Francis et al (2014) use the gravity model to show a higher
increase in cross-border M&A transactions for “paired-adopting countries” compared to
“non-paired adopting countries” following the adoption of IFRS in 2005. However, this
approach is not appropriate to address the research question investigated in the present
paper as the gravity model only seizes the total amount of investments between two
countries. Therefore, it cannot provide an estimate for the probability of a cross-border
transaction by simultaneously considering all the IFRS adopting countries.
Alternatively, the average change in the values of the transactions, before and after
for endogenous factors that could impact on the value of the deals. Moreover, using the
transaction value as the dependent variable may lead to ambiguous interpretations, since
the result would not only comprise the effect of the improved comparability of financial
statements, but also the impact of a changed quality of reporting. (Henock and Oktay,
2014).
4.2 The base model: a control approach
Provided that mergers and acquisitions are not of equal size, the value of each
transaction is included in the model so as to seize and isolate the influence of IFRS on
overseas transactions. In this way, following the same approach used by Henock and
Oktay (2014), it is possible to liken the odds of a cross-border acquisition of an IFRS
adopting company, before and after the enforced adoption, while controlling for the size
of the deal.
The estimates are modeled using the following logit regression equation and the
statistical software STATA:
CBi = β0 + β1ANND + β2TVAL + control variables + εi
CB is the dependent dummy variable assuming value one when deals are carried
overseas and zero when they are completed in the domestic country.
ANND is the explanatory variable taking the value one for M&As whose announcement
date is made in the post-adoption period between July 1, 2006 and December 31, 2010
and zero for announcements done in the pre-adoption period, between January 1, 2000
and December 31, 2004. I exclude the transactions completed during 2005 due to the
31, 2006 and the gathering of financial information for M&A objectives usually
requires a discrete amount of time.
The estimation obtained by the coefficient on ANND gives the difference between the
logit likelihood of a cross-border transaction before and after the IFRS implementation.
Indeed, since the model considers the deals as given, a positive β1 reasonably explains
increased cross-border M&As, keeping constant their relative transaction values.
TVAL is the explanatory variable embodying the value (in U.S. dollars) of each
transaction. Specifically, the values have been rescaled and expressed in natural
logarithm amounts so as to facilitate the comparison of a large range of values.
Besides, it is necessary to control for possible factors that can influence the amount of
deals occurred in a given country. For this purpose, the control variables entered refer to
economic factors and test for the GDP growth, the population growth, the inflation rate,
the currency exchange rate, the ratio of GNP to GDP and the inter bank rate in every
year and in every country included in the sample examined.
Furthermore, observing the effect of IFRS adoption on cross-border M&As over
different time periods might bear a problem known as “spurious regression”, that is a
strong statistical relationship between two or more variables not driven by any
underlying casual connection (Studenmund, 2011). Variables following a steadily
change over time may lead to false results. As a consequence, to solve the issue and
take into account a possible trend started before the IFRS mandatory adoption, a time
Finally, country and year fixed effects are also included in the model, carefully
dropping the time trend and other specific variables in order to avoid collinearity issues
when those are introduced. They allow controlling for specific factors and differences
across units, whether observable or unobservable, which are constant over time.
Including them into the regression partially removes one source of possible omitted
variables bias (Berry, 2011). Namely, country fixed effects permit to control for
constant effects that influence the deals in a given country throughout the period
considered, and the year fixed effects control for effects occurring in a given year
having an impact on the deals.
Despite the economic control variables, the time trend and the fixed effects, there could
still be causes not related to the IFRS adoption that may have the effect of increasing
the odds of a cross-border transaction. Accordingly, to better stand the improved
comparability of accounting reports after the IFRS adoption, the companies’ listing
status is used as an identification tool: given that IFRS is only mandatory for listed
firms, the listing status can be useful to identify the IFRS adoption effect and to
eliminate residual sources of ambiguous results that the control variables and the fixed
effects are not able to detect.
Lastly, target companies from IFRS non-adopting countries are taken into consideration
as a control sample (Henock and Oktay. 2014). As a result, the base model is extended
to be compared with the control groups as follows:
CBi = β0 + β1 ANND + β2 TVAL + β3 LISTED + β4 ADOPT + β5 ANND*LISTED +
β6ADOPT*LISTED + β7 ANND*ADOPT + β9 ANND*LISTED*ADOPT +
LISTED is a dummy variable taking the value one for listed companies and zero
otherwise and ADOPT is also a binary variable, assuming the value one if the target
being acquired is from IFRS adopting countries and zero if not.
The ANND*LISTED, ADOPT*LISTED, ANND*ADOPT and ANND*LISTED*ADOPT
interaction terms are included in order to discern between the direct and the indirect
effect that each variable carries on the odds of cross-border M&As and to deepen the
explanations concerning the effect of the IFRS adoption.
In particular, the coefficients relative to each variable, taken as stand-alone terms,
explain the direct effect, while the coefficients relative to the interaction terms describe
the indirect effect (Studenmund, 2011). For instance, ANND gives the difference
between the effect of a cross-border transaction before and after the IFRS
implementation and ANND*LISTED measures the same difference by also comparing
listed and unlisted target firms. That is, for each value of LISTED (zero or one) there is
a different marginal effect of ANND on CB.
To conclude, heteroskedasticity is also taken into consideration. Although it is more
likely to occur in cross-sectional models rather than in time-series, it is not always
realistic to assume constant variance for different observations of the error term
(homoscedasticity). The violation of this assumption does not lead to biased estimates
of the βi, but to biased relative standard errors. A simple method to solve the potential
heteroskedasticity is to regress the equation with heteroskedasticity-robust standard
5. Results
5.1 Univariate analysis
This section compares cross-border M&A deals, before and after the IFRS mandatory
adoption, assessing the effect triggered by one single explanatory variable, the ANND
variable. The coefficient on this term (β1) is able to capture the difference in foreign
transactions before and after 2005. Specifically, I predict a positive coefficient due to an
increase in cross-border activities.
The two-sided hypotheses test is run over three samples: listed targets from IFRS
adopting countries, unlisted targets from IFRS adopting countries and listed targets
from IFRS non-adopting countries. The first group is compared against the other two so
as to obtain a measure of the effect that the common set of accounting principles have
on the likelihood of cross-border M&As.
Table 5.1 below reports, for the treated samples, both the proportion of acquisitions
completed overseas, before and after the IFRS adoption, and the results of the univariate
regression analysis. It is possible to observe a considerable higher proportion of
cross-border M&As of listed targets from IFRS adopting countries after the principles
adoption. The ratio, equal to 0.539 (54%) is higher when compared to foreign
acquisitions of unlisted targets from IFRS adopting countries (49.5%), but lower when
contrasted to those of listed targets from IFRS non-adopting countries (58%).
Nevertheless, the estimated coefficients confirm the predicted positive effect of the
IAS/IFRS adoption: the odds of foreign M&A activities is statistically significant higher
unlisted targets from IFRS adopting countries, 0.278, and listed targets from IFRS
non-adopting countries, 0.422.
However, implementing the logit regression model requires particular attention when
interpreting the results of the equations: the absolute size of logit coefficients is
different from those estimated with the OLS model, given the same data and the same
regression equations4. One way to obviate and facilitate the interpretation is to divide by
four the logit coefficients to directly analyze the marginal effect of the variables. In this
way it is possible to state that, all else equal, the effect of IFRS adoption increased the
odds of cross-border M&As of listed firms from adopting countries by 11.7%, a higher
probability than those of unlisted adopting companies and listed targets from
non-adopting countries, equal to 6.2% and 6.3% respectively.
Table 5.1: Cross-border M&A deals before and after the IFRS mandatory adoption Listed targets from
IFRS adopting countries (N = 9,713)
Unlisted targets from IFRS adopting
countries (N = 18,001)
Listed targets from IRS non-adopting
countries (N = 16,486)
Pre-adoption proportion 0.461
(N = 4474)
0.505 (N = 9087)
0.420 (N = 6924)
Post-adoption proportion 0.539
(N = 5239)
0.495 (N = 8914)
0.580 (N = 9562)
annd(Logit likelihood) 0.504
(0.000)
0.278 (0.000)
0.422 (0.000)
annd(marginal effect) 0.117
(0.000) 0.062 (0.000) 0.063 (0.000) 4
5.2 Multivariate analysis
Although the univariate analysis provides a positive evidence for the effect investigated
in this research, a definitive inference cannot be performed without considering the
values of the deals and the control variables. With this purpose, this section runs the
extended version of the base model over a set of different samples: listed targets from
IFRS adopting countries, listed and unlisted targets from IFRS adopting and
non-adopting countries.
Table 5.2 below displays the results for the M&A transactions involving only listed
targets from the IFRS adopting countries5. The association between the IFRS adoption
and the likelihood of a cross-border transaction is now examined conditional to the deal
values, the macroeconomic control variables and the time trend. In addition, column (2)
reports the estimates accounting for the country fixed effects to control for possible
constant influences affecting the deals in a given country throughout the period
analyzed.
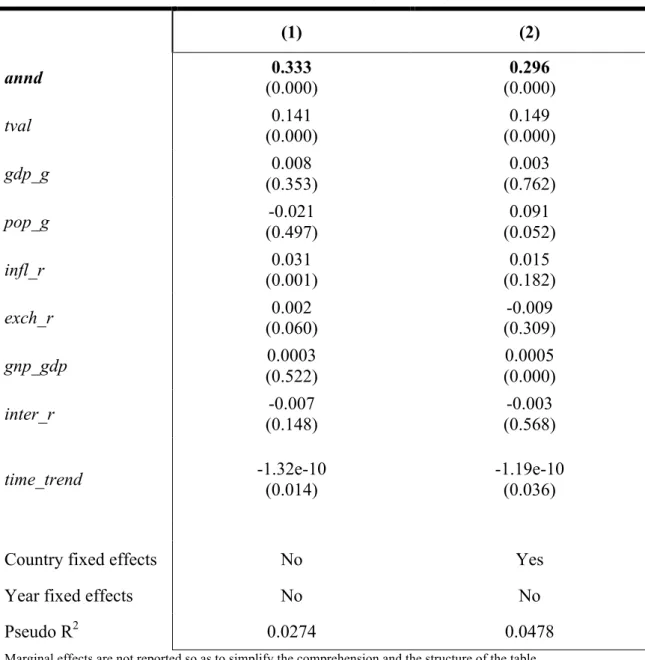
The estimated coefficient on ANND under column (1) shows a significant positive effect
on the odds of foreign M&A activities. Now the estimate is equal to 0.333, everything
else kept constant. This means that the probability of a transaction being completed
overseas, after the adoption of IFRS, is roughly equal to 8%. Moreover, the evidence
still holds when country fixed effects are included in the regression: the within-country
difference in the logit odds of cross-border M&A before and after the IFRS adoption is
positive and statistically significant, equal to 0.296, equivalent to a 7.4% probability.
5
Table 5.2: The effect of the IFRS mandatory adoption - Base model
Listed targets from IFRS adopting countries (N = 9,713)
(1) (2)
annd 0.333
(0.000)
0.296 (0.000)
tval 0.141
(0.000)
0.149 (0.000)
gdp_g 0.008
(0.353)
0.003 (0.762)
pop_g -0.021
(0.497)
0.091 (0.052)
infl_r 0.031
(0.001)
0.015 (0.182)
exch_r 0.002
(0.060)
-0.009 (0.309)
gnp_gdp 0.0003
(0.522)
0.0005 (0.000)
inter_r -0.007
(0.148)
-0.003 (0.568)
time_trend -1.32e-10
(0.014)
-1.19e-10 (0.036)
Country fixed effects No Yes
Year fixed effects No No
Pseudo R2 0.0274 0.0478
Marginal effects are not reported so as to simplify the comprehension and the structure of the table.
Following, the model is run over the whole set of listed and unlisted IFRS adopters,
which is then benchmarked against the whole sample of listed and unlisted targets from
IFRS-non adopting countries. In this way, it is possible to capture the incremental effect
of listed IFRS adopting targets relative to the unlisted ones. As previously explained,
attention is now directed towards the interpretation of the interaction term coefficient
and its comparison between the IFRS adopting and non-adopting firms.
The results are reported in Table 5.3 below, where the estimates obtained including the
year fixed effects are shown under column (3). In particular, the ANND and the time
trend variables must be dropped when considering those effects, which potentially occur
every year in the examined countries and that may impact on the deals comprised in the
dataset. Indeed, their effect is already explained by the year fixed effects and including
the three terms simultaneously would lead to collinearity issues.
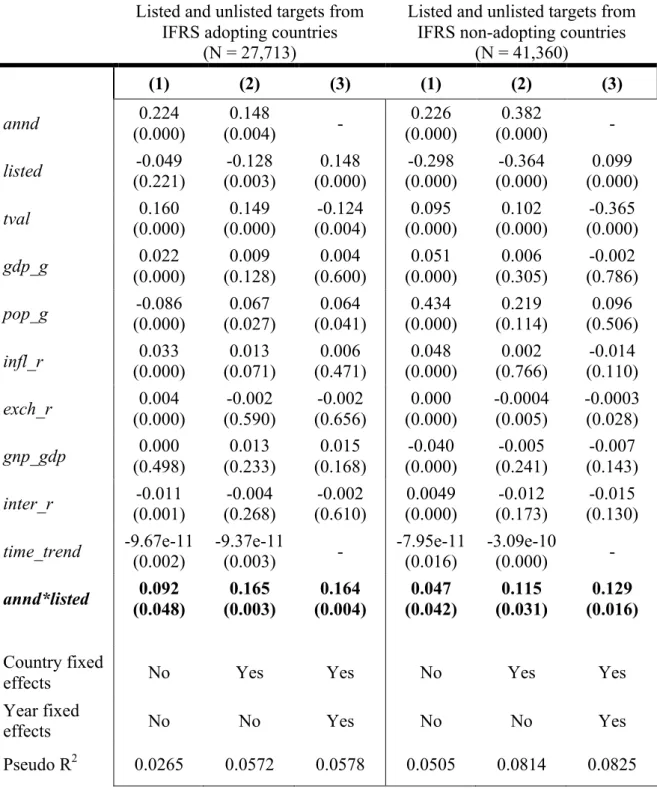
Looking at the outcomes attained for the listed and unlisted companies from IFRS
adopting countries it is possible to observe positive coefficients both on ANND (0.224 ≈
5.6%) and on the interaction term ANND*LISTED (0.092≈ 2.3%), thus confirming the
increased likelihood of cross-border M&As after the mandatory IFRS adoption. In
particular, it is relevant to notice that once the country and year fixed effects are taken
into account, the effect measured by ANND*LISTED increases when compared to the
base model: if the company is a listed adopting target, the odds of a transaction
completed overseas after the IFRS adoption is higher, equal to 4.5% and 4.1%
respectively, than the probability of cross-border M&As of unlisted adopting targets.
The evidence is in turn strengthened when the estimates are benchmarked against the
listed and unlisted targets from IFRS non-adopting countries. Despite reporting positive
and higher coefficients on the ANND variable, those relative to the ANND*LISTED are
odds of foreign transactions carried in the IFRS non-adopting countries, equal to 1.2%,
and to 2.9% and 3.5% including country and year fixed effects respectively.
Table 5.3: The effect of the IFRS mandatory adoption. Benchmarking against listed and unlisted targets from IFRS non-adopting countries.
Listed and unlisted targets from IFRS adopting countries
(N = 27,713)
Listed and unlisted targets from IFRS non-adopting countries
(N = 41,360)
(1) (2) (3) (1) (2) (3)
annd 0.224
(0.000)
0.148
(0.004) -
0.226 (0.000)
0.382
(0.000) -
listed -0.049
(0.221) -0.128 (0.003) 0.148 (0.000) -0.298 (0.000) -0.364 (0.000) 0.099 (0.000)
tval 0.160
(0.000) 0.149 (0.000) -0.124 (0.004) 0.095 (0.000) 0.102 (0.000) -0.365 (0.000)
gdp_g 0.022
(0.000) 0.009 (0.128) 0.004 (0.600) 0.051 (0.000) 0.006 (0.305) -0.002 (0.786)
pop_g -0.086
(0.000) 0.067 (0.027) 0.064 (0.041) 0.434 (0.000) 0.219 (0.114) 0.096 (0.506)
infl_r 0.033
(0.000) 0.013 (0.071) 0.006 (0.471) 0.048 (0.000) 0.002 (0.766) -0.014 (0.110)
exch_r 0.004
(0.000) -0.002 (0.590) -0.002 (0.656) 0.000 (0.000) -0.0004 (0.005) -0.0003 (0.028)
gnp_gdp 0.000
(0.498) 0.013 (0.233) 0.015 (0.168) -0.040 (0.000) -0.005 (0.241) -0.007 (0.143)
inter_r -0.011 (0.001) -0.004 (0.268) -0.002 (0.610) 0.0049 (0.000) -0.012 (0.173) -0.015 (0.130)
time_trend -9.67e-11 (0.002)
-9.37e-11
(0.003) -
-7.95e-11 (0.016)
-3.09e-10
(0.000) -
annd*listed 0.092
(0.048) 0.165 (0.003) 0.164 (0.004) 0.047 (0.042) 0.115 (0.031) 0.129 (0.016) Country fixed
effects No Yes Yes No Yes Yes
Year fixed
effects No No Yes No No Yes
Pseudo R2 0.0265 0.0572 0.0578 0.0505 0.0814 0.0825
To conclude, the analysis is conducted over the sample combining listed and unlisted
firms both from IFRS adopting and non-adopting countries, thus providing an additional
benchmark to support the evidence observed so far. As a result, it is now possible to
include the dummy variable ADOPT, taking the value one if the targets firm is from
IFRS adopting countries and zero if otherwise. In this way, the sample provides the
opportunity to build additional interaction terms so as to extend the measurement of the
IFRS mandatory adoption over the odds of cross-border M&As.
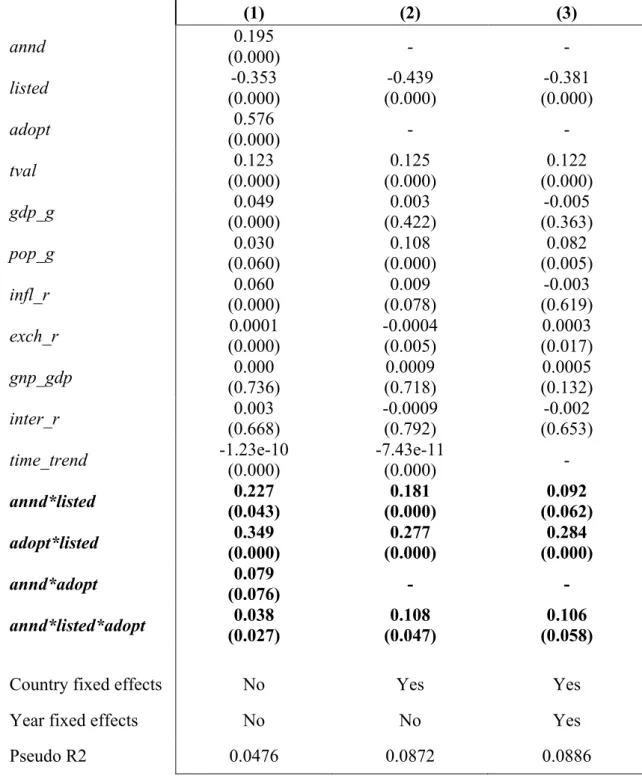
The ADOPT*LISTED gives a measure of the incremental effect of the listed IFRS
adopting firms, relative to the unlisted ones, the ANND*ADOPT captures the
incremental effect of the IFRS adopting companies, relative to the non-adopting, and
lastly, the ANND*LISTED*ADOPT provides the measures of the incremental effect of
the listed targets from IFRS adopting countries.
Table 5.4 below reports the results obtained running the test on the latest extended
version of the base model. Column (2) and (3) shows the outcomes comprising country
and year fixed effects, and the appropriate variables are dropped so as to avoid
collinearity bias each time one of the interaction terms already describes the relative
explanatory effect.
Once more, the results prove the positive effect of the IFRS mandatory adoption: the
whole set of interaction terms present significant positive coefficients. Specifically, the
estimate on ANND*LISTED*ADOPT, the most interesting variable to observe now, is
equal to 0.95% in the base model under column (1), which however is not particularly
high. Nevertheless, when country and year fixed effects are taken into account, the
the IFRS are higher, equal to 2.7% and 2.65% respectively, than the likelihood of
foreign transactions carried by companies from IFRS non-adopting countries.
Table 5.4: The effect of the IFRS mandatory adoption. Benchmarking against listed and unlisted targets from IFRS non-adopting countries.
Listed and unlisted targets from the IFRS adopting and non-adopting countries
(N = 69,074)
(1) (2) (3)
annd 0.195
(0.000) - -
listed -0.353
(0.000)
-0.439 (0.000)
-0.381 (0.000)
adopt 0.576
(0.000) - -
tval 0.123
(0.000)
0.125 (0.000)
0.122 (0.000)
gdp_g 0.049
(0.000)
0.003 (0.422)
-0.005 (0.363)
pop_g 0.030
(0.060)
0.108 (0.000)
0.082 (0.005)
infl_r 0.060
(0.000)
0.009 (0.078)
-0.003 (0.619)
exch_r 0.0001
(0.000)
-0.0004 (0.005)
0.0003 (0.017)
gnp_gdp 0.000
(0.736)
0.0009 (0.718)
0.0005 (0.132)
inter_r 0.003
(0.668)
-0.0009 (0.792)
-0.002 (0.653)
time_trend -1.23e-10
(0.000)
-7.43e-11
(0.000) -
annd*listed 0.227
(0.043)
0.181 (0.000)
0.092 (0.062)
adopt*listed 0.349
(0.000)
0.277 (0.000)
0.284 (0.000)
annd*adopt 0.079
(0.076) - -
annd*listed*adopt 0.038
(0.027)
0.108 (0.047)
0.106 (0.058)
Country fixed effects No Yes Yes
Year fixed effects No No Yes
6. Observations to the model
The study conducted and presented above provides a valuable support to the expected
positive influence of the IAS/IFRS mandatory adoption on the probability of
cross-border M&A transactions. Nevertheless, given the complexity of the dataset
construction and the vast literature behind the topic, it is wise to ponder possible
limitations of the model and consider some features of the research that could be
improved.
One possible source of bias in the obtained estimates could be recognized in the way the
dataset is built. Indeed, when analyzing the effect of IFRS adoption on firms belonging
to IFRS adopting countries two issues should be taken into account.
First, the directive ruling the mandatory adoption of the accounting principles in 2005
only comprised companies in the EU. Thus, it is necessary to construct the database so
as to include non-EU countries that adopted the IAS/IFRS system either in 2005 or few
years later (Panel 2.B in the appendix reports the adoption year for each country)6.
Otherwise, the difference between the pre and the post adoption moment would have
been harder to capture.
Second, it should be observed that the results obtained for the M&A deals completed in
IFRS adopting countries might slightly underestimate the positive effect of the IFRS
adoption on cross-border M&A. The reason is that most likely some of the adopting
countries already implemented accounting rules similar to the IAS/IFRS principles, or it
is possible that convergence processes had previously started. In that case, the
6
difference between the pre and the post adoption date might be less evident and the true
effect of an increased comparability of financial statement might be underrated.
Relatedly, the model could be further extended following Henock and Oktay’s approach
(2014). They also test if the positive effect of the mandatory adoption of IFRS on EU
members can be attributed to parallel financial reporting enforcements, and whether the
increased cross-border transactions is driven by higher economic activities within the
EU registered between 2004 and 20077. They find no evidence supporting that the IFRS
effect is due to M&A transactions into the EU countries, and they also suggests that a
stronger regulatory environment could actually complicate foreign investments, thus
having a negative influence.
Another way to further extend the research would be analyzing the effect of the IFRS
adoption looking at the acquirer companies. The dataset would be built so as to combine
samples involving M&A deals for target firms from IFRS adopting countries completed
overseas by adopter or non-adopter acquirers. Again, the test over the hypothesis that
the improvement in the comparability of financial statements among the adopting
countries enhances cross-border activity would be run.
To conclude, it is worth explaining that the corporate tax-rate for each country would
have represented a valuable control variable to comprise in the model, as the corporate
taxation system can considerably vary across country, having different influences on the
completion of M&A transactions. However, data are not available for the countries
examined during the period considered.
7. Conclusion
This research tests the hypothesis that the mandatory implementation of IAS/IFRS is
likely to improve the comparability of financial statements among adopting countries,
facilitating and enhancing cross-border corporate transactions.
With this purpose, a logit model is run over a set of different samples so as to
benchmark the attained results: listed and unlisted targets from IFRS adopting countries
are examined, as well as listed and unlisted targets from IFRS non-adopting countries.
Indeed, since the IFRS adoption is only mandatory for listed firms, the target firms’
listing status is used as detection mean to properly identify the IFRS adoption effect.
The attained results support the predicted enhancement of cross-border M&As
following the mandatory adoption of IFRS and reinforce the evidence proved in Henock
and Oktay (2014). Specifically, the current analysis sets sights on completing the
explanations of the authors’ outcomes by analyzing the deals in a greater number of
countries and by additionally running the model over the combined set of listed and
unlisted targets from adopting and non-adopting countries. In this way, the target firms’
“adopting status” is used to catch the incremental effect on the likelihood of overseas
transaction of listed IFRS adopting companies, relative to the non-adopting ones.
To sum up, the control approach highlights a stronger positive influence on the odds of
foreign M&A transactions for listed targets from IFRS adopting countries compared to
unlisted adopting targets and listed non-adopting targets. Furthermore, the outcome is
strengthened by the indication that the increase in overseas investments is greater for the
References
Berry, Christopher R. 2011. “Fixed Effects”, Chicago: The University of Chicago. Available at:http://harris.uchicago.edu/Blogs/EITM/wp-content/uploads/2011/06/Fixed-Effects-Lecture1.pdf
Christensen, Hans B., Edward Lee, and Martin Walker. 2008. “Incentives or standards: What determines accounting quality changes around IFRS adoption?” Available at SSRN: http://ssrn.com/abstract=1013054.
Daske, Holger, Luzi Hail, Christian Leuz, and Rodrigo S. Verdi. 2008. “Mandatory IFRS Reporting Around the World: Early Evidence on the Economic Consequences.” Initiative on Global Markets. The University of Chicago, Graduate School of Business, 2-7.
European Parliament and European Council. 2012. “Regulation (EC) No. 1606/2002 on the application of international accounting standards”. Article no.1-4.
DeFond, Mark, Xuesong Hu, Mingyi Hung, and Li Siqi. 2010. “The Impact of Mandatory IFRS Adoption on Foreign Mutual Fund Ownership: The Role of
Comparability”. SCU Leavey School of Business Research Paper No. 09-06. Available
at SSRN: http://ssrn.com/abstract=1473889, 2-6.
FASB. 2015. “Comparability in International Accounting Standards – A brief history”.
Available at: http://www.fasb.org/jsp/FASB/Page/SectionPage&cid=1176156304264
Henock, Louis, and Urcan Oktay. 2014. “The effect of IFRS on cross-border acquisitions.” Available at SSRN: http://ssrn.com/abstract=2164995, 9-22.
Naranjo, Patricia, Daniel Saavedra, and Rodrigo S. Verdi. 2012. “IFRS Adoption
and Financing Decisions”. Massachusetts Institute of Technology working paper, 5-6.
Rita, Yip W., and Danging Young. 2012. “Does Mandatory IFRS Adoption Improve
Information Comparability? ”. The Accounting Review, Vol. 87, No.5. 3-8.
Rossi, Stefano, and Paolo Volpin. 2004. “Cross-country determinants of mergers and
acquisitions”. Journal of Financial Economics, 2-3.
Appendix
The tables relevant for the comprehension of the work are already included in the text. Here further information is reported in order to provide additional insights to the research.
Table A.1: Variables description.
annd Dummy variable taking the value one for cross-border M&A transaction
and zero for domestic transactions.
listed Dummy variable taking the value one for listed target firms and zero for unlisted target firms.
adopt Dummy variable taking the value one for target firms from IFRS adopting and zero for target firms from IFRS non-adopting countries.
tval Natural logarithm of the transactions total value (US dollars).
gdp_g Annual growth rate in the GDP of the target’s country.
pop_g Annual growth rate in the population of the target’s country.
infl_r Annual inflation rate of the target’s country.
exch_r Annual exchange rate fluctuations of the target’s currency relative to US dollars.
gnp_gdp Annual ratio of the target’s annual economic activity over the annual GDP rate.
inter_r Annual interbank lending rate of the target’s country.
Table A.2: Sample distributions
Panel 2.A: Target companies from IFRS adopting countries. Distribution by year.
Listed Unlisted
Year Frequency Percentage Frequency Percentage
2000 972 10.01% 2560 14%
2001 876 9.02% 1815 10%
2002 791 8.14% 1355 8%
2003 942 9.70% 1525 8%
2004 893 9.19% 1832 10%
2006 576 5.93% 1348 7%
2007 1309 13.48% 2725 15%
2008 1198 12.33% 2089 12%
2009 1080 11.12% 1256 7%
2010 1076 11.08% 1496 8%
Total 9713 100% 18001 100%
Source: Thomson One Database
Panel 2.B: Distribution by IFRS adopting countries.
IFRS adopting countries
Listed Unlisted Year of
adoption
Country Frequency Percentage Frequency Percentange
Australia 2534 26.09% 2546 14.14% 2005
Austria 54 0.56% 76 0.42% 2005
Belgium 114 1.17% 218 1.21% 2005
Denmark 113 1.16% 258 1.43% 2005
Finland 99 1.02% 241 1.34% 2005
France 740 7.62% 1185 6.58% 2005
Germany 461 4.75% 774 4.30% 2005
Greece 113 1.16% 137 0.76% 2005
Hong Kong 1034 10.65% 928 5.16% 2005
Hungary 40 0.41% 72 0.40% 2005
Israel 127 1.31% 195 1.08% 2008
Italy 306 3.15% 901 5.01% 2005
Netherlands 180 1.85% 332 1.84% 2005
New Zealand 208 2.14% 297 1.65% 2007
Norway 334 3.44% 345 1.92% 2005
Philippines 137 1.41% 133 0.74% 2005
Poland 189 1.95% 381 2.12% 2005
Portugal 117 1.20% 201 1.12% 2005
Singapore 429 4.42% 624 3.47% 2003
South Africa 220 2.27% 303 1.68% 2005
Spain 302 3.11% 1108 6.16% 2005
Sweden 264 2.72% 637 3.54% 2005
Switzerland 159 1.64% 183 1.02% 2005
Turkey 76 0.78% 171 0.95% 2006
United Kingdom 1309 13.48% 5452 30.29% 2005
Total 9713 100.00% 18001 100%
Source: Thomson One Database
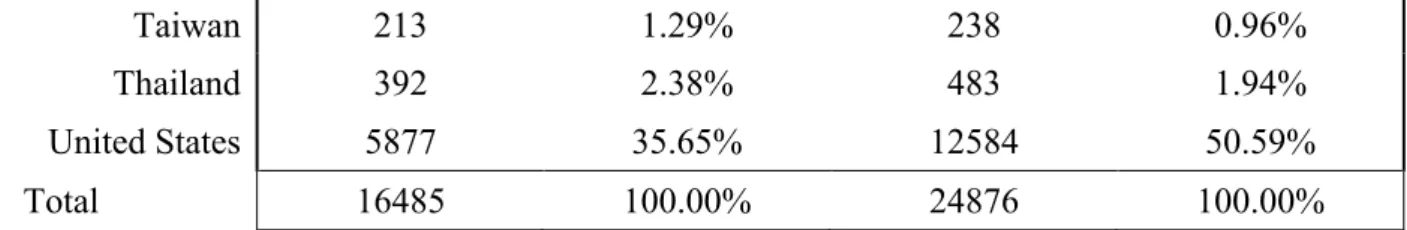
Panel 2.C: Distribution by IFRS non-adopting countries.
IFRS non-adopting countries
Listed Unlisted
Frequency Percentage Frequency Percentage
Argentina 80 0.49% 225 0.90%
Canada 2265 13.74% 2924 11.75%
China 811 4.92% 2314 9.30%
India 1239 7.52% 739 2.97%
Indonesia 256 1.55% 282 1.13%
Japan 4187 25.40% 2739 11.01%
Malaysia 368 2.23% 1045 4.20%
Mexico 88 0.53% 204 0.82%
Pakistan 20 0.12% 11 0.04%
Peru 64 0.39% 68 0.27%
Taiwan 213 1.29% 238 0.96%
Thailand 392 2.38% 483 1.94%
United States 5877 35.65% 12584 50.59%
Total 16485 100.00% 24876 100.00%
Source: Thomson One Database
Table A.3: Descriptive statistics for IFRS adopting countries.
Pre-adoption
Listed (N = 4,474) Unlisted (N = 9,087)
Variable Mean St. Dev. Min Max Mean St. Dev. Min Max
tval 16.78 2.51 6.91 25.05 15.50 1.98 6.91 22.91
gdp_g 3.18 2.12 -5.7 9.55 3.29 1.86 -5.7 9.55
pop_g 0.79 0.63 -1.47 2.73 0.75 0.58 -1.47 2.73
infl_r 2.17 4.36 -3.69 54.92 2.07 3.27 -3.69 54.92
exch_r 5.06 22.17 0.55 286.49 3.50 18.34 0.55 286.49
gnp_gdp 101.39 143.93 83.12 9724 99.36 2.79 83.12 107.55
inter_r 5.79 7.97 0.09 183.2 5.05 5.77 0.09 183.2
time_trend 9.43e+08 5.83e+08 0 1.61e+09 8.59e+08 6.18e+08 0.00e+00 1.61e+09
Post-adoption
Listed (N = 5,239) Unlisted (N = 8,914)
Variable Mean St. Dev. Min Max Mean St. Dev. Min Max
tval 16.88 2.67 8.85 25.31 15.87 1.99 6.91 23.28
gdp_g 2.27 3.10 -8.77 15.2 2.07 3.08 -8.77 15.2
pop_g 1.16 0.87 -0.28 5.47 0.96 0.80 -0.28 5.47
infl_r 2.66 1.58 -4.48 11.54 2.69 1.63 -4.48 11.54
exch_r 3.36 10.69 0.5 210.39 2.86 11.70 0.5 210.39
gnp_gdp 99.16 2.94 82.89 107.71 99.55 2.99 82.89 107.71
inter_r 3.84 2.41 -0.5 17.5 3.68 2.53 -0.5 17.5