A Work Project presented as part of the requirements for the Award of a Masters Degree in Management from the Nova School of Business and Economics
Ben & Jerry’s
A case study on children’s social
awareness and its impact on corporate
strategy
#571 Inês Peso de Oliveira Barros
June 2011
1 Abstract
Purpose: Address whether children are aware of socially responsible action taken by
companies, commonly named Corporate Social Responsibility (CSR). Additionally, the
study will analyse which type of CSR actions (environmental or social actions) has
greater impact on children.
Methodology: Structured questionnaires were conducted to a sample composed by 191
5th and 6th graders from a Portuguese public school after a presentation of the brand. A
real brand was used and an industry of interest to children. Ben & Jerry’s was chosen
due to its CSR initiatives and the general liking of ice creams by children. Children had
no previous awareness of the brand.
Findings: The results suggest that, in the parameters of this study, CSR actions do not
create increased equity to the brand and based on these results managerial implications
were analysed.
Research Limitations/Implications: This study faults in the fact that it considers a
very limited sample in a limited environment. Further studies should consider a broader
sample and a brand with higher levels of awareness.
Originality: While there is extensive research regarding the impact of CSR initiatives
in adults, there is not so much focus on the effect on children. As children represent an
enormous market opportunity, it became relevant to access how the exposure to this
type of actions affects the child-brand relationship, in terms of brand perceptions,
namely image, and in terms of purchase intentions regarding the brand.
Keywords: Corporate Social Responsibility (CSR), Children, Brand Image, Future
2 Literature Review
Corporate Social Responsibility initiatives are becoming a trend nowadays and gaining
place as a high value strategic move by companies. According to Business Week
(Berner, 2005), companies are doing substantial investments in CSR initiatives and,
quoting Luo and Bhattacharya (2006:1), “as many as 90% of the Fortune 500
companies now have explicit CSR initiatives”. Yet, even with this increasing
importance of CSR, there still is uncertainty as how CSR should be defined both in the
corporate and academic world (Dhalsrud, 2006). There are several possible definitions
and, for the purpose of this paper, we adopted the one from the European Commission,
which conveys CSR as “a concept whereby companies integrate social and
environmental concerns in their business operations and in their interaction with their
stakeholders on a voluntary basis”1.
Many studies have been done regarding the effect of CSR in adults’ attitudes towards
the brand, and as Lichtenstein, Drumwright and Braig (2004) found, CSR initiatives by
the company result in an array of corporate benefits, such as more favourable corporate
evaluation by consumers, and increased purchase behaviour. However, Bhattacharya
and Sen (2004:12) consider that “CSR activities have greater impact on outcomes
“internal” to the consumers (e.g. awareness, attitudes and attributions) than its impact
on “external” or visible outcomes (e.g. purchase behavior)”.
Although the scientific community agrees that CSR has an impact in consumers’
mindset and evaluation of companies, conclusive research is still needed on whether
that impact translates to purchase behavior.
Regardless, an extensive amount of research has been done on CSR effects on
consumers, and we can already find several well documented dimensions were CSR
1
3
influences people’s perception. In fact, many of those dimensions have been clearly
expressed by Luo & Battacharya (2006) as either direct or indirect consumer product
responses, customer-company identification, customer donations to nonprofit
organizations and customers’ product attitude.
Given the prior influences proven to exist in adults, it is relevant to understand if and
how CSR affects children’s relationship with brands.
Children buying power has been increasing exponentially over the years both by their
discretionary income and their power to influence parents’ purchases (Calvert, 2008).
Globally the children’s market is worth $1.33 trillion (Nairn, 2009), thus companies
need to go forward in this market. Basically, when advertising to children, following
Ranjbarian et al. (2010), there are three main objectives: affect children directly as
consumers, affect parents indirectly through children’s pester power and influence
children with positive brand association since they represent a future market, meaning
influencing three markets at once.
Another factor that can justify the need for such a study is that advertising a brand to
children through CSR initiatives may also be less criticized by society. Advertising to
children is being truly condemned in part because marketing to children essentially
promotes behavioural norms and now companies’ motivation seem to be only profit
driven (Preston, 2005), thus the use of CSR may show other stimulus.
It is pertinent, however, to study the impact of CSR on children in an industry that is
relevant to them. Considering McNeal (1992), the food industry is the one where
children spend most of their money. Ben & Jerry’s (B&J) seemed to be an interesting
brand for study since it gas CSR actions and belongs to and industry that truly
4
policy) and environmental (recycling, climate neutral freezers, etc.) issues2. Even
though B&J do not advertise its actions directly to children since its target is from 18 to
34 years old, after a discussion with the brand manager it became possible to use the
ideal of the brand for the purpose of this study. Therefore B&J brand was used.
Hypotheses
The aim of the study is to understand the impact of CSR initiatives on the child-brand
relationship, being child brand relationship defined as “a voluntary or imposed bond
between a child and a brand characterized by a unique history of interactions and is
intended to serve developmental and social-emotional goals in the child’s life” (Ji,
2008:605). With this in mind, the hypotheses are formed, concerning the main variables
regarding a consumer-brand relation, being them brand image that assess how
customers perceive and evaluate brands and purchase behaviour, and a third
hypothesis that concerns the most effective matter of CSR to reach children.
It is relevant to look at the different social classes, however, since we are considering
the influence of CSR - an added value of a brand - on children. According to Belk et al.
(1984), children from lower social classes have a greater material concern than those
from higher social classes where material possessions are more readily available and
thus are not sufficient for prestige. Therefore we can infer that the existence of CSR
actions may have greater impact on children from higher social classes, and this was
taken into account when hypothesizing. Additionally, the same authors (Belk et al.,
1984) mention that females are more sensitive and observant judges of human character
and value socially relevant cues more highly when comparing to males. Given that CSR
2
5
actions consider social values, it also allows to infer that the existence of CSR actions
may have greater impact on female children.
CSR actions & Brand Image
Brand image is defined a symbolic construct created in consumers’ minds which
includes both product information and expectations (Keller, 2008).
A new research commissioned by Costa (2010:13) for Marketing Week reveals that
“children are reacting to brands with a sophisticated awareness and strong opinions
about its coolness”, additionally they are “practiced consumers with detailed knowledge
of brands and its values”.
Considering that CSR actions bring positive brand perceptions on adults and that
children accumulate perceptions that create images regarding the brand (Ji, 2002), it is
expected that:
H1: CSR actions have a positive effect on the brand image of children in the age
considered.
H1a: CSR actions will have a higher positive effect in brand image when higher social
class is considered.
H1b: CSR actions will have a higher positive effect in brand image when females are
considered.
CSR actions & Brand Purchase
Children are gaining a place as consumers. Around age 5 children are increasingly
making individual purchases (Valkenburg and Cantor, 2001), additionally, they are
skillful at encouraging parents to purchases (Ranjbarian et al., 2010).
Consumers’ purchase behaviour can be accessed through two dimensions (Esch et al.,
6
intended future behaviour that refers to the intentions of purchase of the brand in the
future. Our hypothesis will be to test future purchase intention. Although it should be
considered that intentions may provide biased measures by underestimating or
overestimating actual purchase, it is the best estimate of actual behaviour (Young et al.,
1998) and it is an appropriate measure to examine psychological changes (Wright and
MacRae, 2007).
In adults the influence of CSR in purchase behaviour is not as noticeable as it is in
brand perceptions but it is still positive. Likewise when regarding children we can
hypothesize that the same will happen, thus:
H2: CSR actions have a positive effect in future purchase intentions of the brand by
children.
H2a: CSR actions will have a higher positive effect in future purchase intentions when
higher social class is considered.
H2b: CSR actions will have a higher positive effect in future purchase intentions
when females are considered.
Environmental issues & Social issues
Looking at the definition of CSR, and following Sandhu and Kapoor (2010), it is
observable that CSR actions focus on social, environmental and financial success of the
company.
In today’s world children are being increasingly exposed to environmental issues.
Furthermore, as Malkus and Musser (1997) state, research findings led to the premise
that children can feel positive about environmental issues and about their role in helping
the environment. Given children’s growing involvement with environmental issues, the
7
H3: CSR actions related to environmental issues have greater impact on children than
CSR actions related to social issues.
Methodology
Legal and Ethical issues
All legal and ethical requirements were taken into account. First of all, the age
considered is above six, which is considered by the food industry the minimum age to
conduct marketing actions, according to the EU Pledge signed by major food
advertisers. Also, a proper consent was gathered from the Portuguese Education
Ministry, the school where the study was conducted and the participating children’s
parents.
Additionally, all ethical issues regarding the use of children in research (Greig, Taylor
and MacKay, 2007), namely their rights and interests, mentioned in the UNICEF’s
guidelines (UNICEF, 2002) were considered.
Sample
The sample selected included children from age 10 and 11 to guarantee their full
development in the Piaget’s concrete operational stage and in the John’s analytical
stage. Looking at Piaget’s theory of cognitive development (1972) there are four
operational stages in child development. The third of the four stages is the concrete
operational stage that includes children from age 7 to age 11. In this stage children are
able to solve problems and apply reasoning to concrete objects and situations and can
consider several dimensions in a thoughtful and abstract way, which goes accordingly to
the need of the study. Additionally, looking at John (1999) and the three stages of
consumer socialization, it is observable that it is in the analytical stage (children from 7
8
marketplace and begin to make thoughtful decisions due to the ability of analysing
multiple stimuli.
308 authorizations were sent to parents of children from the 5th and 6th grade from a
public school near Lisbon. After receiving 204 authorizations from parents, the
questionnaire was conducted and there were 191 valid questionnaires. Some children
were missing class and some questionnaires were removed from the sample due to not
being completely filled or to not fulfil the parameters of the study. Children were
equally distributed per gender and per each of the three groups (Table 1).
Table 1: Sample composition
Control Group Experimental Group I Experimental Group II
Male Female Male Female Male Female
# 34 32 30 32 30 33
% within group 51,5% 48,5% 48,4% 51,6% 47,6% 52,4%
Research Design
For the purpose of this study, a small questionnaire was sent to parents with the consent
letter (appendix 1) and children were accessed through a structured questionnaire
(appendix 2).
The parents’ questionnaire gathered information on social class, measured by the level
of education, and the familiarity of children with Ben & Jerry’s brand to access
children’s level of brand awareness.
The children’s sample was randomly divided in three similar groups, one control group
and two different experimental groups. The three groups of children were exposed to
different presentations of the Ben & Jerry’s ice cream brand. For the control group the
brand was presented with no reference to any CSR action; for the experimental group I
the brand was presented as having CSR actions regarding the environment and, finally,
for the experimental group II the brand was presented as having CSR actions about
9
3) since it is appropriate and functions as a stimulus when researching with children
(Bakir et al., 2008; Belch and Belch, 2004). The three different presentations were done
in the PowerPoint software and were discussed with the educational psychologist of the
school to verify its appropriateness for the sample. After the presentation children from
the three groups filled the same questionnaire.
Measures
Likert scales were used in the questionnaire since it is a common mean to analyze
children’s level of agreement when exposed to a statement (Malhotra and Birks, 2007).
To measure brand image, a common approach is personification or metaphor of
personality traits (King, 1973), so it was proposed a projective technique that asks the
respondents to imagine that the company comes to life as a person and then rank its
personality in a likert scale from 1 “I totally disagree” to 5 “I totally agree”.
We used the Aaker (1997) scale of Brand Personality which assesses five dimensions
(Excitement, Sincerity, Competence, Sophistication and Ruggedness) and consists of 42
items (appendix 4). More recently Davies et al. (2004) created another scale named
“Corporate Character Scale” consisting of 7 dimensions and 49 items, however for the
purpose of this paper Aaker (1997) was the one used following the recommendations in
the literature (Syed Alwi and Da Silva, 2007) saying that this is a well established scale,
with a longer track record and with widely acceptance in the branding literature that can
be used across different cultural settings.
There were two options to apply the scale, either using the 42 items or, measuring the
brand image using only the 5 dimensions (Leão, 2007). In order to decide which would
be the best option, we conducted a pre-test with children to access their understanding
of the items and dimensions and their tolerance to evaluate 42 items. Three children in
10
each item when considering their favourite brand of ice cream and later, they were
asked to do the same but only considering the 5 dimensions. Regarding the items, 10 of
them were not understood by the children or it was hard for children to associate them
with a person (family-oriented, sentimental, original, daring, spirited, contemporary,
corporate, technical, western and rugged); while for the 5 dimensions they were easily
understood and rapidly answered, when compared to the items.
Moreover, the two final versions of the questionnaire, one with the items and the other
with the dimensions, were shown to an educational psychologist of the school which
said that the use of the 5 dimensions was equally appropriate however, it was less time
consuming for children which meant they would be more focused when answering.
Thus this was the chosen one.
In measuring future purchase intention it was considered two dimensions: probability
to buy the product and probability to ask their parents to buy the product. In estimating
purchase intentions we adapted the Juster Scale (Juster, 1966) which is a 11-point
probability scale that verbal, numerical and probability descriptors (appendix 5) have
shown to consistently outperform other type of scales (Brennan, 2004). However,
children in the age considered do not yet possess fully capacity to handle many
categories (John, 1999) and therefore we adapted to a 5 point probability scale from 1 “I
will definitely not buy/ask” that represented a probability of 1 in 100 (1%) to 5 “I will
definitely buy/ask” that represented the probability of 99 in 100 (99%). Furthermore,
they were asked their willingness to consume the products where the variables were 1 “I
would hate to eat this ice cream” to 5 “I would love to eat this ice cream”.
11
From the authorizations received, the first limitation of this study appeared since only
8,3% (17 authorizations) of the sample have at least one of the parents with a degree.
Therefore, analysing the differences among social classes would not be very accurate
and thus this will not be further developed in this study.
In terms of the level of awareness of children regarding the brand Ben & Jerry’s only
4,4% (9 authorizations) consumed and knew the brand beforehand. Although we
intended to measure this brand awareness through both questionnaires (parents and
children), we had to use only the parents’ questionnaire because, during the experience,
after seeing the storyboard children started correcting their answers in the beginning of
the questionnaire and filled the space where they were asked if they knew Ben &
Jerry’s. The questionnaires of the 9 children whose parents mentioned that they knew
B&J were removed so that 100% of the sample was not aware of the brand.
CSR actions & Brand Image
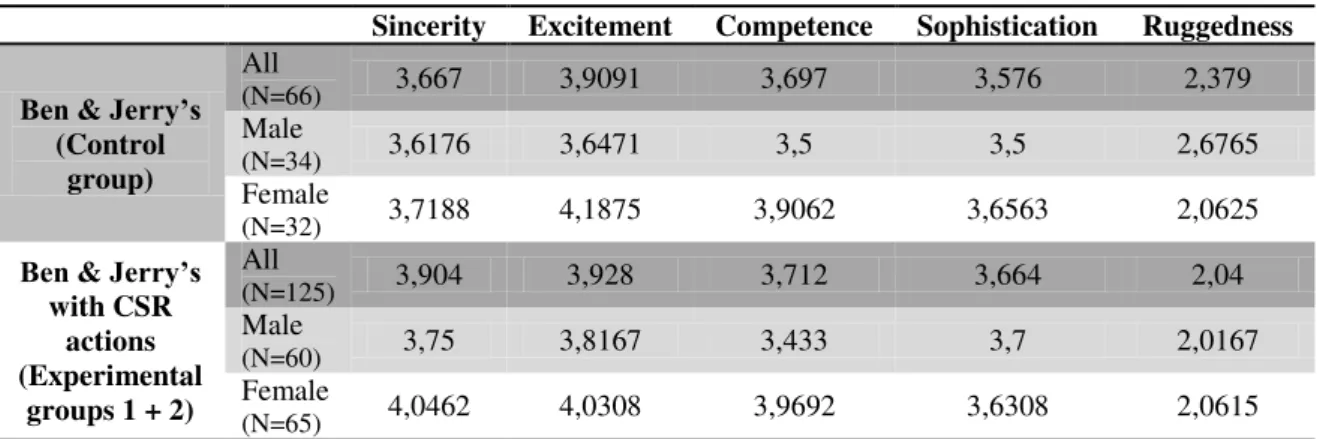
Looking at the first hypothesis stated, children should evaluate the brand Ben & Jerry’s
on a scale of 1 to 5 according to the different adjectives given. The descriptive statistics
comparing the control group with both experimental groups are shown in table 1. The
results show a small positive difference of judgement of the brand when CSR is present,
although this difference is very small in most of the cases. We conducted a Chi-Square
test (appendix 6) with a level of significance of 5% (α=0,05) to test the association
between the groups and the results confirm that there is no significant difference
between samples, except on the “sincerity” dimension and only for the female
subsample (χ2(α=0,05,d.f.=4) = 9,49, and the observed χ2 value was of 12,521).
Therefeore, we reject H1 that stated that CSR actions would bring higher image to
12
advisable for further studies to go deeper in the facets or even items of the Brand
Personality Scale.
Table 1: Means for H1 and H1b
Sincerity Excitement Competence Sophistication Ruggedness
Ben & Jerry’s
(Control group)
All
(N=66) 3,667 3,9091 3,697 3,576 2,379
Male
(N=34) 3,6176 3,6471 3,5 3,5 2,6765
Female
(N=32) 3,7188 4,1875 3,9062 3,6563 2,0625
Ben & Jerry’s
with CSR actions (Experimental
groups 1 + 2) All
(N=125) 3,904 3,928 3,712 3,664 2,04
Male
(N=60) 3,75 3,8167 3,433 3,7 2,0167
Female
(N=65) 4,0462 4,0308 3,9692 3,6308 2,0615
CSR actions & Brand Purchase
During the application of the questionnaire, two questions arose that I believe can
influence children’s intention to ask or purchase the brand. They were constrained by
the fact that they did not know the price of the ice cream neither where to buy it, and
they were reluctant to buy something they have not tried. To surpass this, a separate
analysis was performed to evaluate their likability to consume the ice cream in both
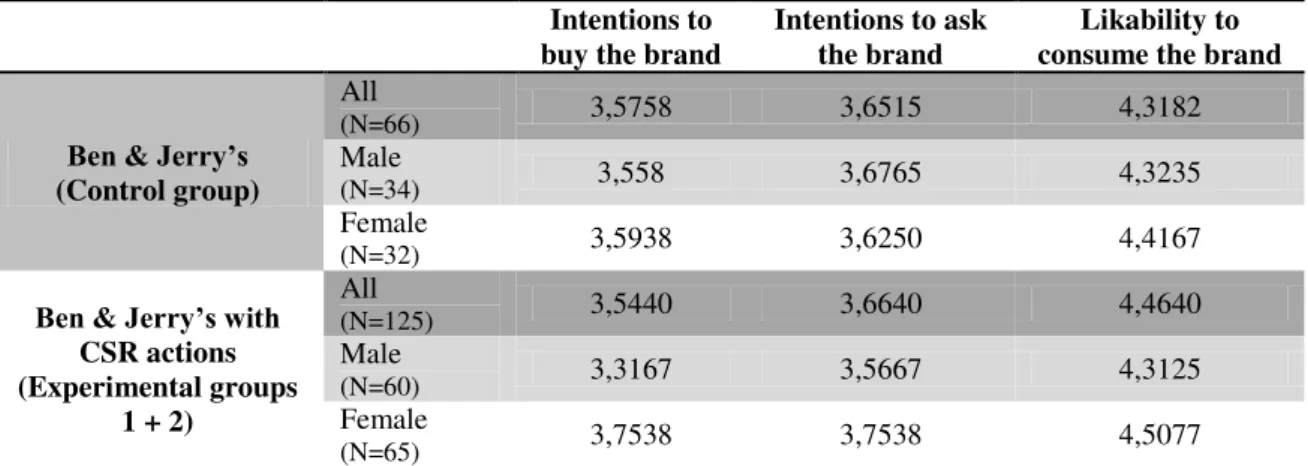
groups. Table 2 presents the mean results for each variable and subsample.
Looking at the results (appendix 7) for the variable purchase intentions (both intentions
to buy and intentions to ask) no association was found for the whole sample, and thus
there is evidence to reject H2 which stated that CSR actions would create higher
intentions to purchase of a brand. Nevertheless, and as mentioned above, it was also
analysed their likability to eat, which resulted in higher means (table 2) when compared
to when money was a factor. However, when performing the Pearson Chi-Square test
(appendix 7), the results indicated that there is no association and reinforcing the
13
Looking at the sub-hypothesis H2b (gender differences) the descriptive statistics shown
in table 2 illustrate a slight decrease in intentions in males when CSR is presented and a
slight increase in females intentions in the same situation. A Pearson Chi-Square
(appendix 7) was again performed and the results indicate that the only situation where
the hypothesis of association will not be rejected is for females intentions to buy
(χ2(d.f.=4,n=191)=9,603 higher than the critical χ2 value of 9,49). The strength of this
association was measured by the Phi test and the φ females’ intentions to purchase=0,289 signifying a slight association.
In terms of likability to consume the brand, both genders reveal higher mean when CSR
actions are present. However, these differences are not statistically significant.
Even though there is a slight association in females’ intentions to purchase the brand in
both groups, on the whole there is evidence to reject H2b.
Table 2:Means for H2 and H2b
Intentions to buy the brand
Intentions to ask the brand
Likability to consume the brand
Ben & Jerry’s
(Control group)
All
(N=66) 3,5758 3,6515 4,3182
Male
(N=34) 3,558 3,6765 4,3235
Female
(N=32) 3,5938 3,6250 4,4167
Ben & Jerry’s with
CSR actions (Experimental groups
1 + 2)
All
(N=125) 3,5440 3,6640 4,4640
Male
(N=60) 3,3167 3,5667 4,3125
Female
(N=65) 3,7538 3,7538 4,5077
Environmental issues & Social issues
To evaluate this hypothesis, it was necessary to look at the relation of each of the
experimental groups with the control group, and then analyse only the two experimental
groups with one and other to see if there is any difference among them, both in terms of
brand image as in terms of purchase intentions, to see if one typo of action has a greater
14
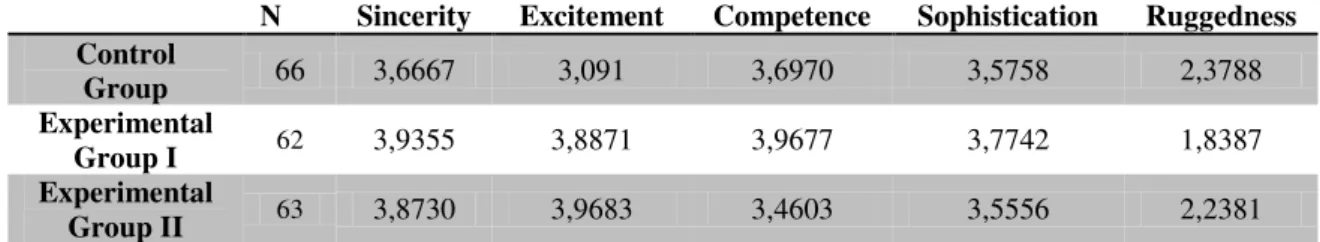
The first step was to compare the means, of all the variables in study, of the control
group with the experimental group I (environmental), and the control group with the
experimental group II (social) (table 3 and 4). By merely observation of the means, the
experimental group I is the one that has a slightly better evaluation in most variables,
which goes accordingly to what had previously been hypothesized.
Considering the control group against the experimental group I, the variable ruggedness
is the only where the Levene’s test shows equal variance assumed (F=10,626) with 5%
of significance. An independent sample t-test (appendix 8) was performed to test
equality of means, with 95% confidence meaning a critical value of t=1,96. Following
the previous result, only for the variable ruggedness (t=2,661), the equality of means is
rejected. This leads to the assumption that there is not a significant difference between
the control group and experimental group I.
The same procedure was repeated but now to compare the control group with the
experimental group II. In this case, we cannot consider equal variances by the Levene’s
test in all variables, and the following results of t-test (appendix 9) to compare means
leads to the rejection of different means between the two groups.
Given the previous results, there is evidence to reject H3, with the exception of one
dimension of brand personality where we found a slightly better judgement for the
environmental group but which needs further research.
Table 3: Means of Brand Image in the Control Group and Experimental Groups.
N Sincerity Excitement Competence Sophistication Ruggedness Control
Group 66 3,6667 3,091 3,6970 3,5758 2,3788
Experimental
Group I 62 3,9355 3,8871 3,9677 3,7742 1,8387
Experimental
Group II 63 3,8730 3,9683 3,4603 3,5556 2,2381
Table 4: Means of Purchase Intentions in the Control Group and Experimental Groups
N Intentions to buy the brand
Intentions to ask the brand
15
Control
Group 66 3,5758 3,6515 4,3182
Experimental
Group I 62 3,5968 3,5968 4,4677
Experimental
Group II 63 3,4921 3,7307 4,4603
Discussion
The purpose of this study was to understand if CSR actions have an influence on
children’s brand image and purchase intentions. The rejection of all hypotheses does not
represent a failure or disappointment, and sheds as much light about children’s
valuation of CSR, as the acceptance of all hypotheses. This section covers how the
results can impact brand strategies, as my objective was, from the beginning, to look at
how this affected corporate strategies.
Children in this specific age group do not demonstrate a higher evaluation of the brand
nor a higher intention to purchase the brand’s products due to the brand’s CSR efforts.
Furthermore, it appears that they are not naturally biased towards social or
environmental CSR actions, and although females exhibit slightly higher reactions to
CSR, this is not statistically relevant, and as such, males and females can be considered
to be equally unaffected by this sort of actions.
Therefore, if the target are children of this age group, a focus on CSR, does not seem to
be a sound investment. It does not constitute a competitive advantage, does not affect
children’s perceptions and intentions and, as such, does not represent a significant
return on investment. This analysis is considering marketing purposes alone and
excluding legal requirements, the companies’ own sustainability policies and other
factors
A possible reason for this lack of impact on children is that CSR actions for children are
focusing solely on an informative aspect and not on an educative aspect. Although
children in this age group are able to understand what social and environmental actions
16
preferable, or how much good they bring as, from the results, they do not appear to take
CSR actions into consideration and as an important factor when evaluating the brand. In
terms of corporate strategy this is definitely an important wrinkle that represents a
possible direction for companies that intent to send a message in a way that children
appears not to be able to interpret correctly. Educative programs or initiatives, designed
specifically to make children understand why CSR actions matter so much might be a
way to make children more sensible to these issues, and as such increase the return of
CSR investments by companies targeting children, as opposed to simply abandoning
these investments outright.
Limitations and Further Research
There are some important limitations in this study that are worth mentioning and that
can lead to improved researches when considered.
First of all, this was a case study based on a brand that had no awareness within
children. Children familiarity with the brand is an important bias since, as Machleit and
Wilson (1988) found, brand familiarity moderates the brand attitude after an exposure.
Thus, even though it can be said that for brands with low levels of awareness, CSR
activities do not present any influence on children in the age considered, further
research should study this influence when a brand with high level of awareness (e.g.
McDonalds) is considered.
Another limitation is its limited cultural application. The research was conducted in one
country and in a cosmopolite city, which has a very specific culture and way of living.
In this specific context it was shown that CSR actions do not impact children. However
17
(Wei et al., 2009). These results should be further developed considering other cultures
and habits.
Further studies should access the influence on different stages of the child development,
thus including different ages. Also, it became impractical to study if there were any
differences among social classes, and therefore future studies should evaluate these
differences.
To summarize, this research has been done by calibrating a series of parameters in order
to make it more specific and therefore more measurable. Altering one or more of these
parameters might bring different conclusions, and better define the admittedly large
children group as targets of CSR initiatives.
In terms of reaching the objective of this paper –seeing how children’s perceptions of
CSR brands can affect corporate strategy – it is definitely worth exploring why children
seem to be unaffected by regular CSR actions, so companies can better adapt
themselves to children’s perceptions. A possible reason for this is mentioned in the
previous topic, namely the implication that there is a lack of education in relation to
social responsibility. This, along with other avenues of research, can bring value on this
subject, as CSR actions have become widespread, companies’ investments and focus in
this area are significant, and it is preferable to adjust the message so children can better
understand it, increasing its effectiveness and return than simply abandon projects that
have already consumed valuable time and resources, and present actual benefits for
18 References
Aaker, J. L. (1997). Dimensions of Brand Personality. Journal of Marketing Research.
Vol. 34, 347-356.
Bakir, A., Blodgett, J. G., Rose, G. M. (2008). Children's Responses to Gender-Role
Stereotyped Advertisements. Journal of Advertising Research. Vol. 48, issue 2,
255-266.
Bhattacharya, C. B., Sen, S. (2004) Doing Better at Doing Good: When, Why, and How
Consumers Respond to Corporate Social Initiatives. California Management Review.
Vol. 47, 9-24.
Belk, R., Mayer, R., Driscoll, A. (1984). Children’s Recognition of Consumption
Symbolism in Children’s Products. Journal of Consumer Research. Vol. 10, issue 4,
386-397.
Belch, G. E., Belch, M. A. (2004). Advertising and Promotion: An Integrated
Marketing Communication Perspective. McGraw-Hill/Irwin. New York.
Berner, R. (2005). Smarter Corporate Giving. Business-Week. 68–76.
Brennan, M. (2004). The Juster Purchase Probability Scale: A Bibliography. Marketing
Bulletin. Vol. 15, 1-11.
Calvert, S. L. (2008). Children as Consumers: Advertising and Marketing. Future of
Children. Vol. 18, n1, 205-234.
Costa, M. (2010). Brand awareness comes as a part of growing up. Marketing Week.
Vol. 33, issue 24, 12-16.
Davies, G., Chun, R., Da Silva, R. V., Roper, S. (2004). A Corporate Character Scale to
Assess Employee and Customer Views of Organization Reputation. Corporate
19
Dhalsrud, A. (2008). How Corporate Social Responsibility is Defined: an Analysis of
37 Definitions. Corporate Social Responsibility and Environmental Management. Vol.
15, issue 1, 1-13.
Esch, F., Langner, T., Schmitt, B. H., Geus, P. (2006). Are brands forever? How brand
knowledge and relationships affect current and future purchases. Journal of Product &
Brand Management. Vol. 15, issue 2/3, 98-105.
Greig, A., Taylor, J., MacKay, T. (2007). Doing Research with Children. Sage
Publications.
Ji, M. F. (2002). Children’s Relationships with Brands: “True Love” or “One-night”
Stand. Psychology & Marketing. Vol. 19, issue 4, 369-387.
Ji, M. F. (2008). Child-brand relations: a conceptual framework. Journal of Marketing
Management. Vol. 24, issue 5/6, 603-619,
John, D. R. (1999). Consumer Socialization of Children: A Retrospective Look at
Twenty-Five Years of Research. Journal of Consumer Research. Vol. 26, issue 3,
183-213.
Juster, F. T. (1966). Consumer Buying Intentions and Purchase Probability: An
Experiment in Survey Design. Journal of the American Statistical Association. Vol. 61,
issue 315, 658-696.
Keller, K. L. (2008). Strategic brand management: Building, measuring and managing
brand equity (3rd ed.). Upper Saddle River, NJ: Prentice Hall.
King, S. (1973). Developing New Brands. Pitman: London.
Leão, B. (2007). Image, Identity and Recommended Marketing Plan for REDKEN for
20
Lichtenstein, D. R., Drumwright,M. E., Braig, B. M. (2004). The Effect of Corporate
Social Responsibility on Customer Donations to Corporate-Supported Nonprofits.
Journal of Marketing. Vol. 68, 16-32
Luo, X., Bhattacharya, C. B. (2006). Corporate Social Responsibility, Customer
Satisfaction, and Market Value. Journal of Marketing. Vol. 70, 1-18.
Machleit, K. A., Wilson, R. D. (1988). Emotional Feelings and Attitude Toward the
Advertisement: The Roles of Brand Familiarity and Repetition. Journal of Advertising.
Vol. 17, issue 3, 27-35.
Malhotra, N., Birks, D. F. (2007) Marketing Research: An Applied Approach, 3rd
European Edition. Pearson Education.
Malkus, A. J., Musser, L. M. (1997). Environmental Concern in School-Age Children.
(Paper presented at the Biennial Meeting of the Society for Research in Child
Development (62nd, Washington, DC, April 3-6, 1997)).
McNeal, J. U. (1992). Kids as Costumers: a Handbook of Marketing to Children.
Lexington Books.
Nairn, A. (2009). Consumer kids – the influence of the commercial world on our
children. Education Review. Vol. 22, issue 1, 54-60.
Piaget, J., Inhelder, B. (1969). The Psychology of The Child. New York: Basic Books.
Preston, Chris (2005) Advertising to children and social responsibility. Young
Consumers: Insight and Ideas for Responsible Marketers. 6 (4), 61-67.
Ranjbarian, B., fathi, S., Shekarchizade, Z. (2010). Age Influence on Information
Processing of TV Advertisement Messages by Elementary Students. European Journal
21
Sandhu, H. S., Kapoor, S. (2010). Corporate Social Responsibility Initiatives: An
Analysis of Corporate Disclosure. South Asian Journal of Management. Vol. 17, issue
2, 47-80.
Syed Alwi, S. F., Da Silva, R. V. (2007). Online and Offline Corporate Brand Images:
Do They Differ?. Corporate Reputation Review. Vol. 10, issue 4, 217-244.
UNICEF Evaluation Office. (2002). Children Participating in Research, Monotoring
and Evaluation (M&E) – Ethics and Your Responsibilities as a Manager, Evaluation
Technical Notes. No.1, 1-11.
Valkenburg, P. M., Cantor, J. (2001). The development of a child into a consumer.
Applied Developmental Psychology. Vol. 22, 61-72.
Wei, Y., Egri, C. P., Lin, C. Y. (2009). Do Corporate Social Responsibility Practices
Make a Difference in Eastern and Western Contexts?. Academy of Management Annual
Meeting Proceedings. 1-6.
Wright, M., MacRae, M. (2007). Bias and variability in purchase intentions scales.
Journal of the Academy of Marketing Science. Vol. 35, issue 4, 617-624.
Young, M. R., DeSarbo, W. S., Morwitz, V. G. (1998). The Stochastic Modeling of
22
23 Appendix 1 –Parent’s consent letter and questionnaire
Inês Barros, aluna de Mestrado
Nova School of Business and Economics
Assunto: Pedido de autorização para participação em estudo sobre o comportamento do consumidor infantil
Exmo(a). Sr(a). Encarregado(a) de Educação,
Sou aluna do Mestrado em Gestão na Nova School of Business and Economics e estou a fazer a minha tese no âmbito do comportamento do consumidor infantil. Concretamente, estou a levar a cabo um estudo sobre a influência das actividades de responsabilidade social das empresas na percepção das marcas por parte do consumidor infantil.
Precisava então, que o seu educando(a) colaborasse no estudo preenchendo um questionário que irei distribuir na escola. Para tal, solicito a sua autorização e a devolução deste documento devidamente preenchido.
Os dados recolhidos serão analisados por mim e a sua confidencialidade é total, sendo apenas publicados na tese os resultados do estudo sem a referência aos dados dos alunos e sem a identificação das escolas onde o estudo foi realizado (apenas se mencionará a localidade e o tipo de escola - pública ou privada). Os resultados do estudo poderão ser apresentados em conferências, artigos/livros ou notícias relacionadas com o tema e serão enviados para as escolas participantes, podendo o trabalho ser consultado pelos Encarregados de Educação.
Com os melhores cumprimentos,
1. Assinale o nível de escolaridade que possui cada um dos pais, colocando uma cruz na opção correcta. Sem estudos ou primária incompleta Primária (antiga 4ª classe) Ensino Secundário (9ºano) 12º Ano Licenciatura ou Bacharelato Estudos Pós-Graduados Mãe Pai
2. Assinale com uma cruz as marcas de gelado que o seu filho consome (pode assinalar várias).
Olá ____ Haggen Dazs ____ Continente ____
Carte D’Or ____ Ben & Jerrys ____ Pingo Doce ____
Nestlé ____ Outra(s): ________________________________
Autorizo o(a) meu filho(a), ___________________________________ do ___º ano, turma ___ a participar neste estudo.
________________, _____ de ________________ de 2011
24 Appendix 2 –Children’s questionnaire
Questionário
Dados do aluno:
Idade: ________ Sexo: F[ ] M[ ] Ano: ________
1. Gostas de gelados? (Assinala com um X a tua resposta) Sim ___ Não ___
2. Comes gelados? (Assinala com um X a tua resposta) Sim ___ Não ___
3. Que marcas de gelados conheces?
Assinala com um X as marcas que conheces.
Olá
Carte D’Or
Nestlé
Haagen-Dazs
Ben & Jerry’s Continente Pingo Doce
Outro…
4. Qual é o teu gelado preferido? ________________________________________________
Agora, antes de mudares de página e continuares a responder ao questionário, assiste a uma pequena apresentação.
Atenção:
25
Instruções: Vamos fazer um jogo. Vê os adjectivos à esquerda e depois faz um X no círculo que corresponde à tua resposta, tendo em conta a escala de 1 a 5 apresentada.
Imagina que os gelados Ben & Jerry’s são uma pessoa. Então, essa pessoa seria...
1 = discordo
totalmente 2 = discordo
3 = concordo
+ ou - 4 = concordo
5 = concordo totalmente
Sincera O O O O O
Entusiasmante O O O O O
Competente O O O O O
Sofisticada O O O O O
Dura O O O O O
Instruções:Pinta o círculo que corresponde à tua resposta, tendo em conta as escalas de 1 a 5 apresentadas para cada uma das questões que se seguem.
1. Gostavas de comer os gelados Ben & Jerry’s?
(1=não gostava nada, 3=gostava mais ou menos, 5=gostava muito)
2. Vais comprar os gelados Ben & Jerry’s?
1 - não vou comprar de certeza, só 1 vez em 100 vezes é que vou comprar este gelado 2 - possivelmente vou comprar, 3 em 10 vezes vou comprar este gelado
3 - talvez compre, 5 em 10 vezes vou comprar este gelado
4 - provavelmente vou comprar, 7 em 10 vezes vou comprar este gelado 5 - vou comprar de certeza, 99 em 100 vezes vou comprar este gelado
3. Vais pedir aos teus pais para comprarem os gelados Ben & Jerry’s?
1=não vou pedir de certeza, só 1 vez em 100 vezes vou pedir este gelado 2=possivelmente vou pedir, 3 em 10 vezes vou pedir este gelado
3=talvez peça, 5 em 10 vezes vou pedir este gelado
4=provavelmente vou pedir, 7 em 10 vezes vou pedir este gelado 5=vou pedir de certeza, 99 em 100 vezes vou pedir este gelado
Obrigada pela tua ajuda!!
1 2 3 4 5
1 2 3 4 5
26 Appendix 3 –Animated Storyboards
1. Control Group:
2. Experimental Group 1:
3. Experimental Group 2:
27
Appendix 4 –A Brand Personality Framework (Aaker, 1997)
Dimensions Facets Items (traits)
Sincerity Down-to-earth Honest
Wholesome Cheerful
down-to-earth, family-oriented, small-town honest, sincere, real
wholesome, original
cheerful, sentimental, friendly Excitement Daring
Spirited Imaginative Up-to-date
daring, trendy, exciting spirited, cool, young imaginative, unique
up-to-date, independent, contemporary Competence Reliable
Intelligent Successful
reliable, hard-working, secure intelligent, technical, corporate successful, leader, confident Sophistication Upper class
Charming
upper-class, glamorous, good-looking charming, feminine, smooth
Ruggedness Outdoorsy Tough
outdoorsy, masculine, western tough, rugged
Appendix 5: Juster Scale (Juster, 1966)
Descriptors
Numerical Verbal Probability
10 Certain, practically certain 99 in 100
9 Almost sure 9 in 10
8 Very probable 8 in 10
7 Probable 7 in 10
6 Good possibility 6 in 10
5 Fairly good possibility 5 in 10
4 Fair possibility 4 in 10
28
2 Slight possibility 2 in 10
1 Very slight possibility 1 in 10 0 No chance, almost no chance 1 in 100
Appendix 6: Chi-Square Results for H1 and H1b
Brand Image Adjectives * CSR_No CSR
Chi-Square Test (d.f.=4, N=191)
Pearson chi-square Likelihood ratio
Sincerity
All 7,320 7,551
Male 2,698 2,713
Female 10,828 12,521
Excitement
All 0,269 0,269
Male 3,404 4,081
Female 5,234 5,958
Competence
All 3,734 3,764
Male 0,251 0,255
Female 5,812 5,881
Sophistication
All 2,475 2,452
Male 5,302 5,598
Female 0,621 0,929
Ruggedness
All 3,825 3,732
Male 8,961 8,764
Female 0,436 0,437
Appendix 7: Chi-Square Results for H2 and H2b
Intentions to purchase * CSR_No CSR
Chi-Square Test (d.f.=4, N=191)
Pearson chi-Square Likelihood ratio
Intentions to buy the brand
All 1,135 1,184
Male 4,438 4,449
Female 8,091 9,603
Intentions to ask the brand
All 2,165 2,168
Male 4,658 4,873
Female 0,623 0,636
Likability to eat the brand
All 2,400 2,687
Male 1,991 2,300
29 Appendix 8: Independent Sample t-test: Control Group vs Experimental Group I
Levene’s Test for
equality of variances
t-test for equality of means
F Sig. t df
Sincerity
Equal variances
assumed ,000 0,989 -1,609 126
Equal variances
not assumed -1,603 121,506
Excitement
Equal variances
assumed ,003 0,954 0,133 126
Equal variances
not assumed 0,133 125,130
Competence
Equal variances
assumed ,009 0,923 -1,433 126
Equal variances
not assumed -1,431 124,880
Sophistication
Equal variances
assumed ,015 0,902 -1,076 126
Equal variances
not assumed -1,076 125,371
Ruggedness
Equal variances
assumed 10,626 0,001 2,661 126
Equal variances
not assumed 2,684 120,869
Intentions to buy the brand
Equal variances
assumed ,348 0,556 -0,110 126
Equal variances
not assumed -0,110 123,555
Intentions to ask the brand
Equal variances
assumed 1,405 0,238 0,278 126
Equal variances
not assumed 0,279 125,715
Likability to eat the brand
Equal variances
assumed 2,070 0,153 -0,980 126
Equal variances
not assumed -0,983 125,940
Appendix 9: Independent Sample t-test: Control Group vs Experimental Group II
Levene’s Test for
equality of variances
t-test for equality of means
F Sig. t df
Sincerity
Equal variances
assumed ,912 ,341 -1,207 127
Equal variances
not assumed -1,202 121,025
Excitement
Equal variances
assumed ,142 ,0707 -0,362 127
Equal variances
not assumed -0,362 126,594
Competence Equal variances
30
Equal variances
not assumed 1,165 121,598
Sophistication
Equal variances
assumed 0,055 0,813 0,111 127
Equal variances
not assumed 0,111 126,828
Ruggedness
Equal variances
assumed 0,071 0,790 0,632 127
Equal variances
not assumed 0,632 126,985
Intentions to buy the brand
Equal variances
assumed 0,902 0,344 0,429 127
Equal variances
not assumed 0,428 123,430
Intentions to ask the brand
Equal variances
assumed 0,014 0,905 -0,387 127
Equal variances
not assumed -0,387 126,950
Likability to eat the brand
Equal variances
assumed 0,436 0,501 -0,892 127
Equal variances