Differences in the force system delivered by different
beta-titanium wires in elaborate designs
Renato Parsekian Martins1, Sergei Godeiro Fernandes Rabelo Caldas2, Alexandre Antonio Ribeiro3, Luís Geraldo Vaz4, Roberto Hideo Shimizu5, Lídia Parsekian Martins6
Objective: Evaluation of the force system produced by four brands of β-Ti wires bent into an elaborate design. Meth-ods: A total of 40 T-loop springs (TLS) hand-bent from 0.017 x 0.025-in β-Ti were randomly divided into four groups according to wire brand: TMATM (G1), BETA FLEXYTM (G2), BETA III WIRETM (G3) and BETA CNATM (G4).
Forces and moments were recorded by a moment transducer, coupled to a digital extensometer indicator adapted to a testing machine, every 0.5 mm of deactivation from 5 mm of the initial activation. The moment-to-force (MF) ratio, the overlapping of the vertical extensions of the TLSs and the load-deflection (LD) ratio were also calculated. To complement the results, the Young’s module (YM) of each wire was determined by the slope of the load-deflection graph of a tensile test. The surface chemical composition was also evaluated by an energy dispersive X-ray fluorescence spectrometer. Re-sults: All groups, except for G2, produced similar force levels initially. G3 produced the highest LD rates and G1 and G4 had similar amounts of overlap of the vertical extensions of the TLSs in “neutral position”. G1 and G3 delivered the high-est levels of moments, and G2 and G3 produced the highhigh-est MF ratios. β-Ti wires from G3 produced the highest YM and all groups showed similar composition, except for G2. Conclusion: The four beta-titanium wires analyzed produced different force systems when used in a more elaborate design due to the fact that each wire responds differently to bends.
Keywords: Orthodontics. Tooth movement. Orthodontic wires.
How to cite this article: Martins RP, Caldas SGFR, Ribeiro AA, Vaz LG, Shimizu RH, Martins LP. Differences in the force system delivered by differ-ent beta-titanium wires in elaborate designs. Ddiffer-ental Press J Orthod. 2015 Nov-Dec;20(6):89-96. DOI: http://dx.doi.org/10.1590/2177-6709.20.6.089-096.oar
Submitted: March 20, 2015 - Revised and accepted: June 29, 2015
» The authors report no commercial, proprietary or financial interest in the products or companies described in this article.
Contact address: Renato Parsekian Martins.
Rua Carlos Gomes, 2158, Araraquara, São Paulo - Brazil. CEP: 14801-320. E-mail: [email protected]
1 Adjunct professor, Universidade Estadual Paulista Julio de Mesquita Filho
(UNESP), School of Dentistry, Department of Orthodontics, Araraquara, São Paulo, Brazil.
2 Adjunct Professor, Universidade Federal do Rio Grande do Norte (UFRN),
Department of Dentistry, Natal, Rio Grande do Norte, Brazil.
3 Professor, Universidade Potiguar (UnP) and Associação Brasileira de Odontologia
(ABO), Specialization course in Orthodontics, Natal, Rio Grande do Norte, Brazil.
4 Professor, Universidade Estadual Paulista Julio de Mesquita Filho (UNESP), School
of Dentistry, Department of Prosthesis and Dental Material, Araraquara, São Paulo, Brazil.
5 Professor, Universidade Tuiuti do Paraná (UTP), School of Dentistry, Curitiba,
Paraná, Brazil.
6 Professor, Universidade Estadual Paulista Julio de Mesquita Filho (UNESP), School
of Dentistry, Department of Orthodontics and Pediatric Dentistry, Araraquara, São Paulo, Brazil.
DOI: http://dx.doi.org/10.1590/2177-6709.20.6.089-096.oar
Objetivo: avaliar os sistemas de força produzidos por quatro marcas de fios de -Ti, dobrados em formas complexas. Métodos:
quarenta molas T-Loop (TLS) dobradas à mão, confeccionadas a partir de fios de -Ti, calibre 0,017” x 0,025”, foram aleatoria-mente divididas em quatro grupos, de acordo com a marca do fio: TMA (G1), BETA FLEXY (G2), BETA III Wire (G3) e BETA CNA (G4). Forças e momentos foram registrados por um transdutor de momento — acoplado a um extensômetro digital, adap-tado a uma máquina de ensaios —, a cada 0,5mm de desativação, a partir de 5mm da ativação inicial. A proporção momento-força (M/F), a sobreposição das extensões verticais das TLSs e a relação carga-deflexão (C/D) também foram calculadas. Para completar os resultados, o módulo de Young (MY) de cada fio foi determinado pelo declive no gráfico de carga-deflexão em um ensaio de tração. Ademais, a composição química da superfície foi avaliada por um espectrômetro de fluorescência de raios X por energia dispersiva. Resultados: todos os grupos, exceto o G2, produziram níveis de força semelhantes, inicialmente. O G3 produziu as maiores taxas de C/D, enquanto G1 e G4 tiveram quantidades similares de sobreposição das extensões verticais das TLSs em posição neutra. G1 e G3 geraram os mais altos níveis de momentos, enquanto G2 e G3 produziram os mais altos índices de M/F. Os fios -Ti do G3 produziram o maior MY, e todos os grupos apresentaram composição semelhante, exceto G2. Conclusão:
os quatro fios de beta-titânio analisados produziram diferentes sistemas de forças, quando utilizados para formas mais complexas, devido ao fato de que cada fio responde de forma diversa à confecção de dobras.
INTRODUCTION
Beta-titanium (β-Ti) was introduced in Dentistry
in the late 70’s;1 since then it has been widely used in
Orthodontics due to its excellent mechanical prop-erties, such as high spring-back, low stiffness, high
formability, and good weldability.2-6 After
expira-tion of the patent2 on the first commercial brand of
β-Ti (TMATM, Ormco Co., Glendora, USA), the use
of this alloy expanded drastically with a wide range of prices and quality. Even though there are several
brands available to the clinician, only a few studies2,7,8
have been conducted in order to compare different
β-Ti commercial brands. These studies, however,
compare mechanical properties of β-Ti alloys either
through tensile2,8 or through 3-point bending tests7
on straight pieces of wire. This might not represent
the true behavior of the different β-Ti alloys when
bends are placed in the wire or when more elaborate designs, such as loops, are used.
It has been established that the T-loop spring (TLS) has the greatest ability to produce high moment-to-force (MF) ratios in order to control tooth movement when compared to other designs of springs. Several parameters of TLS have already been studied, such as
spring’s height,9-13 the location of the spring within
inter bracket distance,9,12-15 the intensity and type of
pre-activation,11,12,13,16,17,18 horizontal activation,11,13
al-loy wire type,3,19,20 and stress relaxation;21 all of which
can alter the MF ratio and force produced. However, differences between TLS manufactured with
differ-ent β-Ti have not yet been systematically studied and
are not completely understood. Thus, it is suggested that these alloys may present different biomechanical behavior, thereby affecting the force system released by the springs.
The objective of this study was to evaluate whether the behavior of four different brands of beta-titanium bent into an elaborate design (T-loop spring) are sim-ilar when forces, moments and MF ratios produced are compared.
MATERIAL AND METHODS Force system
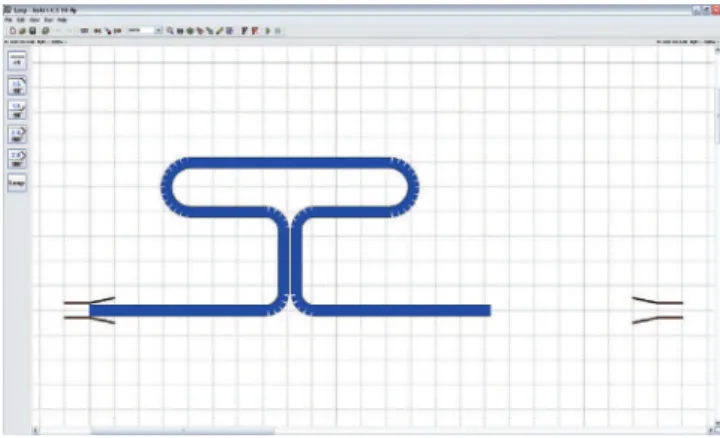
Sixty 6 x 10-mm T-loop springs (TLSs) were blindly bent out of four different commercial brands
of 0.017 x 0.025-in β-Ti, using a Marcotte plier
(Hu-Friedy dental instruments, Chicago, USA), a custom
template (Fig 1). They were divided into four groups of 15 springs made of the same wire brand. The groups were previously labeled to assure impartiality of results. The wires used in the groups were TMA (Ormco Co., Glendora, USA) (G1), BETA FLEXY (Orthometric Imp.Exp.Ltda, Marília, Brazil) (G2), BETA III WIRE (Morelli Ortodontia, Sorocaba,
Brazil) (G3) and BETA CNA(Ortho Organizers,
INC., San Marcos, USA) (G4) (Table 1) TLSs were hand-bent in a random order; and out of the 15 TLSs bent, ten were randomly selected for testing.
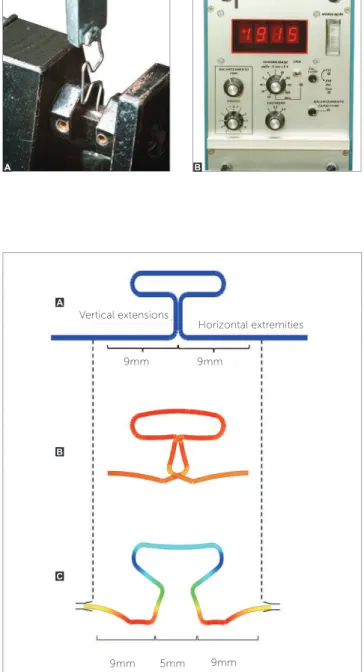
A universal testing machine (EMIC, São José dos Pinhais, Brazil), set up with a load cell of 0.1 kN, was coupled to a moment transducer and a digital exten-someter indicator (Transdutec, São Paulo, Brazil) for the tests. The test speed was 5 mm/min and the digi-tal extensometer excitation and sensitivity was 5 V and 0.5 mV/V, respectively (Fig 2).
Prior to the test, concentrated bends were used
to pre-activate the TLSs22 which were positioned
symmetrically in an inter bracket distance (IBD) of 23 mm. At this distance, they were checked with a digital caliper and the testing device was zeroed. To assure the correct activation and the centralization of the TLSs, 9 mm were measured from the center of the loop towards each extremity of the horizontal exten-sions, and marked with a permanent marker (Fig 3). Those markings would allow the TLS to be correctly secured in place and centralized with the correct hori-zontal activation. The TLS was rigidly clamped to the test apparatus in one extremity and tied to a bracket on the other one with an elastomeric ligature.
Ater a horizontal activation of 5 mm, the hori-zontal force and moment developed were recorded for every 0.5 mm of deactivation at the extremity of the TLSs attached to the testing machine, and the MF ratios were calculated. Furthermore, the amount of overlap of the vertical extensions of the TLSs in neu-tral position (deformation assumed when the loop’s extremities are placed parallel to the position that they
will be once installed, producing only moments) was calculated by linear interpolation. The load-delection (LD) ratio of each TLS was obtained by calculating the slope of the respective deactivation graph (Fig 4).
Wire dimensions
The height and width of each wire were measured to the nearest 0.001 mm with a digital micrometer accurate to ± 1 μm (Mitutoyo, Kyoto, Japan). Five wires were taken from each group, totaling 20 read-ings, and the mean value was used in the subsequent calculations (Table 1).
Mechanical properties
The sample comprised five 30-cm segments of each wire and was divided as presented in Table 1. The tensile test was performed on a universal testing machine (EMIC, São José dos Pinhais, Brazil) set up with a load cell of 5 kN and speed of 2 mm/min until rupture of the wire. Young’s module (YM) was determined by the slope of the LD graph of the ten-sile test.23
Chemical composition
An energy dispersive X-ray fluorescence spec-trometer machine, model EDX-800, (Shimadzu Corporation, Kyoto, Japan), was used to determine the surface chemical composition of the wires in each group, using different wires from the same batch. Based on this analysis, it was assumed that the bulk composition was similar to surface compositions within the limits of accuracy. A fractographic image was obtained and the chemical composition was de-termined automatically in percentages.
Figure 2 - A) Detail of the device used for the measurements: the bottom extremity of the TLS is firmly clamped by the moment transducer, while the top part of the TLS is tied to a bracket soldered to the universal testing machine, which records the horizontal force; B) Moment transducer used.
Figure 3 - A) Loop horizontal dimensions were marked to assure correct activation and TLS centralization; B) Neutral position of the TLS simulated by the Loop Software; C) TLS shape simulated by the Loop Software when positioned symmetrically in an IBD of 23 mm and activated 5 mm. Colored areas reflect stress distribution over the wire, going from red, being high stress areas; to dark blue, being low stress areas.
A
B
C
9mm
9mm 9mm
Horizontal extremities Vertical extensions
5mm 9mm
Table 1 - β-Ti wires used in the study. Statistical analysis
SPSS v.16.0 (SPSS Inc., Chicago, USA) statistical analysis sotware was used in this study. Kolmogorov-Smirnov test indicated normal distribution of data and one-way ANOVA test was used to identify diferences among groups. Tukey post hoc test, at a signiicance level of 5%, was used to compare diferences among groups.
RESULTS Force system
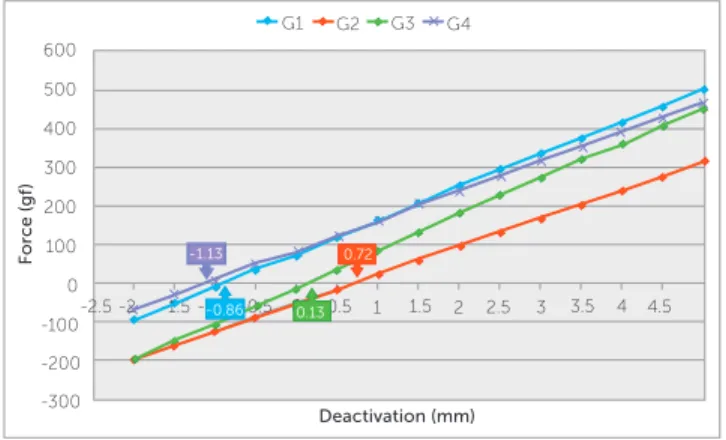
The TLSs measured produced horizontal forces ranging from 116.7 gf to 498.9 gf (G1), -15.9 gf to 311.4 gf (G2), 35.8 gf to 452.6 gf (G3) and 121.9 gf to 463.7 gf (G4) between 0.5 and 5 mm of activation. TLSs from G2 produced the lowest initial forces of de-activation compared to the other three groups. (Table 2 and Fig 4) The TLSs from G3 showed the highest LD rates (93.7 gf/mm), followed by G1 (85.5 gf/mm), and by G2 and G4 (72.7 and 76.0 gf/mm, respectively), which showed similar LD rates.
The amount of overlap of the vertical extensions of TLSs (in neutral position) was different between G2 (0.72 mm) and G3 (0.13 mm), which, on the other hand, were different from the similar overlap that occurred between G1 and G4 (-0.86 mm and -1.13 mm, respectively) (Table 2 and Fig 5).
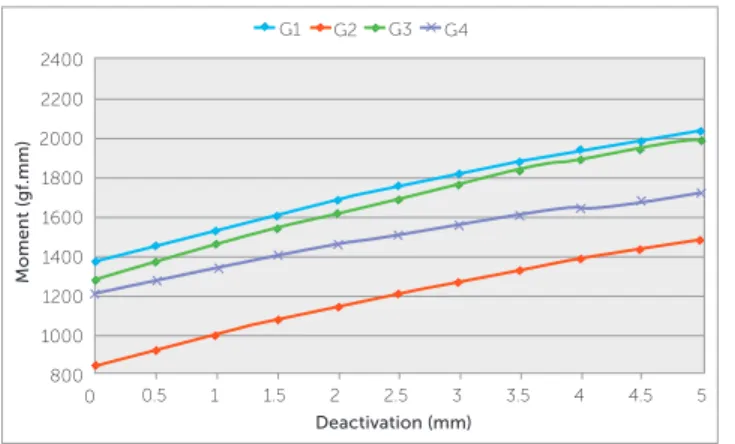
TLSs delivered moments that ranged from 1452.0 gf.mm to 2030.7 gf.mm (G1), 919.0 gf.mm to 1482.0 gf.mm (G2), 1366.1 gf.mm to 1992.1 gf.mm (G3) and 1276.9 gf.mm to 1721.3 gf.mm (G4) be-tween 0.5 and 5 mm of activation. G1 and G3 pro-duced the highest levels of moments initially, while G4 produced lower moments than G1, but the values were similar to G3 and G2. G2 was different from all other groups. (Table 3 and Fig 6)
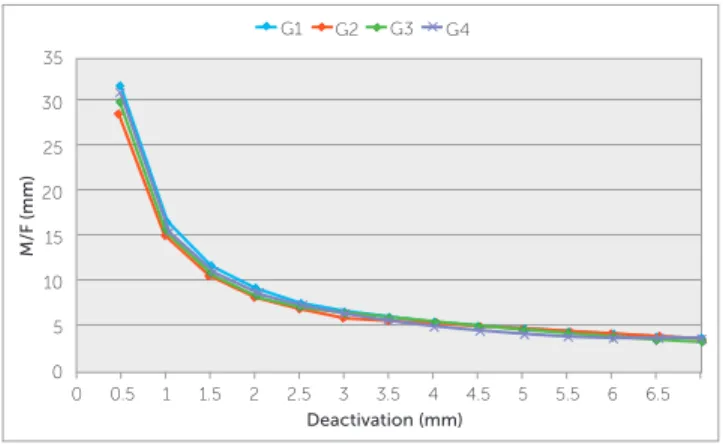
G2 and G3 showed the highest MF ratios ini-tially (4.9 and 4.4 mm, respectively), followed by G1 (4,1 mm) which was similar to G3 and G4 (3.7 mm). From 1.5 mm of deactivation on, there was no differ-ence among groups. (Table 4 and Fig 7).
Figure 4 - Horizontal force (in grams-force) produced on deactivation by the four groups of β-Ti TLSs over a range of 5 mm.
Figure 5 - Figure 4 slightly modified. The x- intercepts, pointed by the ar-rows, depict the amount of horizontal overlap of the vertical extensions of the TLSs in “neutral position” and were calculated by linear interpolation.
Group Wire Manufacturer Batch
Measured dimensions (inches)
Height Width
Mean SD Range p (95%) Mean SD Range p (95%)
1 TMA Ormco Corporation 03F2F 0.0165 0.00 A 0.0 <0.001 0.024 0.00 B 0.0 0.007
2 BETA
FLEXY Orthometric Imp. Exp. 148 0.0161 0.00 B 0.0005 0.024 0.00 B 0.0
3 BETA III
TiMo Morelli Ortodontia
1072448
100004 0.0165 0.00 A 0.0 0.0244 0.00 A 0.0005
4 CNA Ortho Organizers 401682D06 0.0165 0.00 A 0.0 0.0242 0.00 AB 0.0005
600 600
G1 G2 G1
Deactivation (mm) Deactivation (mm)
For
ce (gf
)
For
ce (gf
)
G2
G3 G4 G3 G4
400
400
200
200
0
0
500 500
300
300
100
100
-100
-100
-200
-300 0.5
0.5 -2.5 -2 -1.5 -1 -0.5 0
1.5
1.5
3
3
4.5
4.5
1
1
2.5
2.5
4
4
2
2
3.5
3.5
-1.13 0.72
1 2 3 4 p (95%)
Mean SD Mean SD Mean SD Mean SD
5 mm 498.9 18.7 B 311.4 79.92 A 452.58 26.73 B 463.65 13.8 B < 0.001
4.5 mm 453.74 18.78 B 273.67 72.85 A 406.47 24.43 B 424.35 13.91 B < 0.001
4 mm 414.1 18.41 C 238.37 68.59 A 362.21 24.27 B 388.57 14.05 BC < 0.001
3.5 mm 373.93 18.3 C 203.04 64.58 A 317.58 24.1 B 352.48 14.22 BC < 0.001
3 mm 333.22 18.18 C 167.3 60.78 A 272.42 24.29 B 315.85 14.48 C < 0.001
2.5 mm 291.66 18.16 C 131.48 57.3 A 226.65 24.4 B 278.65 14.92 C < 0.001
2 mm 249.29 18.29 C 95.34 54.15 A 180.0 24.58 B 240.77 15.5 C < 0.001
1.5 mm 206.05 18.51 C 58.55 51.22 A 132.61 24.82 B 201.93 15.94 C < 0.001
1 mm 161.89 18.86 C 21.53 48.83 A 84.48 25.06 B 162.28 16.4 C < 0.001
0.5 mm 116.66 19.42 C -15.87 47.1 A 35.77 25.31 B 121.94 17.29 C < 0.001
Neutral position -0.86 0.22 A 0.72 0.62 C 0.13 0.29 B -1.13 0.27 A < 0.001
LD 85.5 3.04 B 72.7 12.51 A 93.71 2.59 C 75.96 3.01 A < 0.001
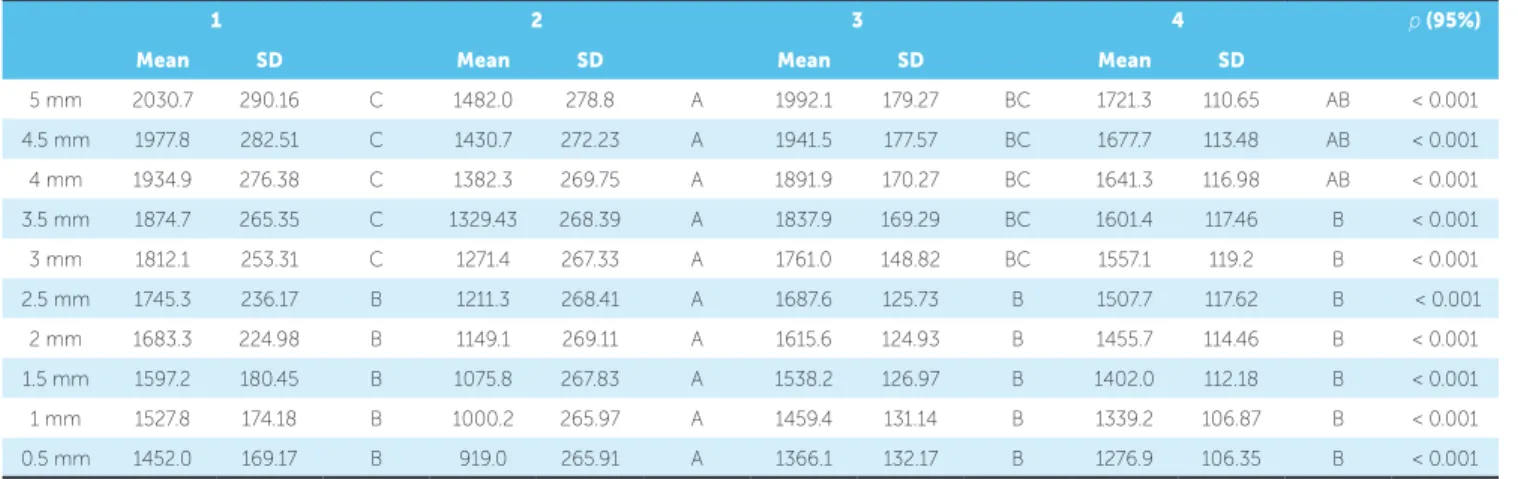
Table 2 - Means and standard deviations for forces (gf), neutral position (mm), LD ratio (gf.mm) and ANOVA results over a range of 5 mm of deactivation.
Table 4 - Means and standard deviations for MF ratios (mm) and ANOVA results over a range of 5 mm of deactivation. Table 3 - Means and standard deviations for moments (gf.mm) and ANOVA results over a range of 5 mm of deactivation. Diferent letters indicate group diferences.
Diferent letters indicate group diferences. Diferent letters indicate group diferences.
1 2 3 4 p (95%)
Mean SD Mean SD Mean SD Mean SD
5 mm 2030.7 290.16 C 1482.0 278.8 A 1992.1 179.27 BC 1721.3 110.65 AB < 0.001
4.5 mm 1977.8 282.51 C 1430.7 272.23 A 1941.5 177.57 BC 1677.7 113.48 AB < 0.001
4 mm 1934.9 276.38 C 1382.3 269.75 A 1891.9 170.27 BC 1641.3 116.98 AB < 0.001
3.5 mm 1874.7 265.35 C 1329.43 268.39 A 1837.9 169.29 BC 1601.4 117.46 B < 0.001
3 mm 1812.1 253.31 C 1271.4 267.33 A 1761.0 148.82 BC 1557.1 119.2 B < 0.001
2.5 mm 1745.3 236.17 B 1211.3 268.41 A 1687.6 125.73 B 1507.7 117.62 B < 0.001
2 mm 1683.3 224.98 B 1149.1 269.11 A 1615.6 124.93 B 1455.7 114.46 B < 0.001
1.5 mm 1597.2 180.45 B 1075.8 267.83 A 1538.2 126.97 B 1402.0 112.18 B < 0.001
1 mm 1527.8 174.18 B 1000.2 265.97 A 1459.4 131.14 B 1339.2 106.87 B < 0.001
0.5 mm 1452.0 169.17 B 919.0 265.91 A 1366.1 132.17 B 1276.9 106.35 B < 0.001
1 2 3 4 p (95%)
Mean SD Mean SD Mean SD Mean SD
5 mm 4.07 0.55 AB 4.86 0.72 C 4.4 0.33 BC 3.72 0.28 A < 0.001
4.5 mm 4.36 0.59 AB 5.35 0.86 C 4.78 0.37 BC 3.96 0.33 A < 0.001
4 mm 4.67 0.64 AB 5.98 1.06 C 5.23 0.41 BC 4.23 0.37 A < 0.001
3.5 mm 5.02 0.69 AB 6.83 1.43 C 5.8 0.49 B 4.55 0.42 A < 0.001
3 mm 5.44 0.73 AB 8.12 2.16 C 6.48 0.5 B 4.94 0.49 A < 0.001
2.5 mm 5.99 0.77 A 10.4 4.02 B 7.48 0.74 A 5.43 0.58 A < 0.001
2 mm 6.77 0.89 A 17.25 13.64 B 9.09 1.15 A 6.08 0.7 A 0.003
1.5 mm 7.79 1.01 -3.03 49.35 11.91 2.18 6.99 0.9 0.537
1 mm 9.53 1.42 13.76 29.44 18.74 6.21 8.35 1.26 0.425
Figure 6 - Moments produced by the β-Ti TLSs over a range of 5 mm of deactivation.
Figure 7 - MF ratio produced by the β-Ti TLSs over a range of 5 mm of deactivation.
Table 5 - Means and standard deviations for YM and ANOVA results over a range
of 5 mm of deactivation.
Table 6 - Composition of β-Ti wires used in the study (in % of total
com-position).
Different letters indicate group differences.
Group Mean Young’s test
Modulus (GPa) SD Range p (95%)
1 51.0 ab 1.7 3.9
0.012
2 50.3 ab 2.9 7.3
3 56.5 b 6.2 14.6
4 48.1 a 0.7 1.6
Group Ti Mo Zr S Sn p Sum
(%)
1 68.4 13.6 6.1 4.7 3.4 3.2 99.4
2 72.6 11.3 6.2 4.0 2.9 2.5 99.6
3 68.1 13.0 5.5 5.8 4.0 3.6 100.0
4 69.7 13.3 5.9 4.2 4.0 2.8 100.0
Wire dimensions
Signiicant diferences were found among the sizes of wires (Table 1). Groups 1, 3 and 4 had the same height (0.0165-in) which was larger than the dimension of G2 (0.0161-in). Regarding the width of the wires, G1, G2 and G4 had the same dimensions (0.024-in; 0.024-in; 0.0242-in, respectively), while G3 (0.0244-in) was dif-ferent from all of them, except for G4.
Mechanical properties
β-Ti wires from G3 showed the highest YM at 56.5
GPa, which was similar to G1 (51.0 GPa) and G2 (50.3 GPa). G4 showed the lowest YM (48.1 GPa), which was diferent from G3, but similar to G1 and G2 (Table 5).
Chemical composition
The wires from all groups showed similar composi-tion regarding Titanium (Ti), Molybdenum (Mo), Zir-conium (Zn), Sulfur (S), Tin (Sn) and Phosphorus (P), except for the wires from G2 which had a higher concen-tration of Ti and a lower concenconcen-tration of Mo (Table 6).
DISCUSSION
All groups produced similar force levels at 5 mm of deactivation, except for G2 which showed lower forces. Even though there were differences found in the dimensions of the wires, these differ-ences were small (ranging from 0.0004 to 0.0002) and probably unable to influence the results signifi-cantly. The neutral position of the loops is probably the factor that can best explain these differences. The amount of overlap of the vertical extensions of the loops, when in neutral position, may create an over or underactivation of the loop initially, which is the consequence of the shape of pre-activation of the
loop.17,18,21 In this study, however, the groups tested
had the same pre-activation shapes, which does not explain the differences found in neutral position. Chemical differences among wires, on the other hand, could influence how each particular brand of
β-Ti responds to the bends made to the design of
the loop, and could, therefore, play a major role in
causing these differences.3
G1 G2 G1 G2
Deactivation (mm) Deactivation (mm)
Moment (gf
.mm)
M/F (mm)
G3 G4 G3 G4
2200
1800
1200
800 2000
1400 1600
1000 2400
0.5
0 1 1.5 2 2.5 3 3.5 4 4.5 5
0.5 0 5
-5 10 15 20 25
1.5 3 4.5
All groups had similar composition, except for G2 which showed a higher percentage of Ti and a lower percentage of Mo. Even though this could explain only partially the diferences found (G2 produced low-er forces initially), it cannot explain why all groups, but G1 and G4, were diferent among themselves regard-ing the neutral position. The diferences might inally be explained by other factors, such as the
manufactur-ing process, which can alter the wires properties.3
Throughout deactivation, the TLSs from all groups acted diferently, except for G1 and G4. This result can be substantiated by the diferences found in LD rate.
These diferences can be explained by the design,9-13
method of pre-activation,11,12,13,16-18 and chemical
com-position of the wire3,19,20 and, inally, by the method of
manufacture of the wires.3 In this study, the design,
method of pre-activation and size of the wire were controlled. The similar chemical composition among groups, except for G2, could only partially explain the diferences because it does not explain the diferent be-havior of G3. The physical properties of the wires due to the manufacturing process might play a role on the subject, as well as how each beta-titanium wire brand responds to bends in the wire and stress relief, since the tensile test made found similar LD rates (Young’s
modulus) among all groups.21,22,24
The differences found in the moments among groups were similar, as the ones found in the force levels. In this study, the differences among groups were probably due to neutral position and stress relief
differences.21,22,24 This was expected, since the
residu-al moment, or the moment produced by the concen-trated bends, is related to the way each wire will
be-have to those particular bends.11,12,13,16-18 The effect of
bends in the behavior of the wires can be confirmed if data are mathematically adjusted to neutral posi-tion, as already shown in the literature, because it can subtract the effect of how the wires respond to bends
(Figs 8 and 9).17,18 This can be done by transposing
the x-intercept of each line of the graph to the ori-gin of the graph, along with every point of the line, isolating the effects of horizontal overlapping of the vertical extensions of the TLSs. It can be seen on the charts that the relation of force among groups is very similar to the relation of moments among them, if neutral position is not taken into consideration, and that TLSs behavior is pretty similar among groups.
Figure 9 - Figure 6 mathematically adjusted in order to isolate the effect of the overactivation on the moments produced by the groups caused by the overlapping of the vertical extensions.
0.5
0 1 1.5 2 2.5 3 3.5 4 4.5 5 5.5 6 6.5 7 G1 G2
Deactivation (mm)
Moment (gf
.mm)
G3 G4
2200
1800
1200
800 2000
1400 1600
1000 2400
Figure 8 - Figure 4 mathematically adjusted in order to isolate the effect of the overactivation on the force produced by the groups caused by the overlapping of the vertical extensions.
600 700
For
ce (gf
)
400
200
0 500
300
100
0.5
0 1 1.5 2 2.5 3 3.5 4 4.5 5 5.5 6 6.5 7 G1 G2
Deactivation (mm) G3 G4
Figure 10 - Figure 7 mathematically adjusted in order to isolate the effect of the overactivation on the MF ratios produced by the groups caused by the overlapping of the vertical extensions The force systems developed by the groups was quite similar.
G1 G2 G3 G4
0.5
0 1 1.5 2 2.5 3 3.5 4 4.5 5 5.5 6 6.5 Deactivation (mm)
M/F (mm)
0 5 10 15 20 25 30 35
MF rates is consistent with the similar behavior that they showed in neutral position (Table 2). G2 and G3 showed an inconsistent MF ratio on the last 2 mm of deactivation (G2) and very close to complete deactivation (G3) because of their positive neutral position (vertical extensions of the TLSs were apart). If the way each wire behaves in regards to neutral position was isolated (Fig 10) and removed ex-perimentally, the MF ratios of all wires would be the same. Unfortunately, that is something that would not occur clinically. This, however, does not mean that the wires from G2 and G3 should not be used clinically. They can be used, but a diferent approach is needed when those wires are used in loops. If a TLS is to be used, the clini-cian should compensate the diferences in the overlapping of the vertical extensions of the loop by opening less the in-ner “ears” of those two wire brands than what is normally
recommended for G1 (TMA).9,22
CONCLUSIONS
It can be concluded from the TLSs tested:
1. When they are made of diferent β-Ti wires, TLSs
produce diferent forces, moments and LD ratios.
2. The cause of these diferences is the way each wire behaves in relation to bends, thereby producing diferent shapes in neutral position.
3. Groups 1 (TMA) and 4 (CNA) showed a more con-sistent MF ratio throughout deactivation.
4. Even though groups 2 (BETA-FLEXY) and 3 (BETA III TIMO) behaved diferently from groups 1 and 4, this does not mean that they should not be used clinical-ly, but a diferent approach is needed when loops are used.
Acknowledgements
The authors thank Orthometric and OrthoOrganizers for the donation of their -Ti wires for this study.
Author contributions
Conceived and designed the study: RPM, LGV, RHS; Acquisition, analysis or interpretation: SGFRC; Data collection: AAR; Wrote the article: SGFRC, AAR; Critical revision of the article: RPM, LPM; Final ap-proval of the article: LPM; Statistical analysis: SGFRC.
1. Goldberg J, Burstone CJ. An evaluation of beta titanium alloys for use in orthodontic appliances. J Dent Res. 1979 Feb;58(2):593-99.
2. Verstrynge A, Van Humbeeck J, Willems G. In-vitro evaluation of the material characteristics of stainless steel and beta-titanium orthodontic wires. Am J Orthod Dentofacial Orthop. 2006 Oct;130(4):460-70.
3. Burstone CJ, Goldberg AJ. Beta titanium: a new orthodontic alloy. Am J Orthod. 1980 Feb;77(2):121-32.
4. Goldberg AJ, Burstone CJ. Status report on beta titanium orthodontic wires. Council on Dental Materials, Instruments, and Equipment. J Am Dent Assoc. 1982 Oct;105(4):684-5.
5. Donovan MT, Lin JJ, Brantley WA, Conover JP. Weldability of beta titanium arch wires. Am J Orthod. 1984 Mar;85(3):207-16.
6. Kapila S, Sachdeva R. Mechanical properties and clinical applications of orthodontic wires. Am J Orthod Dentofacial Orthop. 1989 Aug;96(2):100-9. 7. Johnson E. Relative stifness of beta titanium archwires. Angle Orthod. 2003
Jun;73(3):259-69.
8. Juvvadi SR, Kailasam V, Padmanabhan S, Chitharanjan AB. Physical, mechanical, and lexural properties of 3 orthodontic wires: an in-vitro study. Am J Orthod Dentofacial Orthop. 2010 Nov;138(5):623-30.
9. Burstone CJ, Koenig HA. Optimizing anterior and canine retraction. Am J Orthod. 1976 Jul;70(1):1-19.
10. Chen J, Markham DL, Katona TR. Efects of T-loop geometry on its forces and moments. Angle Orthod. 2000 Feb;70(1):48-51.
11. Faulkner MG, Fuchshuber P, Haberstock D, Mioduchowski A. A parametric study of the force/moment systems produced by T-loop retraction springs. J Biomech. 1989;22(6-7):637-47.
12. Martins RP, Buschang PH, Martins LP, Gandini LG Jr. Optimizing the design of preactivated titanium T-loop springs with Loop software. Am J Orthod Dentofacial Orthop. 2008 Jul;134(1):161-6.
REFERENCES
13. Viecilli RF. Self-corrective T-loop design for diferential space closure. Am J Orthod Dentofacial Orthop. 2006 Jan;129(1):48-53.
14. Hoenigl KD, Freudenthaler J, Marcotte MR, Bantleon HP. The centered T-loop: a new way of preactivation. Am J Orthod Dentofacial Orthop. 1995 Aug;108(2):149-53.
15. Kuhlberg AJ, Burstone CJ. T-loop position and anchorage control. Am J Orthod Dentofacial Orthop. 1997 Jul;112(1):12-8.
16. Manhartsberger C, Morton JY, Burstone CJ. Space closure in adult patients using the segmented arch technique. Angle Orthod. 1989 Fall;59(3):205-10. 17. Martins RP, Buschang PH, Viecilli R, dos Santos-Pinto A. Curvature versus v-bends
in a group B titanium T-loop spring. Angle Orthod. 2008 May;78(3):517-23. 18. Caldas SG, Martins RP, Galvão MR, Vieira CI, Martins LP. Force system evaluation
of symmetrical beta-titanium T-loop springs preactivated by curvature and concentrated bends. Am J Orthod Dentofacial Orthop. 2011 Aug;140(2):e53-8. 19. Lim Y, Quick A, Swain M, Herbison P. Temperature efects on the forces,
moments and moment to force ratio of nickel-titanium and TMA symmetrical T-loops. Angle Orthod. 2008 Nov;78(6):1035-42.
20. Rose D, Quick A, Swain M, Herbison P. Moment-to-force characteristics of preactivated nickel-titanium and titanium-molybdenum alloy symmetrical T-loops. Am J Orthod Dentofacial Orthop. 2009 Jun;135(6):757-63. 21. Caldas SG, Martins RP, Viecilli RF, Galvão MR, Martins LP. Efects of stress
relaxation in beta-titanium orthodontic loops. Am J Orthod Dentofacial Orthop. 2011 Aug;140(2):e85-92.
22. Marcotte M. Biomechanics in Orthodontics. Philadelphia: BC Decker; 1990. 23. World Health Organization. International Organization for Standardization, ISO
15841 dentistry-wires for use in orthodontics. Geneva, Switzerland: World Health Organization; 2006. p. 1-9.