Bull Pan Am Health Or&m X(3), 1982
SEROCONVERSION
RATES AND MEASLES
ANTIBODY
TITERS
INDUCED
BY MEASLES
VACCINE
IN LATIN
AMERICAN
CHILDREN
6-12 MONTHS
OF AGE’
Collaborative
Study by the Ministries
of Health of Brazil, Chile, Costa
Rica, Ecuador, and the Pan American Health Organization2
To help define the optimal age for measles vaccination in Latin America, a study was conducted of how 2,042 infants responded serologically to measles
vaccine in six study areas. The results suggest that localfactors affect the sero- conversion rate and that 90 per cent success can fird be attained by vaccinating at nine to 11 months of age, depending on the area. Postvaccination titers were
also found to vary, higher titers generally being observed in groups with higher seroconversion rates.
Introduction
Maternal antibodies against measles, trans-
mitted across the placenta, provide infants
with protection against measles in the first
several months of life. Over approximately the
same age span, these antibodies also interfere
with development of measles immunity fol-
lowing vaccination.
Several studies in the United States have
revealed that maternal antibodies may persist
in infants and may interfere with their re-
sponse to measles vaccine even beyond the
twelfth month of extrauterine life (1-4). Up to
22 per cent of the infants included in these stu-
dies failed to develop antibodies against mea-
sles when vaccinated at 12 months of age.
Children vaccinated at or after 14 months of
age had seroconversion rates of at least 93 per
cent. Since measles infection during the first
year of life is unusual in U.S. children (5), the
recommended age for routine administration
of measles vaccine in the United States has
been set at 15 months (6).
‘Also appearing in Spanish in the B&in de la Oficzna
Sanitaria Panamerlcana.
2A complete list of participants in the investigation ap- pears in Appendix 1.
However, in many other countries 30 per
cent or more of the children will have already developed measles by 12 months of age (7-8); the highest incidence of death due to measles occurs in the first two years of life; and mea- sles case-fatality rates in excess of 10 per cent have been noted in children under 12 months of age, especially in areas with a high preva-
lence of malnutrition (7-12). To delay measles
vaccination until 15 months of age in these
countries would be to allow a substantial per-
centage of the morbidity and mortality due to
measles to continue.
It has recently become clear that in coun-
tries where a large proportion of the measles
cases occur early in life, the response to early
vaccination may be better than in the United
States. A study in Kenya revealed that 92 per cent of the study infants beyond seven and a half months of age did not have detectable
hemagglutination-inhibition (HI) antibodies
to measles, and that over 90 per cent serocon-
verted after administration of measles vaccine
(13). Separate studies in Rhodesia, South
Africa, and Taiwan found that maximal post-
vaccination seroconversion rates were reached
at nine months of age (14-16).
In Latin America, the reported incidence of
measles and measles-related deaths in young
Collaborative Study l MEASLES VACCINATION IN LATIN AMERICA 273
infants is high, as it is in Africa and South
Asia, but these statistics are notoriously un-
reliable. Furthermore, the age-specific distri-
bution of measles cases is influenced not only
by the age at which maternal protection is lost,
but also by other factors which affect the rate
of virus circulation. Therefore, age-specific at-
tack rates cannot be used by themselves to es- timate the optimal age for vaccination.
The level of maternal antibody has been
shown to correlate with the level of measles
antibody in cord blood, and infants whose
mothers have lower levels of measles antibody
are more likely to seroconvert to measles im-
munity at a younger age (1,13,17). Also, in-
fants born prematurely have been shown to
seroconvert to measles vaccine at younger
ages than term infants, presumably because
they receive less maternal antibody before
birth (18). Although the initial level of ma-
ternal antibody does correlate with the dura-
tion of infant protection, it is not known
whether other factors influence the rate at
which children lose maternal antibody to be-
come susceptible to measles and responsive to measles vaccine. Race, anemia, and underly-
ing nutritional status may be relevant factors.
The purpose of the study reported here was
to determine the relationships which may exist
between nutritional status, place of residence
or geographic area, and that refractoriness to
measles vaccine which is a normal effect of
passively acquired antibody in young infants.
A knowledge of these relationships might
make it possible to estimate the best age for
administering measles vaccine without carry-
ing out independent studies in every area.
Knowing this optimal age is important, be-
cause measles vaccine is too expensive for
many countries to administer repeatedly, and
because once a particular response is obtained
it cannot readily be boosted by more vaccine.
Materials and Methods
A single lot of the Moraten strain of further-
attenuated measles vaccine was used to per-
form the study.
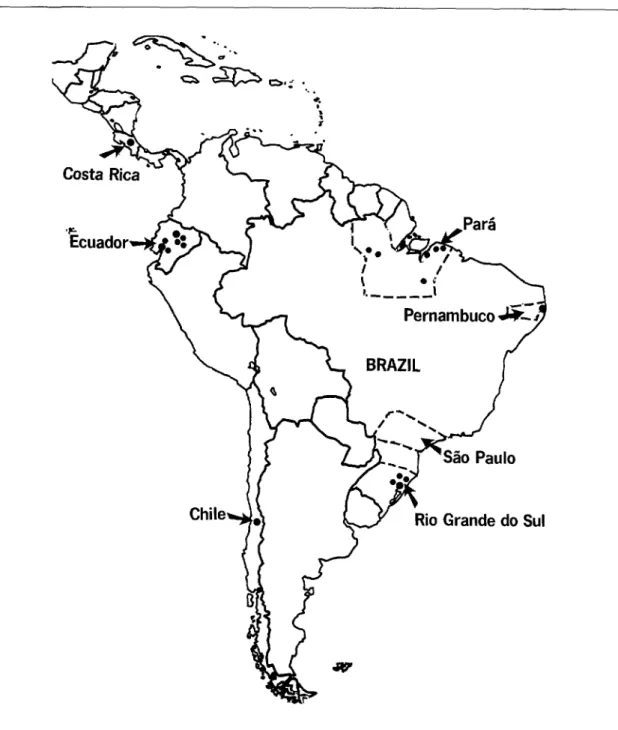
Vaccination trials were initiated in seven
geographic areas: Costa Rica; Ecuador; Me-
tropolitan Santiago, Chile; Rio Grande do
Sul, Brazil; Metropolitan SZo Paulo, Brazil;
Pernambuco, Brazil; and several towns in the
state of Par& Brazil. These areas are shown in Figure 1. The plan was to select children six
through 12 months old for vaccination in such
a way that each of seven one-month age
groups in each area would contain 70 subjects.
This would have meant vaccinating 490 chil-
dren in each area and would have brought the
total sample size to 3,430 subjects. It was
agreed that these studies would be undertaken in the off-season in those areas where measles is seasonal, and that if a major epidemic broke
out, the program would be suspended. An
epidemic did break out in Costa Rica, and it
proved impractical to resume the program.
The data obtained from that country were
therefore inadequate for analysis.
It was considered desirable that the children
in each geographic area be evenly distributed
between urban and rural populations, and
participating clinics were chosen with this aim
in mind. All the children coming to these clin- ics were invited to participate if they (1) were
in the appropriate age group, (2) had not been
previously vaccinated and had no history of
prior measles, (3) did not have fever at the
time of presentation, and (4) had a weight that
was at least 60 per cent of the norm for their age (19,20). In Rio Grande do Sul, S?io Pau-
lo, and Santiago intensive vaccination pro-
grams had already reduced the number of un- vaccinated children 10 months of age or more, so that these groups were not proportionately represented in the initial sample. Vaccination
records from the participating clinics in these
areas were searched, and unvaccinated chil-
dren in the upper age groups were actively sought out. Despite these efforts, the desired numbers of vaccinees were not attained in SZo
Paul0 or Santiago. The numbers of vacci-
nated children in Ecuador likewise failed to
274 PAHO BULLETIN ’ vol. IS, no. 3, ~98i?
Figure 1. Location of measles vaccination trials.
:
l E h ---mm I-2 .r--
Collaborative Study l MEASLES VACCINATION IN LATIN AMERICA 275
administrative changes of a political nature.
As already noted, any child with a history of
measles or measles vaccination was excluded
from the study. In addition, serologic studies
showed that prevaccination specimens from
74 children yielded HI titers of 1:20 or more.
It is improbable that passive antibody would
frequently persist at this titer in children more than six months old. These titers were there-
fore considered indicative of unrecognized
prior measles infection, and the children pro-
viding these specimens were excluded from
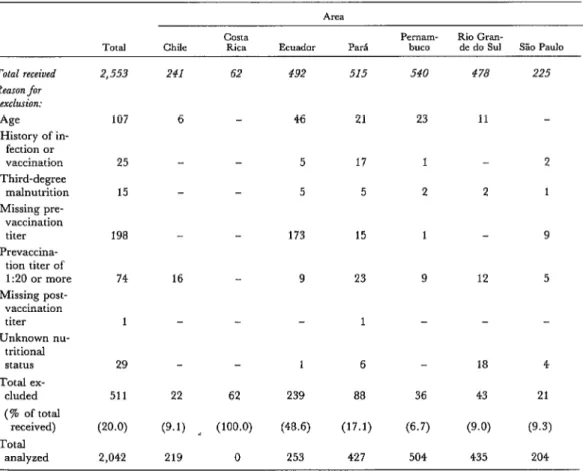
further analyses. Fifteen children were ex-
cluded because they did not meet the age-for-
weight standard, and others were excluded
because of incomplete data (Table 1). The fi-
nal sample was distributed as shown in Table
2.
The definition of rural versus urban locales
proved to differ in the different study areas.
The Par6 sample resided entirely in small
cities or large towns and surrounding farming
areas. About half the Ecuadorian sample
came from one of the two largest cities (Quito
and Guayaquil), while the other half came
from small cities, towns, and farms. Most of
the study children in Pernambuco came from
the city of Recife while those with ostensibly
“rural” residences lived in compact towns
located in an agricultural area. In Santiago,
Rio Grande do Sul, and SPo Paulo, the “ru-
ral” residence places were periurban. This
situation made invalid any comparison of the
total urban population with the total rural
population.
Aside from excluding those subjects who
Table 1. Numbers of forms received and numbers progressively excluded, by area.
Total Chile COSta Rica Ecuador P& P~Ill~- buco Rio Gran- de do Sul S% Paul0
Total received 2,553 241 62 492 515 540 478 225
Reason for
exclusion:
AIF 107 6 46 21 23 11
History of in- fection or
vaccination 25 - 5 17 1 2
Third-degree
malnutrition 15 5 5 2 2 1
Missing pre- vaccination
titer 198 173 15 1 9
Prevaccina- tion titer of
1:20 or more 74 16 9 23 9 12 5
Missing post- vaccination
titer 1 1 -
Unknown nu- tritional
status 29 - 1 6 18 4
Total ex-
cluded 511 22 62 239 88 36 43 21
(% of total
received) (20.0) (9.1) __ (100.0) (48.6) (17.1) (6.7) (9.0) (9.3)
Total
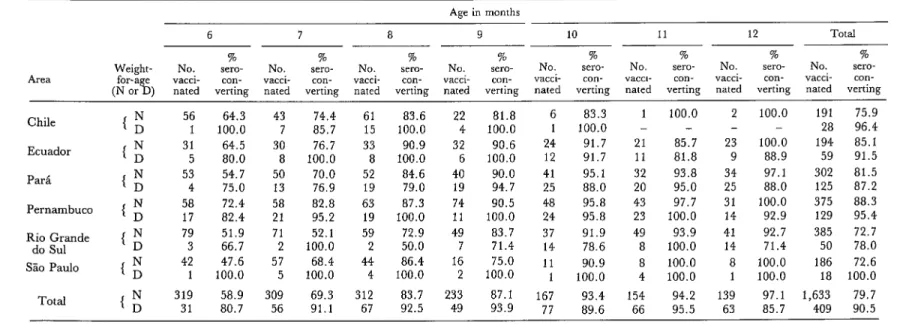
Table 2. Numbers of children receiving measles vaccine in each area and percentages seroconverting, by age and weight-for-age.
Area Weight-
Age in months
6 7 8 9 10 11 12 Total
% % % % % % % %
No. sero- No. Set-O- NO. XXO- No. Set-O- NO. sero- NO. sero- NO. %TO- NO. sero-
con- vacci- con- vacci- con- vacci- con- vacci- con- vacck con- vacci- con- vacci- con- verting nated verting nated verting nated verting nated verting nated verting nated verting nated verting
Chile
Ecuador
ParC
Pernambuco
Rio Grande do Sul
So Paul0
Total 56 1 31 5 53 4 58 17 79 3 42 1 319 31
64.3 43 74.4 61 83.6 22
100.0 7 85.7 15 100.0 4
64.5 30 76.7 33 90.9 32
80.0 8 100.0 8 100.0 6
54.7 50 70.0 52 84.6 40
75.0 13 76.9 19 79.0 19
72.4 58 82.8 63 87.3 74
82.4 21 95.2 19 100.0 11
51.9 71 52.1 59 72.9 49
66.7 2 100.0 2 50.0 7
47.6 57 68.4 44 86.4 16
100.0 5 100.0 4 100.0 2
58.9 309 69.3 312 83.7 233
80.7 56 91.1 67 92.5 49
81.8 100.0 90.6 100.0 90.0 94.7 90.5 100.0 83.7 71.4 75.0 100.0 87.1 93.9
6 83.3 1
1 100.0 -
24 91.7 21
12 91.7 11
41 95.1 32
25 88.0 20
48 95.8 43
24 95.8 23
37 91.9 49
14 78.6 8
11 90.9 8
1 100.0 4
167 93.4 154
77 89.6 66
100.0 2 100.0 -
85.7 23 100.0
81.8 9 88.9
93.8 34 97.1 95.0 25 88.0 97.7 31 100.0 100.0 14 92.9
93.9 41 92.7 100.0 14 71.4 100.0 8 100.0 100.0 1 100.0
191 28 194 59 302 125 375 129 385 50 186 18
94.2 139 97.1 1,633
95.5 63 85.7 409
Collabomtive Study l MEASLES VACCINATION IN LATIN AMERICA 277
were markedly underweight, the study did
not select subjects on the basis of nutritional status. A subject’s actual weight relative to the expected weight at that age was used to screen
rapidly for malnutrition. Any child whose
weight was between 60 and 85 per cent of the median weight for its age on a U.S. standard
curve (20) was designated as belonging to an
underweight (“D”) group. Others were des-
ignated as belonging to a normal (‘ ‘N”)
group.
Each child was weighed, and a blood sam-
ple was collected before vaccination. The
blood was taken by finger-prick and capillary
tube in Ecuador and by venipuncture and sy-
ringe elsewhere. The infant’s birth date was
recorded. Twenty-eight to 35 days later, the
subject returned to the clinic and a second
blood sample was collected. Serum was sepa-
rated in the country of origin. This was to
have been done promptly after the blood had
clotted, but because of the large number of
clinics involved no real control could be main- tained. In general, the amount of hemolysis
was small except in the Ecuadorian samples,
where the finger-prick procedure was asso-
ciated with substantial cell lysis. Sera were
frozen at - 2O’C and stored in the country of
origin until the whole collection could be
taken by courier to the Instituto Evandro
Chagas in Belem, Brazil, for testing. A single lot of measles antigen (from Microbiological
Associates of Bethesda, Maryland, U.S.A.)
was used to measure serum HI titers accord- ing to a standard procedure (,?I), starting with a dilution of 1:5.
Children who demonstrated a fourfold or
greater increase in titer -and whose second
specimen yielded a titer of at least 1:lO were considered to have seroconverted.
Geometric mean titers were calculated by
including titers of 1:5 but not titers below that level. In our analyses, a titer of 1: 10 or greater
was taken as an indication of sufficient re-
sponse to provide lasting protection. A titer of
1:5, when accompanied by a negative test on
an earlier serum specimen, was taken as in-
dicative of some reaction and hence was in-
cluded in computing mean titers. We consider
it probable, however, that the normal decline
in titer that occurs more than one month after
vaccination would leave these children with-
out protective antibody levels. (Only 54 chil-
dren, 2.6 per cent of the study population, had
postvaccination titers of 1:5.)
A modified linear logistic model was used to relate the variables studied to the percentages
of children seroconverting (see Appendix 2).
This model caused the relationship between
percentage seroconversion and age to be ex-
pressed as a straight line. (The probability of
seroconversion was assumed constant within
each age group.)
Results
A preliminary analysis showed that urban
versus rural residence was not significantly
correlated with seroconversion in any area ex-
cept Santiago. The number of rural children in the Santiago area was small, and this was especially true in the upper age groups. For these reasons, this variable was omitted from
further consideration, leaving age, weight-for-
age, and geographic study area as the vari-
ables subjected to further analysis.
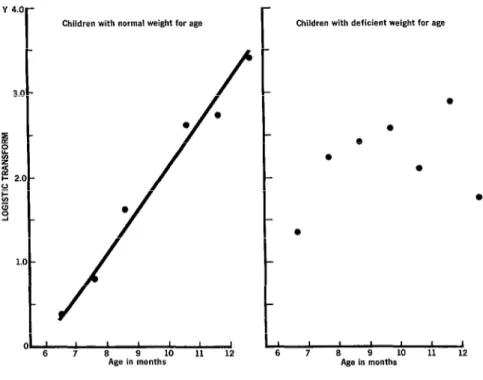
As a second step, data for the two nutrition-
al groups were compared (Figure 2). The
overall proportion of underweight children in-
creased with age, suggesting progressive nu-
tritional deterioration within the study popu-
lations.
The N-group data fit a straight line closely
and showed a strong relationship between the
proportion seroconverting and age. Although
there were 409 children in the D group, the
number that failed to seroconvert was relative- ly small in all age groups; a linear relationship
between seroconversion and age could not be
detected. Inspection of the data shows, how-
ever, that for most age groups the proportion
278 PAHO BULLETIN . vol. 16, 120. 3, 1982
Y 4.0-
3.0 -
I B L s I- 2.0 - o- cl z 9 -
1.0 -
Figure 2. Regression of seroconversion on age for all areas.
Children with normal weight for age Children with deficient weight for age
8 9 10
Age in months
was at least equal to the proportion of N-
group children who did so.
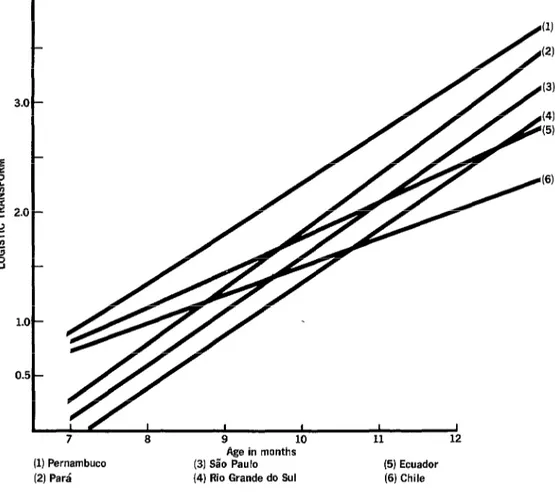
Inter-Area Comparisons
Comparison of seroconversion rates be-
tween different areas was confined to the
1,633 children in the N group. The slopes of
the regression lines for individual areas (Fig-
ure 3) are very similar in all akeas except
Ecuador and Chile. Since the slopes did not differ from one another (P> .05), it was con- cluded that the data may be represented by a model in which the areas have parallel lines-
that is, lines with a common slope but with
different intercepts. Ecuador, Chile, and Par&
l
I I I I 1 I I
6 7 8 9 10 11 12
Age in months
have almost identical intercepts, while Per-
nambuco has the highest elevation and Rio
Grande do Sul the lowest. At the .05 signifi-
cance level, Pernambuco was found to be dif-
ferent from all other areas; Ecuador, Chile,
Par& and S&o Paulo were not different from each other; and Rio Grande do Sul was not different from SPo Paulo but was significantly different from all other areas.
Therefore, it was concluded that the data
are best represented by a model using three
lines with the same slope but different inter-
cepts for Pernambuco, Rio Grande do Sul,
and the pooled data from Chile, Ecuador,
Par& and SZo Paulo, respectively. It should
Collaborative Study l MEASLES VACCINATION IN LATIN AMERICA 279
(1) Pernambuco (2) Para’
Figure 3. Regression of seroconversion on age for children
with normal weight-for-age.
Age in months (3) Sa’o Paul0 (4) Rio Grande do Sul
of the variation in the weighted transformed
logistic values of the proportions seroconvert-
ing.
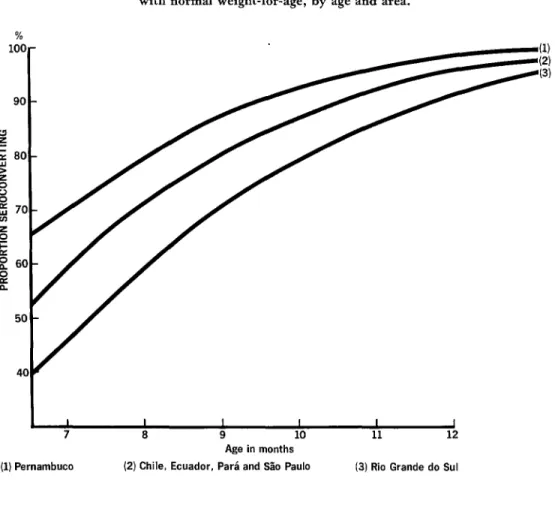
Seroconversion Rates by Age
In accordance with the preceding conclu-
sions, the resulting estimates for the propor-
tions seroconverting are shown in Figure 4.
The curve for Pernambuco lies above the
curve for the four pooled areas-Chile, Ecua-
dor, Par&, and Slo Paulo-and the curve for
(5) Ecuador (6) Chile
Rio Grande do Sul lies below.
These curves provide a basis for estimating
the average age at which vaccination is ex-
pected to result in a prespecified proportion of
seroconversions, under conditions similar to
those prevailing for the children studied. The
resulting estimates are shown in Table 3.
These indicate that the children should be 8.5
months old to attain a seroconversion rate of
80 per cent, and that they should be vacci-
nated one-and-a-half months later to attain a
280 PAHO BULLETIN . vol. 16, no. 3, 19&?
%
1oa90
5c
4( l-
, -
I-
)-
#
I-
I )-
14
L
Figure 4. Average predicted percentages seroconverting among children with normal weight-for-age, by age and area.
I 7
I 8
I I
9 10
Age in months
I I
11 12
(2) Chile, Ecuador, Par& and SHo Paul0 (3) Rio Grande do Sul
Table 3. Estimated mean vaccination ages needed
to attain seroconversion rates of 80 and 90 per cent, by area.
Area
Pernambuco Rio Grande do Sol All other areas
Average age in month?
80% 90%
seroconversion seroconversion
7.4 months 9.0 months 9.4 months 11 .O months 8.4 months 10.0 months
aAnalysis using upper one-sided 95 per cent confidence inter- vals indicates a. seroconversion rate as high as the one stated may be achievable at ages 10 to 15 days lower than the averages shown
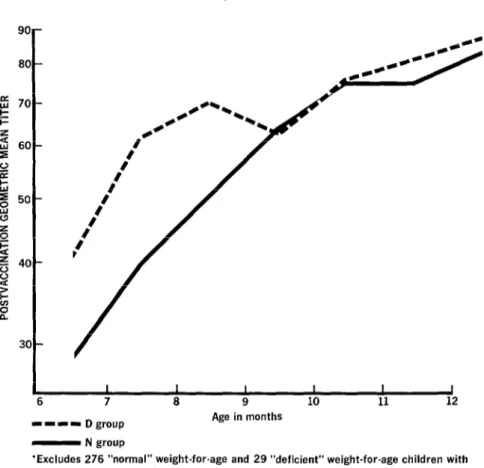
Serologic Titers
Not only did the proportion of study chil-
dren responding to the vaccine increase with
increasing age, but the geometric mean titers
(GMT) obtained four weeks after vaccination
also increased with age (Figure 5). For exam-
ple, the GMT for the average six-month-old
N-group child was 29, while for the average
twelve-month-old child it was 83. The titers
for D-group children were generally higher
Collaborative Study l MEASLES VACCINATION IN LATIN AMERICA 281
Figure 5. Postvaccination geometric mean titers
(GMT),* by age, for N and D groups in
all the study areas combined.
6 7 8 9 10 11 12
-1-1 Dgroup Age in months
- N group
‘Excludes 276 “normal” weight-for-age and 29 “deficient” weight-for-age children with non-detectable postvaccination titer.
There were also differences in the mean
titers obtained from subjects in different
areas. Table 4 presents the mean of the GMTs
for the six, seven, eight, and nine-month age
groups in six areas. The older age groups were not included for lack of adequate numbers of subjects in some areas. The rank order of the
areas determined by these GMTs is very sim-
ilar to that determined by the rate of serocon-
version for the same age groups (P = 0.01 for
Spearman’s rank correlation test).
Table 4. Geometric mean titers (GMT) and percentages seroconverting in the 6-9 month age groups four
weeks after vaccination, by area.
%
AXa GMT SerOcO”“erS*O”
Slo Paul0 28.4 71.3
Rio Grande do Sul 30.9 65.0
Chile 39.6 78.1
Par& 60.3 75.5
Ecuador 61.8 83.3
282 PAHO BULLETIN l vol. 16, no. 3, 1982
Discussion and Conclusions
Except in Pernambuco, the South Ameri-
can seroconversion rates observed were inter-
mediate between those observed in Africa (13-
15) and North America (l-4,18). The Per-
nambuco results were not significantly differ-
ent from the results obtained in Kenya (13)
and Taiwan (IS). It remains difficult, how-
ever, to discover a basis on which these results might be generalized so as to make predictions
regarding untested areas. It may be that the
factor or factors that determine the response
rate are influenced by economic development of the area, but we have no specific compari-
son data for the Brazilian states.
The observed seroconversion rates were not
attributable to nutritional deficits, such as
those recognized by the division between the
D and N groups, because on the average the
underweight children did not respond less fre-
quently than the normal-weight ones. The
empirical observation of higher seroconver-
sion rates in the D group is consistent with the
higher titers observed in these children. It
may seem implausible that poorly nourished
children would not be impaired in their im-
mune responses, but in this case the capability
for seroconversion reflects the absence of pas-
sive protection.
In view of the observed differences between
seroconversion rates in different areas, it was
surprising that urban-rural differences were
not demonstrable within individual areas. Not
only did the Ecuadorian response rates in cit-
ies fail to differ from those in small towns, but the Par6 response rates in small towns did not
differ from those in the surrounding farm
areas.
The fact that the postvaccination titer varies
with the subjects’ age at vaccination is a new
observation relevant to choosing the age at
which measles vaccine should be adminis-
tered. This study chose to take a titer of 1: 10
at four weeks postvaccination as the lower
limit of a positive response, because it was felt
that normally occurs in the year after vaccina-
tion, this is the lowest ‘titer that would corre-
late with solid immunity. Conversely, it was
believed that any titer of 1: 10 or higher would
correlate with immunity, and that titer differ-
ences in this range would have little effect on the child.
After the first year, however, measles anti-
body titers remain remarkably stable for the
rest of a person’s life. Titers above 1:2 are not
usually boosted by reexposure to measles vi-
rus-because these levels prevent virus repli-
cation and because the amount of antigen in an infecting dose, or in a dose of vaccine, is in-
adequate by itself to stimulate the immune
system. Children with such levels will there-
fore maintain only low levels throughout their
lives.
This means that female children with low
titers who grow to become mothers will have very little anti-measles IgG to pass on to their
offspring, and so the children of these vac-
cinees will be susceptible to measles infection at a very early age, when the risk of death is
particularly high. Such antibody titer suppres-
sion is more pronounced in areas where the
seroconversion rate is low than in areas where
good early response rates are obtained. This
fact serves to underscore the importance of us-
ing the locally appropriate age for vaccina-
tion.
To determine the optimal age for vaccina-
tion in any given area, it is necessary to couple
these data on seroconversion rates and titers
with the following information:
(a) Local age-specific measles morbidity
and mortality rates, so as to determine how
much harm would be done by measles in chil- dren below the age chosen for vaccination.
(b) The prospects for having a sufficiently
comprehensive and consistent program to re-
duce the amount of virus in circulation. Re-
duction of virus circulation reduces the num-
ber of children infected at an early age. This is
an important short-term consideration in de-
termining when the vaccine should be given,
Collaborative Study l MEASLES VACCINATION IN LATIN AMERICA 283
rates. It will also have importance for the next is given, the more failures must be expected.
generation, when susceptibility in the young- If these failures are sufficiently common to
est age groups will be determined by the age at damage the credibility of the program, partic-
which vaccine is given now. ipation will wane and the program may fail for
(c) The attitude of the local population to- lack of public confidence.
wards vaccine failure. The earlier the vaccine
SUMMARY
Studies in the United States have shown that maternal antibodies against measles may persist in infants and mav interfere with their resoonse to measles vaccine’even beyond the twelfth month of extrauterine life. Since measles infection during the first year of life is unusual in the U.S., the recom- mended age for vaccination against measles in that country has been set at 15 months.
On the other hand, infants in a number of Afri- can countries have been found to contract measles earlier. and so delavina vaccination I ” until 15 months would allow a substantial amount of measles mor- bidity and mortality to continue. For this reason, the generally recommended age for measles vacci- nation in Africa is seven-and-a-half months.
To help define the situation in Latin America, a study was conducted of how 2,042 infants six to 12 months old responded to measles vaccine. The re-
sults showed that seroconversion rates in Latin
American children were generally intermediate be-
tween the previously reported rates for Africa and those for the United States. Infants whose weights were 60 to 85 per cent of normal for their ages seem to have good seroconversion rates relative to chil- dren closer to the weight-for-age norm.
In general, postvaccination antibody titers were lower for younger than for older infants. There is no evidence that these lower titers will impair im- munity in these infants, but when the female in- fants grow up and have children, their lower anti- body levels could cause them to pass lower levels of maternal antibodies to their children and so could permit measles infection at an earlier age in the next generation.
The choice of an optimal age for vaccination at any given place in South America should take local factors into account, but in general the best age should be less than the 15 months recommended in
the U.S. and more than the seven-and-a-half
months recommended in Africa.
REFERENCES
(I) Yeager, A. S., J. H. Davis, L. A. Ross, and B. S. Harvey. Measles immunization successes and failures. JAMA 237~347-351, 1977.
(2) Shasby, D. M., T. C. Shope, H. Downs, K. L. Herrmann, and J. Polkowski. Epidemic measles in a highly vaccinated population. N En&J Med 296:585-589, 1977.
(3) Albrecht, P., F. H. Ennis, E. J. Saltzmen, and S. Krugman. Persistence of maternal antibody beyond twelve months: Mechanisms of measles vaccine failure. J Pediatr 91:715-719, 1977.
(4) Krugman, R. D., R. Rosenberg, K. McIn- tosh, K. Herrmann, J. Witte, F. H. Ennis, and B. Meyer. Further attenuated measles vaccines: The need for revised recommendations. J Pediatr 91:766-767, 1977.
(5) Centers for Disease Control. Measles Sur- veillance Report Number 10, 1973-1976. Atlanta, Georgia, July 1977.
(6) United States Centers for Disease Control. Recommendations of the Immunization Practices Advisory Committee: Measles Prevention. Morbid- ity and Mortali Weekly Report 31:217-231, 1982.
(7) Morley, D. C. Measles in the developing world. PYOC R SocMed 67:1112-1115, 1974.
(8) Morley, D. C. Severe measles in the tropics. Br Med J 1:297-300, 1969.
(9) Scheifele, D. W., and C. E. Forbes. Pro- longed giant cell excretion in severe African mea- sles. Pediatrics 50:867-873, 1972.
(10) Dossetor, J., H. C. Whittle, and B. M. Greenwood. Persistent measles infection in mal- nourished children. BrMedJ 1:1633-1635, 1977.
(II) Puffer, R. R., and C. V. Serrano. Pattm of Mortal+ in Childhood. PAHO Scientific Publication No. 262. Pan American Health Organization, Washington, D.C., 1973.
284 PAHO BULLETIN l vol. 16, no. 3, 1982
and A. Hakue. Synergistic impact of measles and diarrhoea on nutrition and mortality in Bangla- desh. Bull WHO (in press).
(13) World Health Organization. Measles im- munity in the first year after birth and the optimum age for vaccination in Kenyan children. Bull WHO 55:21-31, 1977.
(14) Burrowes, J., and J. G. Cruickshank. At what age should measles vaccine be given? Cen AfrJ
Med 22:45-47, 1976.
(15) Dick, B., T. Smith, and A. Kipps. A mini- mum age for measles vaccine administration to col- oured children. S Afr Med J 49: 1951-1954, 1975.
(IS) Lee, Y. L., F. L. Black, C. L. Chen, C. L. Wu, and L. L. Berman. The optimal age for vacci- nation against measles in an Asiatic city, Taipei, Taiwan: Reduction of vaccine-induced titer by re- sidual transplacental antibody. Int J Ebidemiol (in press).
(17) Aceves Sainos, D., et al. Estudio de la per- sistencia de inmunidad transplacentaria antisaram-
pi&. Salud Ptiblica Mex 18(6):973-980, 1976. (18) Wilkins, J., P. F. Wehrle, and B. Portnoy. Live further attenuated rubeola vaccine: Serologic responses among term and low birth weight infants. Am J Dis Child 123: 192, 1972.
(19) Gomez, F., R. Ramos Galvan, J. Cravioto, and S. Frenk. Malnutrition in infancy and child- hood with special reference to Kwashiorkor. Adv Pediatr 7:131-169, 1955.
(20) World Health Organization. A Growth Chart for International Use in Maternal and Child Health Care. Geneva, 1978.
(21) Black, F. L. Measles. In E. H. Lennette, E. H. Spalding, and J. P. Truant (eds.). Manual of Clinical Microbiology (2nd ed.) American Society of Microbiology, Washington, D.C., 1974, pp. 709- 715.
(22) Box, G. E. P., and D. R. Cox. An analysis of transformations. J Roy Stat SOG (Ser. B) 26:211-
Collaborative Study l MEASLES VACCINATION IN LATIN AMERICA 285
APPENDIX 1: MEASLES INVESTIGATION PARTICIPANTS
BRAZIL: Fundacgo Services do SaGde Publica (FSESP)--Francisco Ferraz, Fer-
nandoJ. P. Gomes, Jacques N. Manceay Francisco de P. Pinheiro, Orlando Pira$ Ribeiro, Maria Antonia Rodrigues, Erineide Miguel da Silva, Amelia
Travassos da Rosa, Jorge Travassos da Rosa; Escola Paulista de Medicina
(SPo Paulo, Slo Paula)-Azarias de A. Carvalho; Instituto Materno In-
fantil de Pernambuco (Recife, Pernambuco)-Eliana Siqueira Campos,
Fernando Figueira; Secretaria de SaGde e do Meio Ambiente (Port0
Alegre, Rio Grand0 do Sul)-Marlo Libel
CHILE: Ministerio de Salud (Santiago)-J ose’ Borgorio, Irma Ganepa, Hector Ro-
driguez, Maria Isabel Vergara, Patricia Vicent
COSTA RICA: Ministerio de Salud (San Jose)- Willy Carrillo, Maria Leon de Co-
to, Jorge Ramirez
ECUADOR: Ministerio de Salud (Quito)-Humberto Baquero, Jose’ Cederio, Gre-
cia Diaz de Terrin, Ernest0 Gut&ret, Edison Jimenez, Arturo Ortiz, Gua- dalupe Perez de la Sierra, Letty Ruin, Silvio Torres, Magdalena Vanoni
PAN AMERICAN Italo Barragan, Francis L. Black (short-term consultant,
HEALTH Yale University School of Medicine, New Haven, Con-
ORGANIZATION: necticut), Neal Halsey (short-term consultant, Tulane Uni-
versity Department of Tropical Medicine, New Orleans,
Louisiana), Cesar A. Mendiza’bal Morris, Renate Plaut, Ciro
A. de Quadros, James Rust, John J. Silvi, Federico G. Varela
APPENDIX 2: STATISTICAL NOTE
A modified linear logistic model (22) was used; the logistic transform being
defined as
Yi = In [(Pi + 1/2ni) / (l-Pi + 1/2ni)],
where Pi denotes the proportion of children who seroconverted among a total of
ni vaccinated children in the ith age group.
For the weighted least squares analysis, weights were assigned to the ith age group by the multiplier
Wi = ni [ (Pi + 1/2ni) + (1 -Pi + 1/2ni) ] 1/Z