ISSN 0104-6632 Printed in Brazil
www.abeq.org.br/bjche
Vol. 29, No. 01, pp. 77 - 86, January - March, 2012
Brazilian Journal
of Chemical
Engineering
EX-SITU BIOREMEDIATION OF BRAZILIAN
SOIL CONTAMINATED WITH PLASTICIZERS
PROCESS WASTES
I. D. Ferreira
*and D. M. Morita
Hydraulic and Environmental Engineering Department, Polytechnic School, University of São Paulo, Av. Prof. Almeida Prado, trav. 2, 83, Butantã, Zip Code: 05508-900, São Paulo - SP, Brazil.
E-mail: [email protected]
(Submitted: January 12, 2011 ; Revised: August 10, 2011 ; Accepted: August 15, 2011)
Abstract - The aim of this research was to evaluate the bioremediation of a soil contaminated with wastes from a plasticizers industry, located in São Paulo, Brazil. A 100-kg soil sample containing alcohols, adipates and phthalates was treated in an aerobic slurry-phase reactor using indigenous and acclimated microorganisms from the sludge of a wastewater treatment plant of the plasticizers industry (11gVSS kg-1 dry soil), during 120 days. The soil pH and temperature were not corrected during bioremediation; soil humidity was corrected weekly to maintain 40%. The biodegradation of the pollutants followed first-order kinetics; the removal efficiencies were above 61% and, among the analyzed plasticizers, adipate was removed to below the detection limit. Biological molecular analysis during bioremediation revealed a significant change in the dominant populations initially present in the reactor.
Keywords: Bioremediation; Phthalates; Adipates.
INTRODUCTION
Plasticizers are widely used industrial chemicals, serving as additives in polyvinyl chloride, polyvinyl acetate, cellulosic and polyurethane resins and imparting flexibility and workability (Brown et al., 1996). These compounds are released to the environment through production, manufacturing, use, and final disposal and, due to the large-scale use of plastics, plasticizers are one of the main potential sources of environmental contamination (Staples et al., 2000; Fromme et al., 2002; Fernandez et al., 2007; Zeng et al., 2009). Phthalates and adipates, the most utilized plasticizers, are chemicals that display hydrophobic and lipophilic characteristics and tend to accumulate in soils. The higher phthalates such as di-ethylhexyl phthalate (DEHP) interfere with the development of reproductive organs by acting as a mimic of the sex hormone estrogen (Harris et al.,
1997; Paganetto et al., 2000; Petrovic & Barceló, 2000; Swan, 2008).
Bioremediation has been applied to treat phthalate-contaminated soils (Wang et al., 2004; Di Gennaro et al., 2005), but most of the literature studies involving biodegradation of phthalates in soils have been performed on a laboratory scale in temperate climate zones with synthetically contaminated soils, pure cultures of microorganisms and with only phthalates (Madsen et al., 1999; Cartwright et al., 2000; ; Chatterjee & Dutta, 2003; Vega & Bastide, 2003; Chang et al., 2004; Zeng
To collaborate with information on field research evaluating bioremediation performance in Brazilian soils contaminated with wastes from plasticizers industries, this research used a slurry-phase reactor to investigate the biodegradation of phthalates, adipates and alcohols present in a real contaminated soil by indigenous and acclimated microorganisms from the sludge of the wastewater treatment plant of the plasticizers industry.
MATERIALS AND METHODS
The industry built on contaminated soil is located in São Paulo, Brazil, since 1950 and occupies a total area of 800,000 m2. The plasticizers produced by this plant include DIBP (Diisobutyl phthalate), DBP (Dibutyl phthalate), DIAP (Diisoamyl phthalate), DEHP (Di-2-etylhexyl phthalate), DIDP (Diisodecyl phthalate) and DOA (dioctyl adipate). The location of the sample collection point of the contaminated soil was chosen on the basis of containing the largest amount of free phase removed from existing pumping wells, for being near the reactors and storage tanks of products in a place allowing the removal of the industrial floor.
Collection of the Soil Sample for Characterization and the Bioremediation Test
Approximately 110 kg of soil were collected at a depth between 1 and 2 m at the plasticizers contaminated site; this amount was manually homogenized and 100 kg were segregated for the bioremediation test. Samples for physical and chemical analyses were refrigerated at 4°C in the laboratory until they were analyzed. The soil granulometric curve, pH(CaCl2), pH(KCl), pH(H2O), ion exchange capacity and potential acidity, Total Organic Carbon (TOC), Total Phosphorus and Total Kjeldahl Nitrogen (TKN) were determined in triplicate using the Instituto Agronômico de Campinas - IAC (Van Raij et al., 2001) and Empresa Brasileira de Pesquisa Agropecuária – EMBRAPA (Silva, 1999) methods. The moisture content was assessed according to CETESB L6.350 Standard (CETESB, 1990). Samples for the microbiological characterization were immediately frozen.
Collection and Characterization of the Sludge Used in the Bioremediation Test
The collection of samples was performed in 100 mL glass bottles in the excess sludge wasting line of
the activated sludge system of the plasticizers industry. Samples were refrigerated at 4°C in the laboratory until they were analyzed. Samples for microbiological characterization were immediately frozen. The pH and temperature were determined immediately after collection. Total Suspended Solids (TSS) and Volatile Suspended Solids (VSS), Total Organic Carbon (TOC), Total Phosphorus and Total Kjeldahl Nitrogen (TKN) were determined according to Standard Methods for the Examination of Water and Wastewater (Eaton et al., 2005).
Determination of the Concentrations of Plasticizers and Alcohols in Soil, Sludge and Slurry Samples
The extractions of contaminants in the soil, sludge and slurry matrix were performed according to method 3540 of the USEPA (1996). The concentrations of contaminants were determined by gas chromatography according to method 8061A of the USEPA (1996). The operational conditions for gas chromatography (Varian CP-3380) were:
Injection: volume of 2μL of the extract obtained by method 3540; splitless mode (no division of the sample); temperature: 280ºC;
Oven: initial temperature at 40ºC for 2 minutes, temperature ramp of 20ºC minute-1 and final temperature at 300ºC;
Column: RTX - 35 Restec (cross-linked methyl silicone), 0.32-mm internal diameter, 30-m length and 1.5-μm film thickness. Carrier gas: Helium, 7.0 mL minute-1;
Detector: flame-ionization detector (FID), temperature of 300oC.
Molecular Characterization of the Soil Microbiota, Inoculum and Slurry During Bioremediation
(dNTPs), 1.5 mM MgCl2, 5 µL of 10X reaction buffer and 2 U of Taq polymerase (Invitrogen). The amplification program consisted of an initial denaturation at 94°C for 5 minutes and 10 cycles touchdown of denaturation at 94°C for 1 minute, annealing at 58°C (with decrease of 0.5°C per cycle) for 30 seconds and extension at 72°C for 2 minutes, followed by 25 cycles of 94°C for 1 minute, 53°C for 30 seconds, 72°C for 2 minutes and final extension at 72°C for 2 minutes. The quality of the amplification product was verified in 1.2% agarose gel stained with ethidium bromide (0.5 mg mL-1). The PCR products of the total community were analyzed by denaturing gradient gel electrophoresis (DGGE) using the Bio-RadCodeTM Universal Mutation Detection System (Bio-Rad) and the procedure performed according to the manufacturer's manual. Samples of PCR (180 to 300 ng of amplified DNA) added to 10 µL of 2X sample buffer were applied directly on a 6% polyacrylamide gel, with a denaturant gradient of urea-formamide of 35-65% and submitted to electrophoresis at 60°C for 14 hours at 50 Volts. Then the gel was stained with SYBR Green I (Molecular Probes) for 2 hours in the dark, observed under ultraviolet light and photo documented, using EpiChemi 3 Darkroom (UVP, Biolmaging System). The similarity dendrogram was obtained with the software GelCompar version 4.2 (Applied Maths, Kortrijk, Belgium) and the Pearson correlation coefficient.
Bioremediation Test
The bioremediation test was conducted in accordance with the best results obtained in early studies developed on a bench scale (Ferreira and Morita, 2010) and the biodegradation of pollutants present in real contaminated soil occurred by indigenous and acclimated microorganisms from the sludge of the wastewater treatment plant of the plasticizers industry.
The soil was prepared by manual homogenization and introduced into the reactor at the original pH and moisture content. A hundred kilograms of soil, 25 liters of sludge (11 gVSS kg-1 dry soil) and 100 mL of a solution of 50 g KH2PO4 L-1 were introduced into a 400 liter reactor and, after one hour homogenization, samples were collected for initial slurry analysis. The bioremediation was carried out during 120 days. The concentrations of plasticizers and alcohols, pH, moisture content and temperature
were monitored by collection of fortnightly samples. Samples were also collected monthly for the identification of the dynamics of the microbial populations. The pH and temperatures were not corrected during bioremediation, only humidity was corrected. The addition of water occurred weekly to maintain the soil moisture content at 40%.
RESULTS AND DISCUSSION
Characterization of Soil and Sludge Samples
The soil was classified as medium clay: sand (13±1%); fine sand (55±2%); silt (7±1%) and clay (25±1%), and as an acid medium: pH(H2O) 5.7 ± 0.1, pH(KCl) 5.3 and pH(CaCl2) 5.4 (EMBRAPA, 1999). The ion exchange capacity was 35 ± 1 mmol kg-1 and the potential acidity was 9 mmol kg-1. The content of Total Organic Carbon, 1.01 ± 0.03%, is within the usual range reported by Fassbender (1975) for Brazilian soils. Total Kjeldahl Nitrogen was 279±5 mg kg-1 and Total Phosphorus was 1±1 mg kg-1. Considering the carbon:nitrogen and carbon:phosphorus ratios recommended by Leeson and Hinchee (1995) for the biodegradation of organic compounds in soil, the first was less than 60:1 and it was not necessary to add this nutrient, but the carbon:phosphorus ratio was higher than 300:1, requiring the introduction of phosphorus to maintain the microorganisms’ metabolism and the biodegradation of contaminants in these conditions. The soil moisture content was 23 ± 1% and the water capacity 26 ± 1%.
The sludge used as inoculum had a pH of 6.27 ± 0.01, temperature of 26.4ºC, density of 1.0113 ± 0.0033 g cm-3, total suspended solids of 35,819 ± 1,325 mg L-1, volatile suspended solids of 33,749 ± 998 mg L-1, TOC of 2.46 ± 0.13%, Total phosphorus of 301 ± 7 mg L-1 and Total Kjeldahl Nitrogen of 1,583 ± 36 mg L-1.
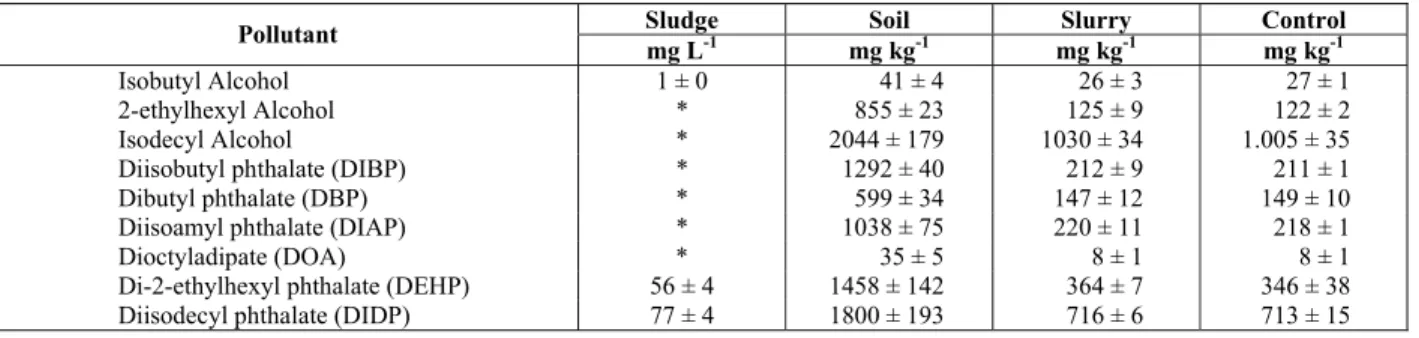
Table 1: Initial Concentrations of Pollutants in Sludge, Soil and Slurry in the Reactor and Control
Sludge Soil Slurry Control
Pollutant
mg L-1 mg kg-1 mg kg-1 mg kg-1
Isobutyl Alcohol 1 ± 0 41 ± 4 26 ± 3 27 ± 1
2-ethylhexyl Alcohol * 855 ± 23 125 ± 9 122 ± 2
Isodecyl Alcohol * 2044 ± 179 1030 ± 34 1.005 ± 35
Diisobutyl phthalate (DIBP) * 1292 ± 40 212 ± 9 211 ± 1
Dibutyl phthalate (DBP) * 599 ± 34 147 ± 12 149 ± 10
Diisoamyl phthalate (DIAP) * 1038 ± 75 220 ± 11 218 ± 1
Dioctyladipate (DOA) * 35 ± 5 8 ± 1 8 ± 1
Di-2-ethylhexyl phthalate (DEHP) 56 ± 4 1458 ± 142 364 ± 7 346 ± 38 Diisodecyl phthalate (DIDP) 77 ± 4 1800 ± 193 716 ± 6 713 ± 15
*not detected – detection limit: 100 μg L-1
Control: Open Flask, after 120 days. From Ferreira and Morita (2010). Uncertainties represent ± 1 Standard Deviation of the average of triplicates
Monitoring the Bioremediation Test
Slurry Moisture Content During Bioremediation
Slurry moisture content during biodegradation ranged from 28.49 ± 0.04% to 36.93 ± 0.14% and the lowest values were obtained after 15 days. During bioremediation, water was added weekly to the slurry-phase bioreactor to reach 40%, but the effective moisture content achieved a value above 36% only at 95 days. The constant addition of water and a pH of 6.0 potentially favored acidic hydrolysis of esters, as described by Gang et al. (2008).
Variation of Slurry pH During Bioremediation
The variation of slurry pH during biodegradation was not significant: the highest value (6.9) was
observed 60 days after the experiment had started (initial pH = 6.0 ± 0.1) and a decline of the pH to approximately 6.2 was observed at the 90th day (Figure 1). Different authors (Juneson et al., 2001;Chang et al., 2007) observed a trend for the pH to decline during phthalate biodegradation in synthetically contaminated soil and they attributed this decline to phthalic acid produced by the primary biodegradation. In this Brazilian contaminated soil there were five phthalates, adipates and alcohols and differences between the primary and ultimate biodegradation times for each compound (hydrolysis and acid formation) could explain, together with soil buffering capacity and the consortia of microorganisms, the trend of pH maintenance. The initial soil pH, although not ideal (6.75-7.25) for bioremediation of soils by slurry bioreactors, according to Robles-González et al. (2008), was not a restriction for pollutant biodegradation.
5.00 5.25 5.50 5.75 6.00 6.25 6.50 6.75 7.00 7.25 7.50 7.75 8.00 8.25 8.50 8.75 9.00
0 15 30 45 60 75 90 105 120
days
pH
0.0 2.0 4.0 6.0 8.0 10.0 12.0 14.0 16.0 18.0 20.0 22.0 24.0 26.0 28.0 30.0
T
emp
era
tu
re
ºC
pH Minimum pH Maximum Temperature
Variation of Slurry Temperature During Bioremediation
The variation of slurry temperature during biodegradation is shown in Figure 1. The slurry temperature ranged from 14 to 26ºC during the bioremediation period and was 1 to 5ºC below the ambient temperature. The lowest values were obtained at the beginning and at 45 and 60 days and a decrease in DBP, DIBP, isodecyl alcohol and DIDP removal was observed in this period. These temperature conditions, considered not to be ideal for phthalate biodegradation by slurry bioreactors (Chang et al., 2004; 2007; Kim et al., 2008; Robles-González et al., 2008), were not restrictive for soil bioremediation.
Concentrations of Alcohols and Plasticizers During Bioremediation
The initial concentrations of alcohols and plasticizers in the reactor are shown in Table 1. The original soil had higher concentrations of pollutants than those found in the slurry, confirming the possible acid catalyzed plasticizers hydrolysis after initial addition of water and sludge, a result corroborated by Ferreira and Morita (2010).
The concentrations of alcohols and plasticizers during bioremediation in the reactor are shown in Figure 2. In the bioremediation test, a lag phase was
observed for isobutanol, DBP and DOA. Isobutyl alcohol showed the same initial concentration during 60 days after the start of bioremediation, demonstrating that it became bioavailable after phthalate removal in the plasticized soil. The decrease of this short alkyl chain alcohol content could not be totally attributed to volatilization, as demonstrated by Ferreira and Morita (2010). Concerning the long alkyl chain alcohols, 2-ethyl hexanol was identified at the beginning of the experiment and after 30 days in concentrations of 14 mg kg-1 dry soil and was not detected after this period. The most persistent alcohol was isodecanol. The phthalate DBP showed the same initial concentration during 15 days and DOA during 30 days after bioremediation started. These compounds showed lower contents in soil when compared to others plasticizers (less produced plasticizers due to the market share) and were not present in wastewater when the sludge was collected, which could explain the lag phase, considering the change in the dominant populations initially present after 30 days of biodegradation, as demonstrated by DGGE analysis.
After 120 days of bioremediation, the alcohols isobutanol and isodecanol, with 92% and 87% removal efficiencies respectively, and all the phthalates, with removal efficiencies of 69% for DIBP, 83% for DBP, 61% for DIAP, 62% for DEHP and 80% for DIDP remained in the soil. DOA was not detected after 90 days.
ISOBUTANOL 0.00 0.10 0.20 0.30 0.40 0.50 0.60
0 15 30 45 60 75 90 105 120
days mmo l k g -1 dr y s o il ISODECANOL 0.00 1.00 2.00 3.00 4.00 5.00 6.00 7.00 8.00 9.00 10.00
0 15 30 45 60 75 90 105 120
days mm o l k g -1 dr y s o il DIBP 0.00 0.10 0.20 0.30 0.40 0.50 0.60 0.70 0.80 0.90 1.00
0 15 30 45 60 75 90 105 120 days
mmo
l k
g
-1 dr
y s o il DBP 0.00 0.10 0.20 0.30 0.40 0.50 0.60 0.70 0.80 0.90 1.00
DIAP
0.00 0.10 0.20 0.30 0.40 0.50 0.60 0.70 0.80 0.90 1.00
0 15 30 45 60 75 90 105 120
days
mmo
l k
g
-1 dr
y
so
il
DEHP
0.00 0.10 0.20 0.30 0.40 0.50 0.60 0.70 0.80 0.90 1.00
0 15 30 45 60 75 90 105 120
days
mm
o
l k
g
-1 dry s
oi
l
DIDP
0.00 0.25 0.50 0.75 1.00 1.25 1.50 1.75 2.00
0 15 30 45 60 75 90 105 120 days
mmo
l k
g
-1
dry s
oi
l
DOA
0.000 0.010 0.020 0.030 0.040 0.050
0 15 30 45 60 75 90 105 120 days
mmo
l k
g
-1 dry
so
il
Figure 2: Concentration of alcohols, phthalates and adipate during 120 days of bioremediation
Kinetics of the Pollutant Degradation
The biodegradation of alcohols and plasticizers followed first-order kinetics and correlation coefficients were above 0.89 (Table 2). A reduction in the phthalate biodegradation rate was not observed with the increase of the alkyl chain, a result not corroborated by Chang et al. (2007), and the presence of highly biodegradable co-substrates did not prevent the plasticizer biodegradation. Among the plasticizers, dioctyl adipate showed the highest rate of biodegradation.
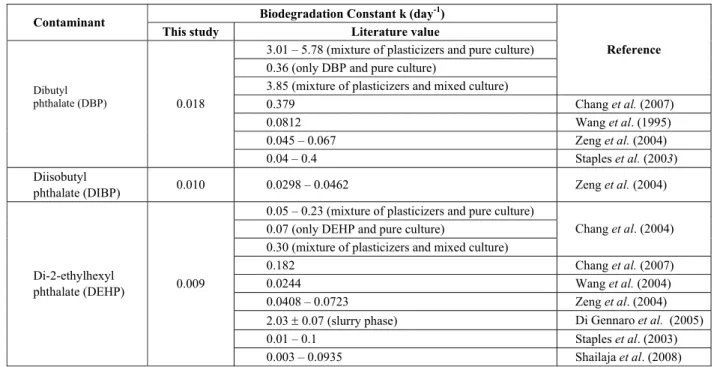
In this study, biodegradation constants of DBP, DIBP and DEHP were below the values reported by different authors, whose studies involving
biodegradation of plasticizers in soils were performed on a laboratory scale, at an ideal temperature and pH, in temperate climate zones with synthetically contaminated soils and with only phthalates (Table 3). The Total Organic Carbon content of the soil was low (1.01±0.03%) and a higher bioavailability of phthalatescould be expected (Semple et al., 2003), but lower pH and temperature values of the slurry and the presence of co-substrates could explain the lower plasticizer biodegradation constants, although these parameters were not restrictive to soil bioremediation. The possible presence of specific microorganisms, considering the changes in the dominant population shown by DDGE analysis, could also affect the biodegradation rates.
Table 2: Kinetic equation, rate constants and correlation coefficients
Slurry Phase Reactor Compounds
Kinetic equation k r2
Isobutanol y = 6,397 exp(-0.048x) 0.048 0.89
Isodecanol y = 6.510 exp(-0.018x) 0.018 0.96
DIBP y = 0.760 exp(-0.010x) 0.010 0.96
DBP y = 0.870 exp(-0.018x) 0.018 0.92
DIAP y = 0.700 exp(-0.008x) 0.008 0.91
DEHP y = 0.930 exp(-0.009x) 0.009 0.89
DIDP y = 1.590 exp(-0.015x) 0.015 0.95
DOA y = 0.058 exp(-0.023x) 0.023 0.95
y: contaminant (mmol kg-1
); x: days; k: rate constant(day -1
); r2
Table 3: Biodegradation constants obtained in this study and by different authors
Biodegradation Constant k (day-1) Contaminant
This study Literature value
3.01 – 5.78 (mixture of plasticizers and pure culture) 0.36 (only DBP and pure culture)
3.85 (mixture of plasticizers and mixed culture)
Reference
0.379 Chang et al. (2007)
0.0812 Wang et al. (1995)
0.045 – 0.067 Zeng et al. (2004)
Dibutyl
phthalate (DBP) 0.018
0.04 – 0.4 Staples et al. (2003)
Diisobutyl
phthalate (DIBP) 0.010 0.0298 – 0.0462 Zeng et al. (2004)
0.05 – 0.23 (mixture of plasticizers and pure culture) 0.07 (only DEHP and pure culture)
0.30 (mixture of plasticizers and mixed culture)
Chang et al. (2004)
0.182 Chang et al. (2007)
0.0244 Wang et al. (2004)
0.0408 – 0.0723 Zeng et al. (2004)
2.03 ± 0.07 (slurry phase) Di Gennaro et al. (2005)
0.01 – 0.1 Staples et al. (2003)
Di-2-ethylhexyl
phthalate (DEHP) 0.009
0.003 – 0.0935 Shailaja et al. (2008)
Considering only DEHP, 395 days of treatment would be required to attain the value of 10.0 mg kg-1 dry soil recommended by the São Paulo State Environmental Protection Agency for industrial use (CETESB, 2005).
Fingerprint Analysis of the Microbial Community Present in the Slurry During Bioremediation
The fingerprint analysis of the total community of microorganisms in the slurry during the bioremediation test revealed a significant change in the dominant populations initially present (Figure 3a). Their similarity dendrogram based on the Pearson correlation coefficient (Figure 3b) showed profiles of these bands with less than 70% similarity with respect to the population found after 30 and 60 days and less than 40% similarity with respect to those observed after 100 days. The dominant populations present in the reactor up to 60 days of biodegradation removed 44% of DIAP and 51% of DEHP, the most persistent phthalates. After 100 days, when there is a greater differentiation of populations, the soil pollutant removal efficiencies were above 61%. The profile obtained from the bands suggests that, after 100 days, the community is actually composed of several dominant populations from the soil, with 60% similarity to the indigenous microorganism bands and some dominant population from the inoculum, with 20% similarity to the
acclimated microorganism bands. Despite the low similarity with respect to the dominant population bands of the inoculum, early studies developed by Ferreira and Morita (2010) showed no removal efficiency of soil pollutants without the addition of acclimated microorganisms to a plasticizer biodegrading reactor at the initial time. Chatterjee and Dutta (2003), Gu et al. (2005) and Li et al. (2005) have demonstrated that the complete degradation of phthalates is always performed syntrophically by several types of microorganisms. In a DGGE gel, the number, precise position, and intensity of the bands in a gel track give an estimate of the number and relative abundance of the numerically dominant ribotypes in the sample. Boon
Sludge Soil Start up 30d 60d 100d
Sludge Soil Start up 30d 60d 100d
Sludge Soil Start up 30d 60d 100d
Sludge Soil Start up 30d 60d 100d
Figure 3a: Fingerprint of bacteria present in the sludge, soil and reactor during bioremediation in replicates (arrows indicate the example of initial sludge and soil bands that appear at the end of the test).
Figure 3b: DGGE Analysis Similarity Dendrogram - Sludge 1: sludge 1st replicate; Sludge2: sludge 2nd replicate; Soil 1: soil 1st replicate; Soil 2: soil 2nd replicate; Start up 1: initial slurry 1st replicate; Start up 2: initial slurry 2nd replicate; 30d1: slurry 30 days 1st replicate; 30d2: slurry 30 days 2nd replicate; 60d1: slurry 60 days 1st replicate; 60d2: slurry 60 days 2nd replicate; 100d1: slurry 100 days 1st replicate 100d2: slurry 100 days 2nd replicate.
CONCLUSIONS
In this study, a bioremediation experiment was conducted with a Brazilian soil from a site contaminated with plasticizer wastes (phthalates, adipate and alcohols):
During bioremediation, the slurry pH (5.9-6.9) and temperature values (14-26ºC) were not controlled and were lower than those considered to be ideal for phthalate degradation by slurry bioreactors; however, these conditions were not restrictive for bioremediation of a real contaminated soil;
The addition of water and a pH of 6.0 potentially favored acid hydrolysis of esters during bioremediation;
The biodegradation of plasticizers followed first-order kinetics. A reduction in the biodegradation rate was not observed with the increase of the alkyl chain and the presence of highly biodegradable co-substrates did not prevent the plasticizer biodegradation: the most persistent phthalates were DIAP and DEHP and only adipate was totally removed;
with 20% similarity to the acclimated microorganism, suggesting that the consortia of microorganisms was essential to biodegradation;
After 120 days of bioremediation experiment, remained in the soil: 2 mg kg-1 of isobutanol, 137 ± 5 mg kg-1 of isodecanol, 65 ± 2 mg kg-1 of DIBP, 25 ± 4 mg kg-1 of DBP, 85 ± 1 mg kg-1 of DIAP, 140 ± 5 mg kg-1 of DEHP, and 141 ± 3 mg kg-1 of DIDP. However, only DEHP has the value of 10.0 mg kg-1 dry soil recommended by the São Paulo State Environmental Protection Agency for industrial use and 395 days of bioremediation treatment would be necessary to achieve this goal.
ACKNOWLEDGMENT
This work was supported by FAPESP (The State of São Paulo Research Foundation) - Project Number - 06/50487- 0.
REFERENCES
Boon, N., De Windt, W., Verstraete, W., M. E., Evaluation of nested PCR^DGGE (denaturing gradient gel electrophoresis) with group-specic 16S rRNA primers for the analysis of bacterial communities from different wastewater treatment plants. FEMS Microbiol. Eco., 39, 101 (2002). Brosius, J., Dull, T. L., Sleeter, D. D., Noller, H. F.,
Gene organization and primary structure of a ribosomal RNA operon from Escherichiacoli. J. Mol. Biol., 148, 107 (1981).
Brown, D., Thompson, R. S., Stewart, K. M., Croudace, C., Gillings, E., The Effect of phthalate ester plasticizers on the emergence of midge
(Chironomus riparius) from treated sediments.
Chemosphere, 32, 11, 2177 (1996).
Cartwright, C. D., Owe, S. A., Thompson, I. P., Burns, R. G., Biodegradation of diethyl phthalate in soil by a novel pathway. FEMS, Microbiol. Lett., 186, 23 (2000).
Chang, B. V., Wang, T. W., Yuan, S. Y., Biodegradation of four phthalates esters in sludge. Chemosphere, 69, 1116 (2007).
Chang, B. V., Yang, C. M., Cheng, C. H., Yuan, S. Y., Biodegradation of phthalates ester by two bacteria strains. Chemosphere, 55, 533 (2004). Chatterjee, S., Dutta, T. K., Metabolism of butyl benzyl
phthalate by Gordonia sp. strain MTCC 4818. Biochem. Biophys. Res. Commun., 309, 36 (2003). Chen, J., Li, X., Li, J., Cao, J., Qiu, Z., Zao, Q., Xu,
C., Shu, W., Degradation of environmental
endocrine disruptor di-2-ethylhexyl phthalate by a newly discovered bacterium, Microbacterium sp.
Strain CQ0110Y. Appl. Microbiol. Biotechnol.
74, 676 (2007).
Companhia de Tecnologia de Saneamento Ambiental, (CETESB), Decisão de Diretoria no 195-2005-E. Dispõe sobre a aprovação dos Valores Orientadores para Solos e Águas Subterrâneas no Estado de São Paulo em substituição aos Valores Orientadores de 2001, e dá outras providências. (2005). [Online]. Web site. http://www.cetesb.sp.gov.br/Solo/ relatorios/ tabela_valores_2005.pdf (Accessed in April 14, 2009).
Companhia de Tecnologia de Saneamento Ambiental, (CETESB), Determinação da biodegradação de resíduos - Método Respirométrico de Bartha. Norma L6 350. CETESB, São Paulo (1990).
Davis, C., Cort, T., Dai, D., Illangasekare, T. H., Munakata-Marr, J., Effects of heterogeneity and experimental scale on the biodegradation of diesel, Biodegradation, 14, 373 (2003).
Di Gennaro, P., Collina, E., Franzetti, A., Lasagni, M., Luridiana, A., Pitea, D., Bestetti, G., Bioremediation of diethylhexyl phthalate contaminated soil: a feasibility study in slurry-and solid-phase reactors. Environ. Sci. Technol., 39, 325 (2005).
Eaton, A. D., Clesceri, L. S., Rice, E. W., Greenberg, A. E., Franson, M. A. H., Standard methods for the examination of water and wastewater. Eds. APHA-WEF, Washington, DC (2005).
Empresa Brasileira de Pesquisa Agropecuária, EMBRAPA, Centro Nacional de Pesquisa de Solos. Sistema brasileiro de classificação de solos. Rio de Janeiro, p. 412 (1999).
Fassbender, H. W., Química de suelos con énfasis en suelos de América Latina. Instituto Interamericano de Ciencias Agrícolas de la OEA, Turrialba (1975). Fernandez, M. P., Ikonomou, M. G., Buchanan, I., An
assessment of estrogenic organic contaminants in Canadian wastewaters. Sci. Total Environ. 373, 250 (2007).
Ferreira, I. D., Morita, D. M., Biodegradação de alcoóis, ftalatos e adipatos em um solo tropical contaminado. Quim. Nova, 33, 8, 1686 (2010). Fromme, H., Kücher, T., Otto, T., Pilz, K., Müller,
J., Wenzel, A., Occurrence of phthalates and bisphenol A and F in the environment. Water Res., 36, 1429 (2002).
Robles-González, I. V., Fava, F., Poggi-Varaldo, H. M., A review on slurry bioreactors for bioremediation of soils and sediments. Microbiall Cell Factories, 7, 5, 1 (2008)
Gu, J. D., Li, J., Wang, Y., Biochemical pathway and degradation of phthalate ester isomers by bacteria. Water Sci. Technol. 52, 241 (2005) Harris, C. A., Henttu, P., Parker, M. G., The
estrogenic activity of phthalate esters in vitro. Environ. Health Perspect., 105, 802 (1997). Juneson, C., Ward, O. P., Singh, A., Biodegradation
of bis(2-ethylhexyl)phthalate in a soil slurry-sequencing batch reactor. Process Biochem., 37, 305 (2001).
Kaewpipat, K., Grady, C. L. P., Microbial Population dynamics in laboratory-scale activated sludge reactors. Water Science and Technology, 46, 12, 19 (2002).
Kim, D., Um, H., Lim, E., Mim, J., Kim, Y., Degradation of diphenyl phthalate by Sphingomonas
chungbukensis. Biotechnol Lett, 30, 93 (2008).
Leeson, A., Hinchee, R., Bioventing Principles and Practice. Volume I: Bioventing Principles. EPA/540/R-95/534a, U. S. Environmental Protection Agency (USEPA), Washington, DC (1995). Li, J. X., Gu, J. D., Pan, L., Transformation of
dimethyl phthalate, dimethyl isophthalate and dimetyl terephthalate by Rhodococcus rubber Sa and modeling the processes using the modified Gompertz model. Int. Biodeter. Biodegr. 55, 223 (2005).
Liao, C-S., Chen, L-C., Chen, B-S., Lin, S-H., Bioremediation of endocrine disruptor di-n-butyl phthalate ester by Deinococcus radiodurans and
Pseudomonas stutzeri. Chemosphere, 78, 342 (2010)
Liebeg, E. W., Cutright, T. J., The investigation of enhanced bioremediation through the addition of macro and micronutrients in a PAH contaminated soil, Int. Biodeterior. Biodegradation, 14, 55 (1999).
Madsen, L., Thyme, J., Henriksen, K., Moldrup, P., Roslev, P. Kinetics of Di-(2-ethylhexyl) phthalate Mineralization in Sludge-amended Soil. Environ. Sci. Technol., 33, 2601 (1999).
Muyzer, G. & Smalla, K., Application of denaturing gradient gel electrophoresis (DGGE) and temperature gradient gel electrophoresis (TGGE) in microbial ecology. J. Gen. Mol. Microbiol., 73, 127 (1998).
Paganeto, G. O., Campi, F., Varani, K., Endocrine-disrupting agents on health human tissues. Pharmacol.Toxicol., 86, 24 (2000).
Petrovic, M., Barceló, D., Determination of anionic and non ionic surfactants, their degradation
products, and endocrine-disrupting compounds on sewage sludge by liquid chromatography/mass spectrometry. Anal. Chem., 72, 4560 (2000). Shailja, S., Mohan, S. V., Krishna, M. R., Sarma, P.
N., Degradation of di-ethylhexyl phthalate (DEHP) in bioslurry phase reactor and identification of metabolites by HPLC and MS. Int. Biodeter. Biodegr., 62, 143 (2008).
Silva, F. C. da, Manual de análise química de solos, plantas e fertilizantes, Org., EMBRAPA. Comunicação para Transferência de Tecnologia, Brasília (1999).
Staples, C. A., Parkerton, T. F., Peterson, D. R., A Risk assessment of selected phthalate esters in North American and Western European surface waters. Chemosphere, 40, 885 (2000).
Staples, C. A., Peterson, D. R., Degradation of phthalate esters in the environment. The Handb. Environ. Chem., 3, 85 (2003).
Staples, C. A., Peterson, D. R., Parkerton, T. F., Adams, W. J., The environmental fate of phthalate esters: a literature review. Chemosphere, 35, 4, 667 (1997). Swan, S. H., Environmental phthalate exposure in
relation to reproductive outcomes and other health endpoints in humans. Environ. Res., 108, 177 (2008).
United States Environmental Protection Agency (USEPA), Test methods for evaluating solid waste, physical/chemical methods-SW-846. (1996) [Online]. Web site. http://www.epa.gov/ waste/hazard/testmethods/sw846/online/index.htm (Accessed in May 20, 2008).
Van Raij, B., Andrade, J. C., Cantarella, H., Quaggio, J. A., Análise Química para Avaliação da Fertilidade de Solos Tropicais. Eds. IAC, Campinas (2001).
Vega, D., Bastide, J., Dimethylphthalate hydrolysis by specific microbial esterase. Chemosphere, 51, 663 (2003).
Wang, J., Liu, P., Qian, Y., Microbial degradation of di-n-butylphthalate. Chemosphere, 31, 9, 4051 (1995). Wang, J., W., Zhao, X., Wu, W., Biodegradation of
Phthalic Acid Ester (PAE’s) in soil bioaugmented with acclimated activated sludge. Process Biochem., 39, 1837 (2004).
Zeng, F., Cui, K., Li, X., Fu, J., Sheng, G., Biodegradation kinetics of phthalate ester by
Pseudomonas fluoresences FS1. Process Biochem.,
39, 1125 (2004).