ISSN 0104-6632 Printed in Brazil
www.abeq.org.br/bjche
Vol. 29, No. 01, pp. 135 - 146, January - March, 2012
*To whom correspondence should be addressed
Brazilian Journal
of Chemical
Engineering
MODELING OF A THREE-PHASE REACTOR FOR
BITUMEN-DERIVED GAS OIL HYDROTREATING
R. Chacón
1*, A. Canale
1, A. Bouza
1and Y. Sánchez
21
Departamento de Termodinámica y Fenómenos de Transporte, Universidad Simón Bolívar, Caracas Venezuela.
E-mail: ronaldchj1@gmail.com
2
Departamento de Procesos y Sistemas, Universidad Simón Bolívar, Sartenejas 1081, Venezuela.
(Submitted: December 20, 2010 ; Revised: October 4, 2011 ; Accepted: October 5, 2011)
Abstract - A three-phase reactor model for describing the hydrotreating reactions of bitumen-derived gas oil
was developed. The model incorporates the mass-transfer resistance at the gas-liquid and liquid-solid interfaces and a kinetic rate expression based on a Langmuir-Hinshelwood-type model. We derived three correlations for determining the solubility of hydrogen (H2), hydrogen sulfide (H2S) and ammonia (NH3) in
hydrocarbon mixtures and the calculation of the catalyst effectiveness factor was included. Experimental data taken from the literature were used to determine the kinetic parameters (stoichiometric coefficients, reaction orders, reaction rate and adsorption constants for hydrodesulfuration (HDS) and hydrodenitrogenation (HDN)) and to validate the model under various operating conditions. Finally, we studied the effect of operating conditions such as pressure, temperature, LHSV, H2/feed ratio and the inhibiting effect of H2S on
HDS and NH3 on HDN.
Keywords: Hydrotreating; Hydrodesulfurization; Hydrodenitrogenation; Reactor modeling.
INTRODUCTION
Hydrotreating (HDT) is a catalytic conversion process where the content of some crude oil contaminants such as sulfur, nitrogen, oxygen and heavy metals is reduced using hydrogen over a catalyst of NiMo or CoMo supported on Al2O3. It also causes the conversion of some heavy molecules into lighter ones. HDT includes reactions of: hydrodesulfuration (HDS), hydrodenitrogenation (HDN), hydrodeoxygenation (HDO), hydrodemetallization (HDM), hydrodearomatization (HDA) and others such as olefin saturation, decyclization, etc. This is one of the most important processes in crude oil refining, because it allows reducing the emission of SOx and NOx, which are synthesized by fuel combustion. These emissions are strong environmental contaminants; in addition, they can inhibit the performance of the catalysts used in
refining processes, as well as the catalysts used in catalytic converters of vehicles. (Harding et al., 2001).
In order to maximize the sulfur and nitrogen conversion it is necessary to study the optimal operating conditions used in HDT, such as pressure, temperature, liquid hourly space velocity (LHSV) and H2/feed ratio. It is also very important to select the most appropriate catalyst (such as NiMo/Al2O3 or CoMo/Al2O3), reactor configuration (simple or series), reactor type (fixed bed, slurry or ebullated bed). These operating conditions vary according to the feed type to be hydrotreated; the severity degree can vary depending on the sulfur and nitrogen content and the molecular weight of the feed. (Yang et al., 2004).
between the liquid-gas interface and solid-liquid interface in order to adjust the reaction order. Botchwey et al. (2006) considered the resistance to mass transfer only in the liquid-gas interface and also included the heat transfer in their model (non-isothermal reactor). Other authors have performed a dynamic (non-steady state) evaluation of trickle-bed reactors (Sales et al, 2005). Hofmann (1977) developed the mass balance equations for a non-isothermal reactor considering the resistance to mass transfer in the gas and liquid-solid interfaces. Korsten and Hoffmann (1996) adapted the proposed model of Hofmann (1977) to a kinetic rate expression based on a Langmuir-Hinshelwood-type model in HDS. López and Dassori (2001) extended the previous work to HDS and HDN. Korsten and Hoffmann (1996), López and Dassori (2001) and Rodríguez and Ancheyta (2004) expressed the resistance to mass transfer in the liquid-solid interface through a catalyst effectiveness factor, equal to one; these authors also expressed the liquid-gas mass transfer through Henry’s law for the gas-liquid equilibrium. This equilibrium is expressed as a function of H2, H2S and NH3 gas solubility in bitumen. They used various correlations to calculate the gas solubilities, but they assumed that the H2S and NH3 solubilities were equal and used the same expression to calculate them.
The aim of this work was to develop and validate a three-phase reactor model for describing HDT reactions, which incorporates the mass-transfer resistance at the gas-liquid and liquid-solid interfaces. It is also an objective to develop correlations for predicting the gas solubility of H2, H2S and NH3 in hydrocarbon mixtures and including the calculation of the catalyst effectiveness factor. The reactor model was proposed by Hofmann (1997), with the assumptions, kinetic expressions and properties estimation made by Korsten and Hoffmann (1996), López and Dassori (2001) and Yang et al. (2004). The experimental data was taken from the work of Botchwey et al. (2003) for a pilot reactor, packed bed and concurrent descending flow.
Based on the previous works, a reactor model was defined that considers the following assumptions:
1. The resistance to mass transfer in the liquid-gas interface was expressed through the liquid-gas-liquid equilibrium calculation based on Henry’s law, described as a function of the gas solubilities involved in the reaction (Korsten and Hoffmann, 1996). Correlations to predict each gas solubility (H2, H2S and NH3) in hydrocarbon mixtures were developed using experimental data taken from Cai et al. (2001), Yokoyama et al. (1993) and Yokoyama et al. (1990 and 1991), respectively.
2. The resistance to mass transfer in the liquid-solid interface was expressed through the catalyst effectiveness factor; this factor was calculated using the equations and catalyst properties presented by Yang et al. (2004).
3. Concentration profiles on the radial axis were not considered and the reactor was considered isothermal, due to the small reactor dimensions (inner diameter of 10 mm and a total length of 285 mm).
EXPERIMENTAL DATA
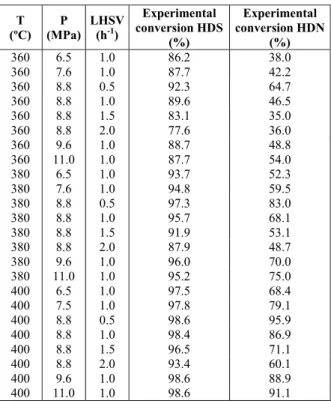
In order to calculate the parameters associated with the mass balance equations in the reactor (Table 5 and 6), available experimental data were taken from Bochtwey et al. (2003). They used a typical commercial catalyst for HDT (NiMo/Al2O3), but did not list the properties of the catalyst. Since these properties are necessary in order to calculate the catalyst effectiveness factor, we employed the properties of the catalyst reported by Yang et al. (2004), because they also used a typical commercial catalyst for HDT (NiMo/Al2O3) and we assumed that these properties are very similar to those of the catalyst used by Bochtwey et al. (2003). Table 3 lists the operating conditions and the experimental conversions obtained by Botchwey et al. (2003) and these data were used to estimate the kinetic parameters and validate the model.
Table 1: Feed, reactor and gas properties. (Botchwey
et al., 2003).
Parameter Value
Gas oil molecular weight (g/mol) 319.38
Internal diameter of reactor (cm) 1
Reactor length (cm) 28.5
Catalytic bed length (cm) (Botchwey et al, 2004) 12.0
Catalytic bed density (bulk density) (g/cm3) 0.53
Catalyst weight (g) 5
Sulfur content (%) 4
Nitrogen content (%) 0.33
Gas oil density at 15,6 ºC (g/cm3) 0.99
Mean average boiling point of feed (ºC) 407
H2 critical volume (L/mol) 66.9
H2S critical volume (L/mol) 97.9
NH3 critical volume (L/mol) 75.7
Hydrogen/feed ratio at standard conditions (mL/mL) 600
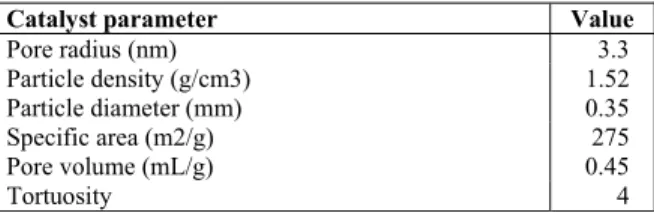
Table 2: Properties of the catalyst (Yang et al., 2004)
Catalyst parameter Value
Pore radius (nm) 3.3
Particle density (g/cm3) 1.52
Particle diameter (mm) 0.35
Specific area (m2/g) 275
Pore volume (mL/g) 0.45
Brazilian Journal of Chemical Engineering Vol. 29, No. 01, pp. 135 - 146, January - March, 2012 Table 3: Experimental conversion for HDS and
HDN under various operating conditions (Botchwey
et al., 2003).
T (ºC)
P (MPa)
LHSV (h-1)
Experimental conversion HDS
(%)
Experimental conversion HDN
(%)
360 6.5 1.0 86.2 38.0
360 7.6 1.0 87.7 42.2
360 8.8 0.5 92.3 64.7
360 8.8 1.0 89.6 46.5
360 8.8 1.5 83.1 35.0
360 8.8 2.0 77.6 36.0
360 9.6 1.0 88.7 48.8
360 11.0 1.0 87.7 54.0
380 6.5 1.0 93.7 52.3
380 7.6 1.0 94.8 59.5
380 8.8 0.5 97.3 83.0
380 8.8 1.0 95.7 68.1
380 8.8 1.5 91.9 53.1
380 8.8 2.0 87.9 48.7
380 9.6 1.0 96.0 70.0
380 11.0 1.0 95.2 75.0
400 6.5 1.0 97.5 68.4
400 7.5 1.0 97.8 79.1
400 8.8 0.5 98.6 95.9
400 8.8 1.0 98.4 86.9
400 8.8 1.5 96.5 71.1
400 8.8 2.0 93.4 60.1
400 9.6 1.0 98.6 88.9
400 11.0 1.0 98.6 91.1
Chemical Reactions and Kinetic Model
Commonly, the sulfur content in any feed varies between 1% to 5% in weight. The sulfur may be found in the form of mercaptans, sulfides, disulfides and thiophene, etc. The nitrogen compounds can be found in the form of pyridine, quinolines, isoquinolines, acridines, pyrrole, indole, carbazole and their content in oil varies between 0.01% to 3%. (Poels and Brands, 2002).
The reactions studied in this work were only HDS and HDN, because the contents of sulfur and nitrogen in the bitumen-derived gas oil studied by Bochtwey et al. (2003) were more significant than the contents of oxygen and heavy metals.
Due to the presence of a large number of sulfur and nitrogen compounds, it is almost impossible to determine the exact compositions of those species in the gas oil. Therefore, we treated these as pseudo-component reactions, one for the species involved in HDS (Korsten and Hoffmann, 1996) and another for the species involved in HDN (López and Dassori, 2001). The stoichiometric coefficients are set as
1=1, 2=2, 3=1, 4=1, 5=1, 6=3, 7=1, 8=1.
1 2 2
3 2 4 2
R-S (liq) H (gas)
R-H (liq) H S (gas)
+ →
+ (1)
5 6 2
7 3 8 3
R' -N (liq) H (gas)
R' -H (liq) NH (gas)
+ →
+ (2)
Korsten and Hoffmann (1996) proposed a kinetic model for HDS based on a Langmuir-Hinshelwood-type model (Girgis and Gates, 1991), where each reactant of the bimolecular reaction has the same probability to be absorbed on the catalyst. López and Dassori (2001) extended the study to HDT including HDS and HDN reactions. The reaction order and the kinetic rate constant are adjustable according to the feed.
( ) ( )
(
)
a b
2
2 2
m m
S H
HDS HDS 2
H S H S
C C
r k
1 K C
=
+ (3)
( ) ( )
(
)
c d
2
3 3
m m
N H
HDN HDN 2
NH NH
C C
r k
1 K C
=
+ (4)
The adsorption constants and the kinetic rate constants are based on the Arrhenius equation:
m
Ea RT
m m
k B e
−
= (5)
adsi
q RT i i
K =F e (6)
Reactor Model
Some small scale reactors for HDT commonly present a packed bed configuration (a fixed catalyst load inside the reactor), where the reactants are fed to the reactor top in concurrent down flow, obtaining high efficiencies and conversion of the feed (Gary and Handwerk, 1994). Typically, these small scale reactors are operated isothermally. However, bigger reactors are not isothermal because of the temperature profiles along the reactor in the radial and axial directions (Yui and Adjaye, 2004). The models proposed in the literature do not consider the existence of concentration profiles in the radial direction because the experimental tests used to validate these models are carried out in small scale reactors (small diameter), so we only took into consideration the concentration profile in the axial direction (Korsten and Hoffmann, 1996).
López and Dassori (2001) and Rodriguez and Ancheyta (2003). This model considers the mass transfer resistance in the liquid-gas and liquid-solid interfaces, with heterogeneous chemical reaction and without considering heat transfer. The model has the following assumptions:
1. The gas and liquid linear velocities are constants along the reactor.
2. There is no concentration profile in the radial direction.
3. The catalyst activity is constant throughout time.
4. There is no vaporization of the reactants or products inside the reactor.
5. The reactor operates in the steady-state. 6. The reactor is isothermal and isobaric, due to its small dimensions.
7. The chemical reaction takes place on the catalytic surface, not in the gas phase or liquid phase.
8. The resistance to mass transfer in the gaseous film is neglected, because the hydrocarbon is in the liquid phase.
9. The internal mass transfer inside the catalyst particle (internal diffusion) is described through the catalyst effectiveness factor, which varies with the conversion along the reactor.
10. The thermodynamic equilibrium is described through Henry’s Law.
11.The chemical reaction rate is described through a kinetic rate expression based on a Langmuir-Hinshelwood-type model.
12. Hydrogen sulfide only has an inhibitor effect on HDS and ammonia only on HDN.
The general mass balance equations for the gas and liquid phase are the following:
Gas phase:
( )
LG i i
i i
LG i
U dP P
k a C 0
RT dz H
⎛ ⎞
+ ⎜ − ⎟=
⎝ ⎠ (7)
Liquid phase:
( )
( ) (
)
L
i i L
L i i
LG i
L S
i i i
LS
dC P
U k a C
dz H
k a C C 0
⎛ ⎞
− ⎜ − ⎟+
⎝ ⎠
− =
(8)
Since the concentration of hydrocarbons is not changed significantly by HDS (Korsten and Hoffmann, 1996) and HDN (Lopez and Dassori,
2001), the mass balance equation for hydrocarbon will not be taken into consideration further.
The driving force in the liquid-solid interface can be described through a catalyst effectiveness factor and a chemical reaction rate.
( ) (
L S)
i i i i i bed m m
LS
k a C −C = − r= − ρ r (9)
The mass balance equations for each component are now presented:
Gas phase:
H2, H2S and NH3:
( )
i Li LG i
i
G i
k a RT
dP P
C
dz U H
⎛ ⎞
= − ⎜⎜ − ⎟⎟
⎝ ⎠ (10)
Liquid phase:
H2:
( )
H2 LH2 H2
LG H2 L
H2
2 bed HDS HDS
L 6 bed HDN HDN
P
k a C
H
dC 1
ρ r
dz U
ρ r
⎛ ⎛ ⎞ ⎞
− +
⎜ ⎜⎜ ⎟⎟ ⎟
⎜ ⎝ ⎠ ⎟
⎜ ⎟⎛ ⎞
⎜ ⎟
= + ⎜ ⎟
⎜ ⎟⎝ ⎠
⎜ ⎟
⎜ ⎟
⎜ ⎟
⎝ ⎠
(11)
H2S and NH3:
( )
i Li i
LG i i
L i bed HDS HDS
P
k a C
H
dC 1
dz ρ r U
⎛ ⎛ ⎞ ⎞
− +
⎜ ⎜⎜ ⎟⎟ ⎟
⎜ ⎝ ⎠ ⎟⎛ ⎞
= ⎜ ⎟⎜ ⎟
⎜ ⎟⎝ ⎠
⎜ ⎟
⎜ ⎟
⎝ ⎠
(12)
Sulfur and nitrogen compounds:
(
)
i
1 bed HDS HDS L
dC 1
ρ r
dz U
⎛ ⎞
= ⎜ ⎟
⎝ ⎠ (13)
Brazilian Journal of Chemical Engineering Vol. 29, No. 01, pp. 135 - 146, January - March, 2012 Table 4: Boundary conditions
Boundary condition Value
( )
H2
P z=0 PH2in
( )
H2S
P z=0 0
( )
HN3
P z=0 0
( )
L H2
C z=0 L
H2in
C
( )
L S
C z=0 CSinL
( )
L N
C z=0 CLNin
( )
L H2S
C z=0 0
( )
L HN3
C z=0 0
Feed Properties Calculations
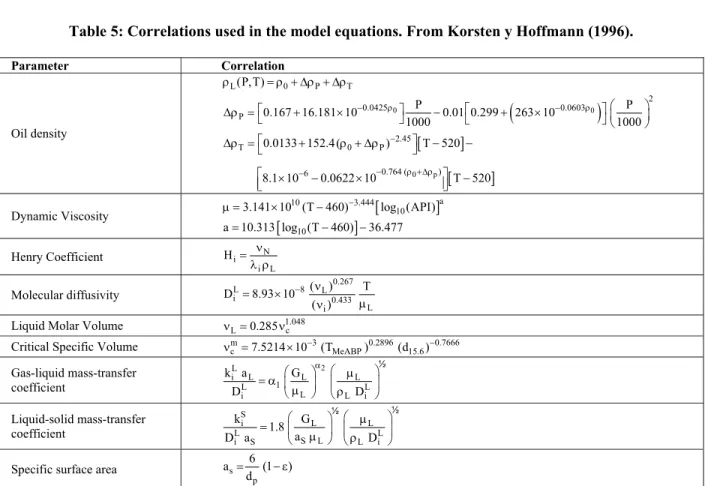
As per Eqns. (10 to 13), it is necessary to calculate some thermodynamic and fluid dynamic properties related to the feed in order to solve the mass balance equations, such as gas and liquid linear velocities, the mass transfer coefficient for the liquid-gas interface, Henry’s law constants and the catalyst effectiveness factor related to the internal mass transfer resistance. Some of the correlations used to
calculate these properties were taken from Korsten and Hoffmann (1996) (summarized in Table 5) and Yang et al. (2004).
The correlations used to calculate the solubility coefficients are now presented.
Cai et al. (2001) reported hydrogen solubility coefficients in several liquid hydrocarbons, such as hexadecane, tetralin, light gasoil, heavy gasoil, bitumen and atmospheric residue in the temperature range of 80 to 380ºC. Using these experimental data, we derived our own correlation for solubility coefficient calculations. These coefficients [NL H2/goil⋅MPa] depend on the temperature [ºC] and the crude oil density [g/cm3].
4 5
H 2
8 2 3
5 8 2
3 2 5 2
8 2 2
3.283 10 3.411 10 T
1.432 10 T 2.746 10
7.068 10 T 4.702 10 T
3.015 10 4.427 10 T
2.795 10 T
− −
− −
− −
− −
−
γ = × + × −
× + × ρ
− × ρ + × ρ −
× ρ + × ρ
− × ρ
(14)
Table 5: Correlations used in the model equations. From Korsten y Hoffmann (1996).
Parameter Correlation
Oil density
L(P,T) 0 P T
ρ = ρ + Δρ + Δρ
(
)
0 0
2
0.0425 0.0603
P
P P
0.167 16.181 10 0.01 0.299 263 10
1000 1000
− ρ ⎡ − ρ ⎤⎛ ⎞
⎡ ⎤
Δρ =⎣ + × ⎦ − ⎣ + × ⎜ ⎟
⎦ ⎝ ⎠
[ ]
[ ]
0 p
2.45
T 0 P
0.764 ( ) 6
0.0133 152.4 ( ) T 520
8.1 10 0.0622 10 T 520
−
− ρ +Δρ
−
⎡ ⎤
Δρ =⎣ + ρ + Δρ ⎦ − −
⎡ × − × ⎤ −
⎢ ⎥
⎣ ⎦
Dynamic Viscosity [ ]
a 10 3.444
10
3.141 10 (T 460)− log (API)
μ = × −
[ 10 ]
a=10.313 log (T−460) −36.477
Henry Coefficient i N
i L
H = ν
λ ρ
Molecular diffusivity
0.267
L 8 L
i 0.433
L i
( ) T
D 8.93 10
( )
− ν
= ×
μ ν
Liquid Molar Volume ν =L 0.285ν1.048c
Critical Specific Volume mc 7.5214 103(TMeABP)0.2896(d15.6) 0.7666
− −
ν = ×
Gas-liquid mass-transfer coefficient
2
L
i L L L
1
L L
L
i L i
k a G
D D
α ⎛ ⎞
⎛ ⎞ μ
= α ⎜μ ⎟ ⎜ρ ⎟
⎝ ⎠ ⎝ ⎠
½
Liquid-solid mass-transfer coefficient
S
i L L
L L
S L
i S L i
k G
1.8 a
D a D
⎛ ⎞
⎛ ⎞ μ
= ⎜ μ ⎟ ⎜ρ ⎟
⎝ ⎠ ⎝ ⎠
½
½
Specific surface area s
p
6
a (1 )
d
Yokoyama et al. (1993) reported hydrogen sulfide solubility coefficients in isooctane, n-decane, n-hexadecane and squalane in the temperature range between 323 K to 523 K and pressure below 1.6 MPa. We derived the following correlation as a function of temperature in [ºC] for solubility coefficient calculation in [NL H2/goil⋅MPa].
2 5 2
9 3
H2S 1 3 2
5 3
7.796 7.082 10 T 5.021 10 T
8.837 10 T
1.000 3.008 10 T 3.692 10 T
2.075 10 T
− −
−
− −
−
− + × − × −
×
γ =
− × − × +
×
(15)
Yokoyama et al. (1990 and 1991) present the ammonia solubility coefficients in pentane, n-hexane, n-heptane, n-octane, n-decane, n-undecane, and n-dodecane in the temperature range between 300 K and 370 K. We derived the following correlation as a function of temperature in [K] for solubility coefficient calculation in [NL H2/g crude⋅MPa].
NH3 2 6 2.79
1
8.552 10− 2.233 10 T−
γ =
× + × (16)
The concentrations in the liquid phase at the reactor inlet (Ci in) are defined by assuming, as did Korsten and Hoffmann (1996), that sulfur or nitrogen compound i has the same molecular weight as the whole crude oil, in their work, where w represents i the compound weight fraction.
L
i in i
ρ
C w
MW
⎛ ⎞
= ⎜⎝ ⎟⎠
(17)
The theoretical conversions inside the reactor are obtained using Equations (18) and (19). These parameters are also known as % HDS and % HDN, respectively.
1 in 1 out HDS
1 in
C C
X
C
−
= (18)
5 in 5 out HDN
5 in
C C
X
C
−
= (19)
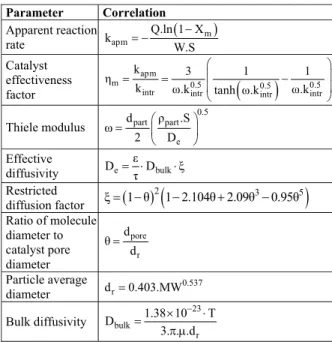
Yang et al, (2004) presented a method that allows the approximate calculation of the catalyst effectiveness factor using a simple mass transfer model. This model has the following assumptions:
1. The catalyst particles are perfect spheres. 2. There is no temperature profile in the catalyst.
3. The HDS and HDN kinetic expressions are assumed to be first order and irreversible.
Some researchers include the catalyst effectiveness factor within the kinetic constant in order to simplify the calculations and experimental adjustments (Froment et al, 1994; Korsten and Hoffmann, 1996). In this way, the kinetic constant becomes an apparent kinetic constant. With low LHSV, this constant is approximately equal to the kinetic constant.
The H2 concentrations in the liquid phase at the inlet and reactor outlet are very similar for high partial pressures; due to this, there is not an appreciable concentration variation along the reactor. This means that the term related to H2 concentration within the kinetic expression can be included within the kinetic constant, assuming the reaction to be pseudo first order.
The reaction order related to the sulfur and nitrogen concentration is equal to one, according to the proposed kinetic models of Botchwey et al. (2006), Schmitz (2003), Yang et al. (2005), Egorova and Prins (2004), McIlvried (1971), Qu et al. (2003), among others.
Chang (1997) obtained good results by calculating the catalyst effectiveness factor using a first order reaction according to his experiments carried out in a small scale reactor using bitumen as a feed. Based on this, we calculated the catalyst effectiveness factor, assuming that global reaction order is one.
The equations used to calculate the catalyst effectiveness factor are summarized in Table 6.
Table 6: Equations used for calculating the catalyst effectiveness factor (Yang et al.,2004).
Parameter Correlation
Apparent reaction rate
( m) apm
Q.ln 1 X k
W.S
− = −
Catalyst effectiveness
factor
(
)
apm
m 0.5 0.5 0.5
intr intr intr intr
k 3 1 1
k ω.k tanh ω.k ω.k
⎛ ⎞
⎜ ⎟
= = −
⎜ ⎟
⎝ ⎠
Thiele modulus
0.5 part part
e
d ρ .S
ω
2 D
⎛ ⎞
= ⎜ ⎟
⎝ ⎠
Effective
diffusivity e bulk
ε
D D
τ
= ⋅ ⋅ξ
Restricted
diffusion factor
(
)
(
)
2 3 5
1 1 2.104 2.09 0.95
ξ = − − + −
Ratio of molecule diameter to catalyst pore diameter
pore r
d
d
=
Particle average diameter
0.537 r
d =0.403.MW
Bulk diffusivity
23 bulk
r
1.38 10 T
D
3. . .d
−
× ⋅
Brazilian Journal of Chemical Engineering Vol. 29, No. 01, pp. 135 - 146, January - March, 2012 RESULTS AND DISCUSSION
Once all the equations for the mass balance were defined and all the thermodynamic and fluid dynamic parameters were calculated, we validated the reactor model. To validate the model, we first made a sensitivity analysis of all variables to determine their effects and importance on HDT reactions; we then adjusted the kinetics parameters, such as reaction orders, kinetic constants and adsorption constants for HDS and HDN. They were adjusted from experimental data available in Botchwey et al. (2003), including the external and internal mass transfer effect. The adjustment consisted of a parameter fitting process to match the conversion calculated by our model with the 24 experimental conversions reported by Botchwey et al. (2003) in order to minimize the mean relative error. With these adjustments, we accomplished a relative error of 3.15% for HDS and 3.98% for HDN. The values of the adjusted parameters are presented in the Table 7 and 8, recalling that the adsorption heats, the frequency factors and the activation energies were obtained through a linear regression of the Arrhenius expression for the kinetic constants and adsorption constants (see Eqns. 5 and 6).
Once the model was validated, we proceeded to study the partial pressures and concentration profiles under selected process conditions and the effects of
operational variables on the conversion in HDS and HDN.
Table 7: Adjusted kinetic parameters
Kinetic parameter Value
ma 0.993
mb 0.490
mc 1
md 1
Table 8: Adjusted kinetic parameters
Kinetic parameter Value
HDS
Ea (kJ/mol) 90.18
HDN
Ea (kJ/mol) 80.68
BHDS ((cm3/gcat.s)(cm3/mol)0,5) 4.421 × 10⁶
BHDN ((cm3/gcat.s)(cm3/mol)) 3.078 × 10⁶
2
H S
F (cm3/mol) 3.80 × 10⁴
3
NH
F (cm3/mol) 2.55 × 10⁻⁵
2
ads,H S
q (kJ/mol) 2.53
3
ads,NH
q (kJ/mol) 111.00
Partial Pressure Profiles in the Gas Phase
In Figures 1-3, we presented the partial pressure profiles along the reactor axis. All the graphs were generated at 350°C, 10 MPa, LHSV=1h-1 and
ϕ=600 NL H2/kg feed.
0 2 4 6 8 10 12
9.93 9.94 9.95 9.96 9.97 9.98 9.99 10
Catalytic bed length (cm)
P a rt ia l P res s u re (M P a ) 9.93 9.94 9.95 9.96 9.97 9.98 9.99 10
0 2 4 6 8 10 12
Catalytic bed length (cm)
Pa rt ia l P re s s ure (M P a)
0 2 4 6 8 10 12
9.93 9.94 9.95 9.96 9.97 9.98 9.99 10
Catalytic bed length (cm)
P a rt ia l P res s u re (M P a ) 9.93 9.94 9.95 9.96 9.97 9.98 9.99 10
0 2 4 6 8 10 12
Catalytic bed length (cm)
0 2 4 6 8 10 12
0 2 4 6 8 10 12
Catalytic bed length (cm)
Pa rt ia l P re s s ure (M P a)
0 2 4 6 8 10 12
0 0.005 0.01 0.015 0.02 0.025 0.03 P a rt ia l P re s s u re (M P a )
Catalytic bed length (cm) 0 0.005 0.01 0.015 0.02 0.025 0.03 Parti a l P res s u re (MPa )
0 2 4 6 8 10 12
Catalytic bed length (cm)
0 2 4 6 8 10 12
0 0.005 0.01 0.015 0.02 0.025 0.03 P a rt ia l P re s s u re (M P a )
Catalytic bed length (cm) 0 0.005 0.01 0.015 0.02 0.025 0.03 Parti a l P res s u re (MPa )
0 2 4 6 8 10 12
Catalytic bed length (cm)
Figure 1: Partial pressure of H2 along the reactor. Figure 2: Partial pressure of H2S along the reactor.
0 2 4 6 8 10 12
0 0.1 0.2 0.3 0.4 0.5 0.6 0.7 0.8 0.9
1x 10
-3
Catalytic bed length (cm)
P a rt ia l P re s s u re (M P a ) 0 0.1 0.2 0.3 0.4 0.5 0.6 0.7 0.8 0.9
1 x 10
-3
0 2 4 6 8 10 12
Catalytic bed length (cm)
Parti a l P res s u re (MPa )
0 2 4 6 8 10 12
0 0.1 0.2 0.3 0.4 0.5 0.6 0.7 0.8 0.9
1x 10
-3
Catalytic bed length (cm)
P a rt ia l P re s s u re (M P a ) 0 0.1 0.2 0.3 0.4 0.5 0.6 0.7 0.8 0.9
1 x 10
-3
0 2 4 6 8 10 12
Catalytic bed length (cm)
Parti a l P res s u re (MPa )
Concentration Profiles in the Liquid Phase Along the Reactor
In Figures 4-6, we present the concentration profiles in the liquid phase for H2, H2S, NH3, S and N.
It can be appreciated in Figure 4 for the H2 concentration profile in the liquid phase, that in the length range [0 1.25] cm, the gradient is negative. This means that the term related with the rate of mass transfer is smaller than the term related to the rate of chemical reaction, such that the H2 concentration in the liquid phase is depleted and almost all H2 is in the gas phase. On other hand, as the reaction advances, the mass transfer rate is
predominant over the chemical reaction rate term and a huge amount of H2 is transferred from the gas to liquid phase, increasing the concentration in the liquid phase. For the H2S case (see Figure 5), the explanation is analogous.
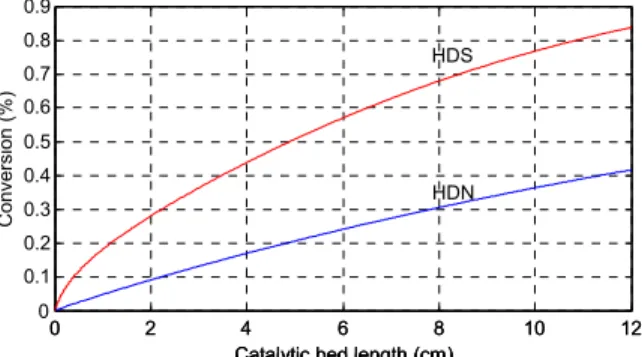
Conversion Profiles Along the Reactor
Figure 7 shows the increase in the extent of conversion for HDS and HDN as the reaction takes place along the reactor. It can be appreciated that the conversion for HDS is higher than for HDN at any time, because it is difficult to remove the smaller nitrogen content in the feed than the sulfur content.
0 2 4 6 8 10 12
5.65 5.7 5.75 5.8 5.85 5.9 5.95
6x 10
-4
Catalytic bed length (cm)
C o n c e n tr at io n i n l iq u id ph as e (gm o l/ c m 3)
0 2 4 6 8 10 12
Catalytic bed length (cm) 5.65 5.7 5.75 5.8 5.85 5.9 5.95
6 x 10
-4 Co nc en tr a tio n in liqu id p h as e (gm o l/ c m 3)
0 2 4 6 8 10 12
5.65 5.7 5.75 5.8 5.85 5.9 5.95
6x 10
-4
Catalytic bed length (cm)
C o n c e n tr at io n i n l iq u id ph as e (gm o l/ c m 3)
0 2 4 6 8 10 12
Catalytic bed length (cm) 5.65 5.7 5.75 5.8 5.85 5.9 5.95 6 5.65 5.7 5.75 5.8 5.85 5.9 5.95
6 x 10
-4 Co nc en tr a tio n in liqu id p h as e (gm o l/ c m 3)
0 2 4 6 8 10 12
0 0.2 0.4 0.6 0.8 1 1.2x 10
-4
Catalytic bed length (cm)
C on c en tr at io n i n l iq ui d ph as e ( gm ol /c m 3) x 10-4
0 2 4 6 8 10 12
Catalytic bed length (cm) 0 0.2 0.4 0.6 0.8 1 1.2 C onc en tr at ion in li qui d p h a se (g m o l/ c m 3) S
H2S
0 2 4 6 8 10 12
0 0.2 0.4 0.6 0.8 1 1.2x 10
-4
Catalytic bed length (cm)
C on c en tr at io n i n l iq ui d ph as e ( gm ol /c m 3) x 10-4
0 2 4 6 8 10 12
Catalytic bed length (cm) 0 0.2 0.4 0.6 0.8 1 1.2 C onc en tr at ion in li qui d p h a se (g m o l/ c m 3) S
H2S
Figure 4: H2 concentration profile in the liquid phase along the reactor.
Figure 5: H2S and S compound concentration profile in the liquid phase along the reactor.
0 2 4 6 8 10 12
0 1 2 3 4 5 6 7 8 9x 10
-6
Catalytic bed length (cm)
C o n c e n tr at io n i n l iq u id ph as e (gm o l/ c m 3)
0 2 4 6 8 10 12
Catalytic bed length (cm) x 10-6
0 1 2 3 4 5 6 7 8 9 C onc en tr ati o n in l iq u id ph a s e (g m ol /cm 3) N NH3
0 2 4 6 8 10 12
0 1 2 3 4 5 6 7 8 9x 10
-6
Catalytic bed length (cm)
C o n c e n tr at io n i n l iq u id ph as e (gm o l/ c m 3)
0 2 4 6 8 10 12
Catalytic bed length (cm)
0 2 4 6 8 10 12
Catalytic bed length (cm) x 10-6
0 1 2 3 4 5 6 7 8 9 C onc en tr ati o n in l iq u id ph a s e (g m ol /cm 3) 0 1 2 3 4 5 6 7 8 9 C onc en tr ati o n in l iq u id ph a s e (g m ol /cm 3) N NH3
Figure 6: NH3 and N compound concentration profile in the liquid phase along the reactor.
0 2 4 6 8 10 12
0 0.1 0.2 0.3 0.4 0.5 0.6 0.7 0.8 0.9
Catalytic bed length (cm)
C onv er s io n ( % )
0 2 4 6 8 10 12
Catalytic bed length (cm) 0 0.1 0.2 0.3 0.4 0.5 0.6 0.7 0.8 0.9 C onv er s ion (% ) HDS HDN
0 2 4 6 8 10 12
0 0.1 0.2 0.3 0.4 0.5 0.6 0.7 0.8 0.9
Catalytic bed length (cm)
C onv er s io n ( % )
0 2 4 6 8 10 12
Catalytic bed length (cm) 0 0.1 0.2 0.3 0.4 0.5 0.6 0.7 0.8 0.9 C onv er s ion (% )
0 2 4 6 8 10 12
0 0.1 0.2 0.3 0.4 0.5 0.6 0.7 0.8 0.9
Catalytic bed length (cm)
C onv er s io n ( % )
0 2 4 6 8 10 12
Catalytic bed length (cm)
0 2 4 6 8 10 12
Catalytic bed length (cm) 0 0.1 0.2 0.3 0.4 0.5 0.6 0.7 0.8 0.9 C onv er s ion (% ) HDS HDN
Brazilian Journal of Chemical Engineering Vol. 29, No. 01, pp. 135 - 146, January - March, 2012 Operational Variables Effect on HDS and HDN
The conversions of the HDS and HDN reactions are affected by the operational variables, such as temperature, LHSV, total pressure at the reactor inlet and H2/feed ratio, respectively. The effect of each mentioned variable is described here.
Temperature Effect for Different Liquid Hourly Space Velocity (LHSV)
For HDS as well as for HDN, it can be appreciated that the conversions increased as the temperature increases, because this variable has a positive effect on the kinetic constants, so the chemical reaction rate increased too. However, increasing the LHSV has the opposite effect, because, as LHSV is increased, the residence time decreases, this means that the reaction has less time to occur and less reactant is converted. The graphs in Figures 8-9 were generated at 10 MPa, LHSV= 0.6-1 h-1,
ϕ=600 NL H2/kg feed and T=340-400°C.
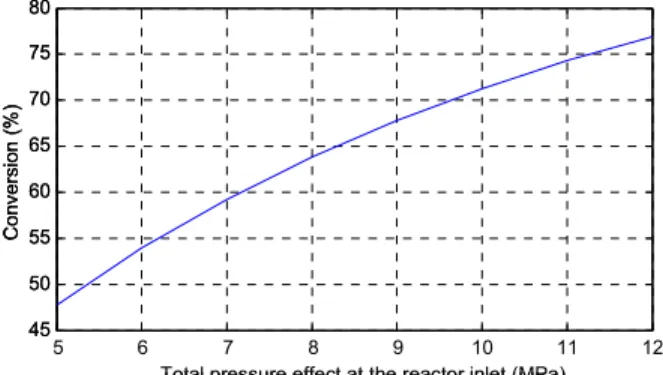
Total Pressure Effect at the Reactor Inlet
Figures 10 and 11 present the conversion profile as a function of the total pressure at the reactor inlet for HDS as HDN, at T=380°C, P=5-12 MPa, LHSV= 1 h-1, ϕ=600 NL H2/kg feed.
As can be observed from both Figures 10 and 11, an increase in the total pressure at the reactor inlet produces a slight increase in the conversion for HDS, but for HDN the effect on conversion is stronger. This is because the pressure always has a positive effect on HDS and HDN conversion, as indicated in the kinetic model.
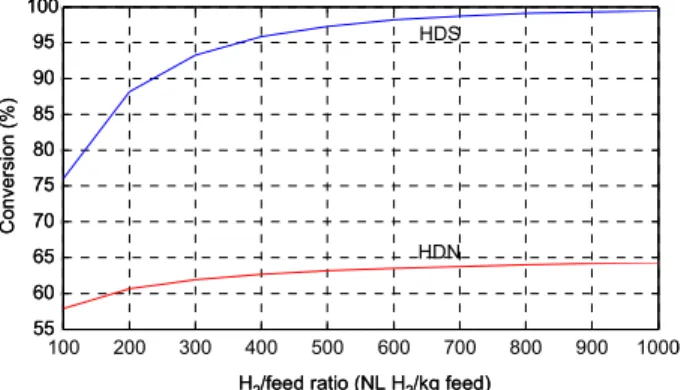
Effect of the H2/Feed Ratio
When more H2 is fed to the reactor, i.e., when the H2/feed ratio is increased, it can be appreciated from Figure 12, that this increase has a positive effect on the conversion for HDS as HDN. The conditions used to generate this graph were T=380°C, P=8MPa, LHSV=1 h-1 and ϕ=100-1000 NL H2/kg feed.
340 350 360 370 380 390 400
70 75 80 85 90 95 100 Temperature (°C) H D S C o nv e rs io n (% ) LHSV=1 LHSV=0.8 LHSV=0.6 70 75 80 85 90 95 100 HDS Co nv e rsion (% )
340 350 360 370 380 390 400
Temperature (°C)
340 350 360 370 380 390 400
70 75 80 85 90 95 100 Temperature (°C) H D S C o nv e rs io n (% ) LHSV=1 LHSV=0.8 LHSV=0.6 70 75 80 85 90 95 100 HDS Co nv e rsion (% ) 70 75 80 85 90 95 100 HDS Co nv e rsion (% )
340 350 360 370 380 390 400
Temperature (°C)
340 350 360 370 380 390 400
Temperature (°C)
340 350 360 370 380 390 400
30 40 50 60 70 80 90 100 Temperature (°C) HD N Co n v e rs io n ( % ) LHSV=1 LHSV=0.8 LHSV=0.6
340 350 360 370 380 390 400
Temperature (°C) 30 40 50 60 70 80 90 100 H DN Co nv er sion (% )
340 350 360 370 380 390 400
30 40 50 60 70 80 90 100 Temperature (°C) HD N Co n v e rs io n ( % ) LHSV=1 LHSV=0.8 LHSV=0.6
340 350 360 370 380 390 400
Temperature (°C) 30 40 50 60 70 80 90 100 H DN Co nv er sion (% )
340 350 360 370 380 390 400
Temperature (°C) 30 40 50 60 70 80 90 100 H DN Co nv er sion (% )
350 360 370 380 390 400
Temperature (°C) 30 40 50 60 70 80 90 100 H DN Co nv er sion (% ) Temperature (°C) 30 40 50 60 70 80 90 100 H DN Co nv er sion (% ) 30 40 50 60 70 80 90 100 H DN Co nv er sion (% )
Figure 8: Temperature effect on HDS conversion at various LHSV
Figure 9: Temperature effect on HDN conversion at various LHS
5 6 7 8 9 10 11 12
93.5 94 94.5 95 95.5 96 96.5 97 97.5
Total pressure effect at the reactor inlet (MPa)
C onver s io n (% ) 93.5 94 94.5 95 95.5 96 96.5 97 97.5 Co nv ersion (% )
6 7 8 9 10 11 12
5
Total pressure effect at the reactor inlet (MPa)
5 6 7 8 9 10 11 12
93.5 94 94.5 95 95.5 96 96.5 97 97.5
Total pressure effect at the reactor inlet (MPa)
C onver s io n (% ) 93.5 94 94.5 95 95.5 96 96.5 97 97.5 Co nv ersion (% )
6 7 8 9 10 11 12
5
Total pressure effect at the reactor inlet (MPa)
5 6 7 8 9 10 11 12
45 50 55 60 65 70 75 80
Total pressure effect at the reactor inlet (MPa)
C onver s io n (% )
5 6 7 8 9 10 11 12
Total pressure effect at the reactor inlet (MPa) 45 50 55 60 65 70 75 80 C onv er si on (% )
5 6 7 8 9 10 11 12
45 50 55 60 65 70 75 80
Total pressure effect at the reactor inlet (MPa)
C onver s io n (% )
5 6 7 8 9 10 11 12
Total pressure effect at the reactor inlet (MPa) 45 50 55 60 65 70 75 80 C onv er si on (% ) 45 50 55 60 65 70 75 80 C onv er si on (% )
Figure 10: Total pressure effect at the reactor inlet for HDS
100 200 300 400 500 600 700 800 900 1000 55
60 65 70 75 80 85 90 95 100
H
2/feed ratio (NL H2/kg feed)
C
on
v
er
s
ion
(
%
)
H2/feed ratio (NL H2/kg feed)
100 200 300 400 500 600 700 800 900 1000 55
60 65 70 75 80 85 90 95 100
Co
nv
e
rsion
(%
)
HDN HDS
100 200 300 400 500 600 700 800 900 1000 55
60 65 70 75 80 85 90 95 100
H
2/feed ratio (NL H2/kg feed)
C
on
v
er
s
ion
(
%
)
H2/feed ratio (NL H2/kg feed)
100 200 300 400 500 600 700 800 900 1000 55
60 65 70 75 80 85 90 95 100
55 60 65 70 75 80 85 90 95 100
Co
nv
e
rsion
(%
)
HDN HDS
Figure 12: Effect of the H2/feed ratio over HDS and HDN.
CONCLUSIONS
A three-phase reactor for Bitumen-derived gasoil hydrotreating, which incorporates the mass-transfer resistance at the gas-liquid and liquid-solid interfaces, was successfully modeled and validated. Correlations for predicting the solubility of H2, H2S and NH3 in hydrocarbon mixtures were developed and the calculation of the catalyst effectiveness factor was included.
The kinetic constants and the reaction orders are the parameters that affect the conversion significantly. The adsorption constants are not as sensitive as the other parameters mentioned above.
The adjustment of the kinetic parameters has 6.87 percent uncertainty related to the sum of square errors, for HDS and HDN reactions. This relative error was minimized by adjusting the model parameters to the 24 experimental conversions.
The calculation of the catalyst effectiveness factor, rather than merely setting it as to, it reduces the sum of square errors from 8.06% to 6.87%.
HDS and HDN conversions increase with temperature and H2/feed ratio, but decreases with LHSV.
For HDS as well as for HDN conversions, the increase of the total inlet pressure of the reactor produces an increase in both conversions. However, this effect is stronger for HDN.
Conversions for HDS are higher than for HDN due to the higher rate constants of HDS. This is also because sulfur compounds are more reactive than nitrogen compounds.
NOMENCLATURE
A Reactor Cross-sectional area cm2
API API gravity
Bm Frequency factor corresponding to the kinetic rate constant
same units of kHDS and kHDN L
S
C Concentration of sulfur compounds in the liquid phase
mol/cm3
L H2
C Concentration of H2 in the liquid phase
mol/cm3 L
H2S
C Concentration of H2S in the liquid phase
mol/cm3 L
N
C Concentration of nitrogen
compounds in the liquid phase
mol/cm3 L
NH3
C Concentration of NH3 in the liquid phase
mol/cm3 Dbulk Bulk diffusivity (Dbulk) m2/s Di Gas-Liquid molar
diffusivity
cm2/s
e
D Effective diffusivity m2/s
int
d Reactor internal diameter cm
dpart Equivalent particle diameter cm pore
d
Pore diameter mr
d Particle average diameter m
d15.6 Specific gravity at 15.6°C
m
Ea Activation energy for a reaction m
J/mol
i
F Frequency factor for compound H2S or NH3.
cm3/mol GL Superficial mass velocity g/cm
2 .s Hi Henry’s law Constant MPa·cm3/mol Kapm Apparent reaction rate cm3/s Kint intrinsic kinetic constant cm3/s kHDS kinetic rate constant for
HDS
a
m 3
cat (cm /g .s)
b
m 3 (cm /mol) kHDN kinetic rate constant for
HDN
c
m 3
cat (cm /g .s)
d
Brazilian Journal of Chemical Engineering Vol. 29, No. 01, pp. 135 - 146, January - March, 2012 2
H S
K Adsorption constant of H2S cm 3
/mol
3 NH
K Adsorption constant of NH3 cm3/mol i LG
(k a) Gas-liquid mass transfer coefficient
s-1
i LS
(k a) Liquid-solid mass transfer coefficient
s-1 LHSV Liquid hourly space
velocity.
h-1 ma Reaction order referred to
sulfur compounds in HDS mb Reaction order referred to
hydrogen in HDS
mc Reaction order referred to nitrogen compounds in HDN md Reaction order referred to
hydrogen in HDN
MW Molecular weight g/mol
i
P Partial pressure for compound i
kPa
Ps Pressure at standard conditions
kPa
Q Feed volumetric flow cm3/s
i
ads
q Heat of adsorption for compound H2S or NH3
J/mol
R Universal gas constant 8.3144
J/mol·K rHDS HDS reaction rate mol/gcat.s rHDN HDN reaction rate mol/gcat.s
S Specific area m2/g
T Process Temperature ºC
TMeABP Mean average boiling point temperature
°C
Ts Temperature at standard conditions
°C
UG Gas linear velocity cm/s
UL Liquid linear velocity cm/s
Vcat Catalyst volume cm3
vg Catalyst Pore volume cm3
vi Molar volume for gas i cm3/mol
vL Oil molar volume cm3/mol
W Catalyst weight g
WHSV weight hourly space velocity
h-1 XHDS HDS conversion
XHDN HDN conversion
Xm Conversion of reaction m, HDS or HDN
z Reactor length cm
Greek Letters
i
γ Solubility coefficient for gas i NL 2 oil H / g ⋅MPa
ε
Porositym Catalyst effectiveness factor for reaction m
Liquid kinematic viscosity mPa.s
υi Stoichiometric coefficient for compound i
bed
ρ Catalytic bed density g/cm3
L
ρ Oil density under process conditions
g/cm3
0
ρ Oil density under standard conditions
g/cm3 P
Δρ Density variation with pressure
g/cm3
T
Δρ Density variation with temperature
g/cm3
part
ρ Catalyst particle density g/m3
τ Tortuosity
ϕ H2/feed ratio mL/mL
ratio of molecular diameter to catalyst pore diameter
i Stoichiometric coefficient for compound i
ω Thiele modulus
REFERENCES
Botchwey, C., Dalai, A. K. and Adjaye, J., Product Selectivity during Hydrotreating and mild Hydrocracking of Bitumen-Derived Gas-Oil. Energy & Fuels, 17, 1372-1381 (2003).
Botchwey, C., Dalai, A. and Adjaye, J., Two-Stage Hydrotreating of Athabasca Heavy Gas Oil with Interstage Hydrogen Sulfide Removal: Effect of Process Conditions and Kinetic Analyses. Ind. Eng. Chem. Res., 43, 5854-5861 (2004).
Botchwey, C., Dalai, A. K. and Adjaye, J., Simulation of a Two-Stage Micro Trickle-Bed Hydrotreating Reactor using Athabasca Bitumen-Derived Heavy Gas Oil over Commercial NiMo/Al2O3 Catalyst: Effect of H2S on Hydrodesulfurization and Hydrodenitrogenation. International Journal of Chemical Reactor Engineering, 4, 1-15 (2006). Cai, H. Y., Shaw, J. M. y Chung, K. H., Hydrogen
solubility measurements in heavy oil and bitumen cuts. Fuel, 80, 1055-1063 (2001).
Chang, J., Kinetics and Catalyst Deactivity Model of Residua. Doctoral Thesis, Beijing Research Institute of Petroleum Processing, China (1997). Egorova, M. and Prins, R., Mutual influence of the
HDS of dibenzothiophene and HDN of 2-methylpyridine. Journal of Catalysis, 221,
Gary, J. and Handwerk, G., Petroleum Refining Technology and Economics. 3rd Edition, Marcel Dekker Inc., New York, pp. 178-181 (1994). Girgis, M. and Gates, B., Review: Reactivities,
Reaction Networks, and Kinetics in High-pressure Catalytic Hydroprocessing. Ind. Eng. Chem. Res., 30, 2021-2058 (1991).
Harding, R. H., Peters, A. W. and Nee, J. R. D., New Developments in FCC catalyst technology. Applied Catalysts A: General, 221, 390 (2001). Hofmann, H., Hydrodynamics, Transport Phenomena,
and Mathematical Model in Trickle-Bed Reactors. Int. Chem. Eng., 17, 19 (1977).
Korsten, H. and Hoffmann, U., Three-Phase Reactor Model for Hydrotreating in Pilot Trickle-Bed Reactors. AlChE Journal, 42, 1350-1360 (1996). López, R. and Dassori, C. G., Mathematical
Modeling of a VGO Hydrotreating Reactor. Society of Petroleum Engineering Inc., SPE 69499, 1-16 (2001).
Marafi, A., Fukase, S., Al-Marri, M. and Stanislaus, A., A Comparative Study of the Effect of Catalyst Type on Hydrotreating Kinetics of Kuwaiti Atmospheric Residue. Energy & Fuels, 17, 661-668 (2003).
McIlvried, H. G., Kinetics of the Hydrodenitrification of Pyridine. Ind. Eng. Chem. Process Des. Develop., 10, 125-130 (1971).
Poels, E. K. and Brands, D. S., Hydrotreating. (Supplementary information for the course: Catalysis, Theory and Applications), University of Amsterdam, pp. 1-16 (2002).
Qu, L., Flechsenhar, M. and Prins, R., Kinetics of the hydrodenitrogenation of o-toluidine over fluorinated NiMoS/Al2O3 and NiMoS/ASA catalysts. Journal of Catalysis, 217, 284-291 (2003).
Rodríguez, M. and Ancheyta, J., Modeling of Hydrodesulfurization (HDS), Hydrodenitrogenation (HDN), and the Hydrogenation of Aromatics
(HDA) in a Vacuum Gas Oil Hydrotreater. Energy and Fuels, 18, 789-794 (2004).
Sales, F. G., Maranhão, L. C. A., Pereira, J. A. F. R., Abreu, C. A. M., Experimental dynamic evaluation of three-phase reactors. Braz. J. Chem. Eng., 22, (3), 443-452 (2005).
Schmitz, C., Zur Kinetik und zur verbesserten Reaktionsführung der hydrierenden. Doctoral Thesis, Universität Bayreuth (2003).
Yang, H., Chen, J., Briker, Y., Szynkarczuk, R. and Ring., Z, Effect of nitrogen removal from light cycle oil on the hydrodesulfurization of dibenzothiophene, 4-methyldibenzotiophene and 4,6-dimethyldibenzothiophene. Catalysis Today, 109, 16-23 (2005).
Yang, C., Du, F., Zheng, H. and Chung, K. H., Hydroconversion characteristics and kinetics of residue narrow fractions. Fuel, 84, 681-684 (2004). Yokoyama, C., Shono, Y., Kaminishi, G. and
Takahashi, S., Liquid-Liquid Mutual Solubilities of Binary Mixtures of Ammonia with n-Pentane, n-Hexane, and n-Octane up to Upper Critical Solution Temperature. J. Chem. Eng. Data, 35, 50-52 (1990).
Yokoyama, C., Shono, Y., Kaminishi, G. and Takahashi, S., Liquid-liquid mutual solubilities of binary mixtures of ammonia with heptane, n-decane, n-unn-decane, and n-dodecane up to upper critical solution temperature. J. Chem. Eng. Data, 35, 50-52 (1991).
Yokoyama, C., Usui, A. and Takahashi, S., Solubility of hydrogen sulfide in isooctane, n-decane, n-tridecane, n-hexadecane and squalane at temperatures from 323 to 523 K and pressures up to 1.6 MPa. Fluid Phase Equilibria, 85, 257-269 (1993).