PRICING RECREATION USE OF NATIONAL PARKS FOR AN EFFICIENT NATURE CONSERVATION: AN APPLICATION TO THE PORTUGUESE
CASE
Isabel Mendes
Institute of Economics and Business Administration Technical University of Lisbon
Paper presented to the Permanent Seminar of the Department of Economics
Rua Miguel Lupi, nº20 1249-078 Lisboa Tel: 351 21 392 59 00 Fax: 351 21 396 64 07 E:mail [email protected] April 2003 JEL: A11; C13; D6; H4; Q26
Key Words: pricing; welfare; Nature Conservation; incentive based instruments; Travel Cost Method; marshallian outdoor recreation demand functions; empirical application.
Abstract
Current institutions, research, and legislation have not yet been sufficient to achieve the conservation level of Nature as required by the society. One of the reasons that explains this relative failure is the lack of incentives to motivate local individual and Nature users in general, to adopt behaviour compliant with Nature sustainable uses. Economists believe that, from the welfare point of view, pricing is the more efficient way to make economic actors to take more environmental friendly decisions. In this paper we will discuss how efficient can be the act of pricing the recreation use of a specific natural area, in terms of maximising welfare. The main conservation issues for pricing recreation use, as well as the conditions under which pricing will be an efficient and fair instrument for the natural area will be outlined. We will conclude two things. Firstly that, from the rational utilitarian economic behaviour point of view, economic efficiency can only be achieved if the natural area has positive and known recreation marginal costs under the relevant range of the marshallian demand recreation curve and if price system management is not costly. Secondly, in order to guarantee equity for the different type of visitors when charging the fee, it is necessary to discuss differential price systems. We shall see that even if marginal recreation costs exist but are unknown, pricing recreation is still an equity instrument and a useful one from the conservation perspective, as we shall demonstrate through an empirical application to the Portuguese National Park. An individual Travel Cost Method Approach will be used to estimate the recreation price that will be set equal to the visitor’s marginal willingness to pay for a day of visit in the national park. Although not efficient, under certain conditions this can be considered a fair pricing
practice, because some of the negative recreation externalities will be internalised. We shall discuss the conditions that guarantee equity on charging for the Portuguese case.
Introduction
IUCN defines conservation as “the management of human use of the biosphere so that it may yield the greatest sustainable benefit to present generations while maintaining its potential to meet the needs and aspirations of future generations” (IUCN 1980). Conserving does not mean non-use but rather a wiser use of Nature and landscape to achieve sustainable development. Conserving requires the implementation of a wide range of management tools, varying from complete preservation to incentive management. There are two main categories of instruments conventionally defined as regulatory or command-and-control (CAC) approach or incentive-based (IB) economic instruments. McNeely 1988 defines three main groups of CAC instruments to promote conservation: institutional mechanisms, implementing research programmes, and enacting and enforcing laws and regulations. Institutional mechanisms include the establishment and maintenance of government agencies for implementing conservation goals (e.g. a protected area management agency or wildlife management) and agencies for co-ordinating all the other government activities affecting Nature. IB instruments are generically defined as economic methods to encourage individuals and group’s behaviour to comply with conservation goals.
Society has already began the process of making intergenerational environmental transfers by setting aside selected stocks of environmental resources in the form of wilderness areas, wildlife sanctuaries, protected areas of the polar regions, national parks and other kind of natural protected areas (Dixon and Sherman 1990). IUCN defines a protected area as “an area of land and/or sea especially dedicated to the
protection and maintenance of biological diversity and of natural and associated cultural resources and managed through legal or other effective means” (World Resources 2000-2001, Technical Notes, p. 3). Through its Commission on National Parks and Protected Areas (CNPPA), IUCN maintain lists and define the several categories of conservation representing different levels of protection (Mendes 1997). National Park’s category is the most widely known form of protected area and is defined by IUCN as “ a protected area managed mainly for ecosystem protection and recreation” (World Resources 2000-2001, Technical Notes p. 3). The main conservation issues of this protected area is to guarantee protection to ecological integrity of rare and unique ecosystem for present and future generation for spiritual, scientific, educational, recreational and visitor opportunities, excluding all kind of exploitation or occupation which are incompatible to protection goals. The implementation of protection programmes accelerated all over the world since 1950 and began to be strongly adopted by developing countries after 1970’s. Society has been demonstrating the value it places upon intergenerational environmental transfers, by accepting to bear the opportunity cost of setting aside land and resources in their natural or almost natural state, only for scientific, educational, recreation, and biodiversity protection and sustainability purposes (Constanza et al 1997). Society accepts that funds originated in the taxing and budgeting process bee transferred to finance protected areas management as well as current owners of the ecologies to compensate them for the opportunity cost they bear by accepting to conserve their environmental resources.
However one lesson can be drawn from environmental management practice to date. Is that current institutions, research, and legislation have not yet be sufficient to achieve the conservation level of Nature, required for the welfare society. Constanza
1996 enumerated three disadvantages of CAC instruments as being responsible for this relative failure. Firstly they require high levels of technical and property information that is seldom available. Secondly they are costly because they require high monitoring and enforcement costs. And thirdly because there are no strong incentives to motivate local individuals and nature users in general to adopt behaviour compliant with nature sustainable uses. Hence, environmental regulations are easily evaded or avoided. National governments and local administration are facing difficulties in protecting their natural areas. Budget problems, insufficient personnel, and the rise of economic pressure over environment are on the alert to the necessity of adopting new mechanisms to improve Nature protection (OECD 2001, EU 2001, MOT 2001). Several economists and biologists as well also recognised the urgent need for alternative approaches to Nature management that are less costly and more efficient then the more traditional CAC’s (Baumol and Oates 1975). They generally argue that critic Nature has to be incorporated into the market system (Hanemann 1988, McNeely 1988, Randall 1988). However, some other economists and ecologists have shown that too little Nature will be conserved by market forces alone1 because Nature
exhibit quasi-pure public good characteristics2, an open access’s free rider problem, and lack or insufficiently stated property rights (Coase 1960). Because of these market failures individual users have too little incentive to conserve species because they earn immediate benefits from exploiting Nature without paying the full social and economic costs of its depletion. Instead, individual users transfer these costs to society
1 The rational, typical utilitarian individual behaviour characterised by the exploitation of Nature till its
extinction or irreversible damage is explained by Hotelling’s model (Hotelling 1931). In short he argues that in the absence of market failures and if the value of the environmental/cultural resource is not increasing as fast as the rate of interest, both individual owner of the resource and society would be economically better off exploiting the resource faster, and investing the returns in the creation of human-produced capital.
2 Nature is not exchangeable on markets; up to a point one individual’s enjoyment does not affect
to be paid either now or in the future. Therefore, although users may benefit collectively from managing Nature in a sustainable way, from the individual point of view he/she can be better off by cheating and increasing their own use. As for the property rights problem it often happens that over exploited environmental resource and landscape tend to be the ones with the weakest or even non-existent ownership. However, in more developed countries like some Europeans, it often happens that biodiversity has private owners. But in the absence of markets, the private owner of the natural resource is not enabled to capture the benefits of Nature conservation. Hence, the private rational option will be to exploit the resources to extinction or its irreversible destruction. This bunch of market failures and its negative consequences upon environment explain why an effective and sustained government intervention is required to meet the values and needs society expects to have from conservation, all together with market forces (McNeely 1988, Constanza et al 1997, and Jakobsson and Dragun 1996).
The objective of this paper is to investigate to what extent one can affirm that pricing the visitors of a protected area for the right of using the site for outdoor recreation is or it is not an efficient and equity way of generating income and of improving nature conservation. It is out of the objectives of the paper to compare the degree of efficiency of this economic instrument with the degree of efficiency of others. The effects of the use of the prices will only be analysed in the local context of his/her application, and not in contexts geographically broader. The study will just have in bill line the extent of a protected area with variable output i. e., without any physical limit of capacity. The paper is divided in two parts. In the first the objective is framed in the perspective of the environmental politics of conservation and the theme is controlled but often is not regulated; and the quantity of the good consumed (visits) can be inferred from observations of individual behaviour.
approached theoretically. In the second part the conclusions of the first one are applied, through an empirical approach to a Portuguese protected area. In the first section one defines the economic instruments that are more used in the conservation of nature. In the 2th one discusses the conditions under which recreation prices can be applied in bill with efficiency, income generation, justness and environmental conservation issues. The empirical application is made in the third section. Using a Travel Cost Method approach one estimates a price to charge the visitors of the park, to be paid for the right of using it for recreation ends. Conditions under which that price must be charge will be discussed for this specific case. Finally, in section 4, Conclusions and final remarks will be presented.
1. Incentive Based Instruments for Nature Conservation
An incentive is any stimulus specifically used to incite and/or motivate economic, social and administrative agents to comply with Nature conservation strategies. They are used to divert resources (e. g. land, capital, and labour) towards Nature conservation and to incentive the participation of those groups and agents that work in or live within protected areas to adopt sustainable development options. A disincentive is any stimulus or mechanism specially designed to discourage economic, social, and administration agents from depleting Nature. In recent environmental literature, misleading references are often made to the so-called “market based approaches” or “market instruments” (Barbe 1994, OECD 1989). These classifications induce instruments designed to influence producer and consumer’s behaviour, but which have loose links with the market mechanisms. In this paper OECD’s IB instrument concept is adopt (OECD 1989) accordingly to which some instrument is IB if it promotes financing stimuli, voluntary action stimuli, involvement of government authorities, and the intention of maintain or improve environmental quality directly or
indirectly. A fully description and discussion about advantages and disadvantages of IB instruments are far beyond the main issue of this paper3. Only IB instruments applied to protected areas will be enumerated and defined, and major objectives regarding management of protected areas will be underlined as well. There are different IB instrument’s types for conserving Nature, which can be categorised in several ways (McNeely 1988). A possible taxonomy is to consider that an incentive may be of the direct or indirect type and can be applied at international, national and local level. In this paper only the latter will be studied. When government classifies some region as a protected area, biological resources of that region may be put under threat because the responsibility of management is transferred from people who lives inside or close to the protected area to governmental agencies, located far away from the region. However, the direct costs of protection typically fall on the inhabitants who otherwise might have benefited from exploiting the Nature. Thus, there is a problem of justice, which may have severe consequences if inhabitants have an economic disadvantage. Under this context IB instruments are implemented to address four issues. Firstly they must give local communities the means to develop sustainable activities. Secondly they must reduce economic pressure on environmental rich lands, by incentive locals to devote them instead to biological conservation and to concentrate economic and social activities on less biological rich lands. Thirdly they must conserve traditional knowledge and cultural systems. And fourthly they must compensate locals for possible foregone income associated with the protection option. Fees, rewards, fines, compensation, subsidies, and loans (or credit), land banks, revolving funds, and daily wages are examples of direct IB instruments to improve sustainable management of protected areas. Tax incentives, security guarantees and
insurance, indirect service incentives (e. g. community development and biological diversity), and social incentives for conserving Nature are examples of indirect IB instruments (McNeely 1988). Fees are charged to national park visitors for the right of using the natural amenities for outdoor recreation. Two effects are expected from a fee: a ration’s, and distribution one. Rewards mean cash rewards provided to inhabitants for outstanding service or for exemplar behaviour regarding conservation of nature. These cash schemes are more applied when managers try to seek support from the locals to control the outsiders activities. They are applied wen the issues of conservation are violated (e. g. illegal cutting trees, poaching of animals, illegal economic activities prohibited by the conservation objectives). If a portion or the total of these fines return to locals for sustainable development activities assigning policy responsibility to local administration for this management, than fines are also an IB instrument. To be effective fines need to be higher than the value of the damage. Compensations are cash compensations for damages arising from the protection objectives (e. g. when protected animals like wolfs prey on livestock). Subsidies are provided to support those activities that intentionally or necessarily operates at a loss while meeting community needs. They are usually used to finance specific activities involving high levels of investment (e. g. reforestation, wildlife management schemes) or to avoid activities that damage Nature. Land bank is a conservation IB scheme based on a program of land retirement on environmentally sensitive areas supported by direct income compensation schemes. Loans (or credit) are often used to support activities aimed at conserving and that require funds beyond the capacity of an individual to provide. These incentives enable local community to develop on its own land, by providing it with access the markets, improved packaging, and means to negotiate the best prices for the products they produce. Revolving funds are types of
capital loans where an initial fund is established in a community and then distributed to individuals to purchase inputs or to hire labour for the crops. After harvest, the loan is repaid with nominal interest, thereby with providing the basis for another cycle of loans. A daily wage is to be paid by governmental managers to locals, in return for activities related with the conservation issues (e. g. reforestation, cleaning, building of trails and firebacks). These are very important incentives, especially when they are provided during times of low demand for agricultural work. The issue for tax incentive instruments adoption is to generate greater investments in conservation, or to compensate farmer for sacrifices in the name of conservation efforts. They can involve individuals or corporate entities, which are exempted totally or in part from government taxes (on property, income, sales, capital, and/or inheritance). For instance tax deduction can be provided for sustainable investments that contribute to Nature conservation, and social and economic development as well (e. g. nature tourism activities); especially if the investments are implemented by local individuals or corporations. Security, guarantees, and insurance scheme are used to reduce the stress caused by uncertainty and to reinforce community security. These are important incentive schemes, especially when rural look upon natural ecosystems as reserves in times of particular stress.
As for indirect service incentives, their issue is to ensure that local community steadily reduces its dependence from the outside, by making he/she realises that Nature conservation is a tool and a mean to promote local sustainable development.
2. Pricing visitors for the recreation use of a National Park
With the rising of outdoor recreation demand in protected areas, there has been a growing concern with methods of rationing recreation use. The method of rationing that is usually recommended by economists is pricing (Baumol and Oates 1975;
Rosenthal et all 1984; Cullen 1985). The efficiency effect of pricing versus other use rationing methods4 like lottery, queuing, and reservation, are discussed in Fractor 1982. More specifically, marginal cost pricing is recommended because it rations recreation demand in such a way as to meet the goal of economic efficiency (Rosenthal et all 1984). When we talk of economic efficiency we are referring to the Potential Pareto Improvement operational definition concept i. e. the sum of the benefits to those who gain from an action is greater then the sum of the losses of those who are hurt. The evaluation, in commensurate terms, of losses and benefits associated with consequences of some action, is though required. To achieve the losses one has to know the process by which consequences are produced. To achieve benefits an operational definition of the value as well as a method to measure it, are required. In economic terms, value is the maximum willingness to pay revealed by an individual. In our case the recreation value of a national park is equal to the maximum willingness to pay for a certain amount of recreation visits revealed by a national park’s representative visitor. If the market price is less than recreation value, the difference is the visitor’s surplus, a gain realised by the visitor. If the market price is greater than the minimum willingness to sell of the recreation supplier, there is a gain to the supply side, the producer’s surplus. Welfare economics states that, in a competitive market, total visitor and producer surpluses will be maximised when the transaction price is set at marginal cost, which means that, at that price, marginal visitor’s surplus equals marginal producer’s surplus, which are equal to zero. When one says that pricing public natural areas for recreation purposes is the better ration method, one wants to say that it is the more efficient one in theoretical terms under certain circumstances, i. e. it maximises consumer and producer surpluses. The concept does not consider however the problem of the distribution of benefits and
costs among individuals. It only requires that the aggregate benefits exceed the aggregate losses, not that compensations really occur. Therefore, one of the issues of the social action of pricing recreation in national parks is for the economic efficiency sake. By making those who directly benefit from the use of the protected areas to pay for it, we are applying the user-pays principle that implies that the cost of marketed goods and services should reflect their full social cost i. e. production and environmental costs (Barbe 1994). But to get economic efficiency is not the unique goal of pricing. There are others related with social-economic issues, i. e. equity, community stability, and environmental quality. For instance, the revenue generated by pricing can be used as an additional source of getting financial funds to support the costs of managing the protected area. It is also an incentive to local community to accept and truly adhere to conservation practices, by showing them that protecting may be synonymous of wealth, not of lost development opportunities. As for the ration effect the important point is that by pricing, it is assumed that those who are willing to pay for an entrance fee because they feel that the site is unique and has no substitutes, are allowed in. Those who do not feel the uniqueness of the national park or because they think there are other natural sites almost as good, they will not be willing to pay the entrance fee and, therefore, will be excluded.
Conditions for Pricing Efficiently a Recreation Visitor
The circumstances that promote inefficiency in the market’s utilisation of national parks to produce outdoor recreation are addressed in McConnell 1985. The answer relies on the nature of outdoor recreation. It is a service produced and consumed by the same individual. He or she must transport himself to the site, he must buy some goods and services to produce the recreation activity he desires to consume (e. g. camping, hiking), and he must have a natural resource. The only concern for society is
the supplying of the natural resource that is exogenous to the individual. Therefore, total National Park recreation supply cost in order to the number of visitors is equal to the total cost society has to bear with the National Park. Total Conservation costs (i. e. the opportunity cost by setting lands aside for protection, administrative costs with the creation and management of the national park, and conservation costs), plus start-up and management costs associated with the level of recreation, plus congestion and environmental costs associated with visits are fractions of total National Park costs society has to bear. Marginal costs in recreation arise from congestion and ecological damage related with the visits, and from the national park’s operating costs strictly related with outdoor recreation. Congestion and ecological costs arise when a marginal visitor affects or precludes the use of the site by another, but generating only little other direct cost. These are very common when recreation demand level exceeds the current natural recreation’s facility capacity. Operating costs is the extra operation and maintenance cost imposed by an additional visit. Hence, there can be economies of scale in the provision of the resource for outdoor recreation. In order to price efficiently for a recreation visit four cost situations must be distinguished. Firstly when total costs are equal to conservation costs only. Secondly when average recreation supply total costs are decreasing under the relevant range of demand recreation curve. Thirdly, when they are over the relevant range of demand recreation curve. And finally the fourth, when demand pressure is so high that the park has U-shaped average and marginal cost curves under the relevant range of the recreation demand curve. This last situation may be common in the case of smaller protected areas, located near population centres, facing some level of restriction capacity, and high level of recreation demand.
If recreation supply total costs are equal to conservation’s only, it is because congestion and environmental depletion do not occur. Hence, all the other recreation costs being equal to zero, it is not appropriate to incentive or disincentive an additional visitor by a price because marginal recreation cost is equal to zero. Therefore no recreation fee will be charged and no ration process based on pricing can be applied (Baumol and Oates 1975). This would be an efficient solution in the case of very large protected areas, located far away from population centres, facing low levels of demand for recreation. The very same conclusion is to be taken if congestion and environmental costs are positive although very low and if the administrative cost of charging the fee (i. e. the administrative cost of exclusion and/or fee collection) is excessively high. Under these circumstances pricing may not be a suitable IB instrument.
If congestion, environmental, and operational recreation costs are positive, and if the average recreation total cost bore by the park is decreasing under the relevant range of demand recreation curve, there is a situation of existing economies of scale and rising marginal supply costs. Therefore the national park manager will act like a private instead of a public agent, because the non-rival in consumption does not exist in the presence of congestion. Hence, some demand rationing is necessary when there is a limit to capacity use, and an admission fee must be charged till the moment visitors are sufficiently few for imposing congestion costs. Under these circumstances the key issue related with pricing will be to set a price so that balance between efficiency and equity will be achieved within a variable output backdrop5. Figure1 depicts a
5 By a variable output backdrop we are assuming that national park visitors can produce/consume
several units of output measured in number of visits facing any type of constraint. In this paper we are not interested in the case where there is a quantity constraint to the supply meaning there is a previous capacity limit for recreation visits, established by the national park’s managers (see Rosenthal et all 1984 for details).
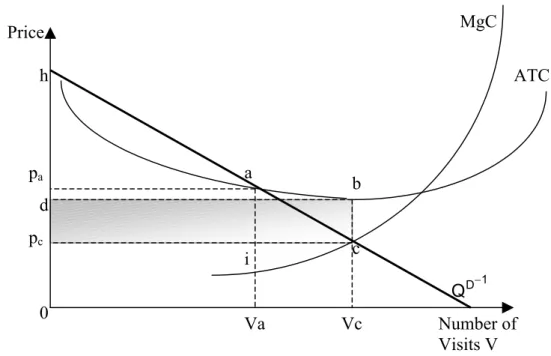
recreation site with rising recreation supply marginal costs 6 (MgC) and whose average total cost (ATC) (i. e. total cost divided by the number of visits) is declining under the demand curve. The solution that corresponds to an optimum from the efficiency point of view is given when recreation price is setting equal to the MgC (pc
= MgC), and the quantity Vc is sold. Hence, net economic benefit (consumer/producer
surpluses) will be maximised because the price of purchasing the goal (the right of using the national park) is set equal to the cost society bears with its production, at the margin. However, the national park will experience a loss equal to the area dbcpc.
This means that some additional financial resources have to be collected from another source to subsidise the loss, and this may penalise non-users of the national park. A second-best pricing policy may be an efficient alternative to the last one. Price will be set equal to the average total costs which means to sell Va units at price pa, so that total revenue will be equal to the total cost i. e. area 0paaVa. With this second-best
solution the national park has to require no subsidy because it has nonnegative profits. However this is not an efficient solution because the output Va is too little relative to the efficient current Vc, and the price of transaction is higher than the efficient one. The total loss incurred by society from non-adopting the efficient solution is equal to the area iac and corresponds to the deadweight loss7. Therefore we can conclude that in the presence of economies of scale, marginal and average based pricing policies are not the more adequate. The former because, although efficient in terms of resources allocation, the revenues are insufficient to cover the costs. And the later because although logical from the financial point of view it is economically inefficient. It
6 Marginal Cost (MgC) is the derivative of total recreation supply costs in order to the number of visits.
Total recreation supply cost is equal to the costs society has to bear with the conservation. Opportunity, administrative, and managing costs are included, plus congestion, environmental, and start-up costs associated with the recreation level.
7 Deadweight loss is a welfare indicator of losses of wellbeing incurred by society, for the option of not adopting
seems that other alternative pricing policies have to be used to price efficiently the recreation access to a national park.
One alternative solution is second-best prices or Ramsey prices. This is a theory of pricing for goods provided by public sector or natural monopolies regulated under a budget constraint8. The general proposition of the theory is that prices should be raised above marginal costs to satisfy the budget constraint, and that the prices of goods with more inelastic demands should be raised the most above the marginal cost. The applicability of Ramsey pricing to the allocation and revenue problems associated with the supply of outdoor recreation resources is addressed in Wilman 1988. It is
stated that, under
Price Number of Visits V MgC ATC 1 D Q − pa d pc a b c Vc Va i 0 h
Figure 1 Solutions For Pricing the Use of a National Park for Recreation
special assumptions, Ramsey pricing is consistent with different pricing alternatives founded in literature, like average cost pricing and two-part pricing. It is the most economically efficient form of public pricing under a budget constraint, because it is
specifically designed to cover recreation costs under the assumption of minimising consumer’s surplus losses (Wilman 1988).
Another alternative solution to the pricing problem of natural parks is two-part pricing. Under two-part-pricing, visitors are allowed to dispose of the same number of visits than that they could get at the efficient solution and price will be set at a level high enough to make sure that visitors pay the full cost of the visits. The price will be equal to marginal cost plus an additional flat fee for the right to get any number of visits. In figure 1 price would be set at pc and consumers would pay a fee equal to the
area pcdbc. This pricing solution has the advantage of having the desirable features of
the marginal cost one and all the costs with the supplying of public recreation facilities completely covered (Rosenthal et all 1984; Wilman 1988).
A third alternative solution is to make the visitor pay his reservation price9. This is a perfectly discriminating price like solution that allows putting visits at the competitive level (Vc). Revenues would be equal to the area 0hcVc of the Figure 1. This pricing solution is efficient as well as equitative from the social point of view. However it is not easy to put it into practice because one have to make each visitor to reveal his maximum willingness to pay for each visit.
Finally, a fourth solution is a two-step like process. It is related with the type of relationship that exists between the level of the visits, the existing recreation facilities, and the level of the recreation price. For example if the national park’s price raises from zero to some positive level, the number of visits is expected to fall and, therefore, fewer facilities will be needed because the demand for them will decrease. To address this solution, price is set equal to the existing, not the optimal, level of site development, if possible at marginal cost prices level because of economic efficiency
9 Reservation price is the maximum amount a visitor is willing to pay for each ith last visit to the
issue. This is the first step. Then, additional investments are undertaken and the new price will be set, after the investment, at the new marginal cost level.
If congestion, environmental, and management recreation costs are positives and decreasing over the relevant range of demand recreation curve, costs are significantly greater than the recreation benefits of the visitors. Under these circumstances it is not possible to adopt any efficient price solution. Visitors would not accept to pay a price set equal to a marginal cost that is far beyond their marginal willingness to pay. However some fee must be set in order to internalise at least part of the negative consequences of the recreation externalities, for the sake of the other goals associated with the price IB instrument. A socially acceptable equity way is to set the fee equal to the marginal benefit of the visitor. Visitors will adjust their visits automatically until their marginal visit cost equals the fee and demand pressure will decrease (ration effect). Hence this will have a direct positive effect upon environment through ration.. Park’s revenues will raise (revenue effect) and this will have obvious positive consequences upon environment.
Finally, if marginal and average recreation costs curves are U-shaped under the relevant range of the demand curve, the park’s managers face a traditional monopoly situation. Thereby the efficient solution is to set the price equal to the marginal recreation cost and to practice a perfect discriminating pricing policy. Consumer and producer surplus would be maximised, visits would be set at the efficient level, social equity would be accomplished, and environment would benefit both directly and indirectly from the ration effect, the revenue effect and the equity effect.
In short we can conclude that there is at least one basic condition for pricing recreation efficiently in the absence of any use limit of the site: marginal recreation cost must be positive under the relevant range of the demand recreation curve.
However, if marginal recreation cost is positive and over the marginal benefit of the recreation visitor, some fee must be charged in order to help meeting the other pricing conservation goals but economic efficiency. However, the net benefit of the price system’s administration project must not be negative10.
Conditions for pricing natural parks for recreation under revenue, and equity issues
Setting entrance fee equal to marginal recreation cost may be an efficient way of pricing outdoor recreation but does not concern revenue or equity issues. Several researchers have been studied the secondary effects concerning recreation pricing (see Ward and Beal 2001 for details). Issues like the impact of a fee on the participation rate, revenues, and willingness to pay were assessed. They conclude that when an entrance fee system is applied to a national park, some of the outdoor recreation’s demand characteristics shall be considered, which means that a differential entrance fee based system must be adopted.
Differential entrance fee system based on the cost sharing across types of recreation visitors
This differential entrance fee’s system helps to allocate recreation use among different sites. It is common to have different kind of recreation visitors like the group of the wilderness buffs and the group of the ordinary recreationists. The former is characterised by those who visit the site because they have some degree of perception of the natural uniqueness of its ecosystems and landscapes. This group is assumed to have lower price-demand elasticity. The second group is characterised by those who get just as much enjoyment out of recreating in a specific protected area as in another recreation activity but outdoor recreation. This group is assumed to have higher demand price elasticity values. If there is only one national park and no other similar
10 As is the case of the national parks occupying a large geographical zone, with multiple access, generally located
protected area or recreation activity, both types of visitors should be charged the same marginal cost price per unit of use. This is because it is not fair to charge a higher price to those who have more elastic recreational demand as they have no place to turn to avoid the change (Baumol 1986). If there is some alternative to national park the same equity principle suggests that wilderness buff visitors will pay relatively higher fees in comparison with the corresponding marginal costs. This is because they benefit the more with the decreasing congestion associated with the shift of the group of ordinary recreationists to other recreation activities (Wilman 1988). This very same argument still stands in the case of non-existence of an alternative of the same conservation category as that of the national park’s. One must remember that this conservation category is only used to protect unique biodiversity sites, and it is assumed that a wilderness buff visitor has a clear perception of that uniqueness and rarity. Hence, under the equity’s principle, if these visitors are the ones that enjoy more benefits from the wild recreation experience, then they are also the ones who are willing to pay for a higher entrance fee. This willingness to pay shall even rise if a strong decrease of congestion and depletion costs as well is to be expected. Another example of a different recreation user group is the case of a group of students or purists versus high income ones. The former are expected to have low income but plenty of time to spend and/or they may find payment incompatible with what they perceive about the wilderness experience and/or their philosophical opinions about paying for using nature resources. This group is supposed to have elastic demand curves. The second group is suppose to have stringent time recreation constrain and are willing to pay large amounts for the recreation resource itself. They are assumed to have an inelastic demand curve. Both groups will be better off if they paid a price for the supply of the right of using the resource that they would have been without the
national park being supplied. Hence, and accordingly to the equity tax rule, high-income-inelastic demand group should pay a greater entrance fee than that of the second group.
Differential entrance fee system based on different allocation of use through time
This differential entrance fee system helps to allocate recreation use among different serial of time. Uneven demand is the main national park recreation demand characteristic. It is common to have peak periods at school holidays periods and weekends as well as long weekends. During peak time periods, congestion costs are to be dominant in marginal cost of supplying the site. During non-peak periods marginal operating costs are dominant. By charging higher entrance fees at more popular times and lower entrance fees at less popular time, would help to reduce biodiversity pressure during peak time periods. This peak-load pricing strategy could be economically justifiable because a higher price corresponds to higher marginal social costs due to increased environmental and congestion costs. This argument still stands even in the presence of two different groups of visitors: the first, with no recreation constraints, being able to use the national park only during a specific time period and the 2nd with time constrains. Both groups are better off paying an entrance fee of the peak-load pricing type than they would be without the national park opened during the non-peak period (Wilman 1988).
3. Pricing the Recreation Use of National Park Peneda-Gerês (NPPG)
NPPG was created in 1971 by the law no. 187 of May 8. Located to Northwest of Portugal, it includes a surface of 72 000 ha (0.78% of continental Portugal in 2002) the total extending for the territories of Melgaço, Arcos de Valdevez, Ponte da Barca, Terras do Bouro, and Montalegre municipalities. It is an Area of Special Birds Protection and a site included in the National List of Sites (Net Natura 2000). The
Palheiros and Albergaria Forests are Biogenetic Reserves (Council of Europe). It is 37 km away from the third urban centre of the country (Braga), 102 km away from the second metropolitan area (Porto) and 402 km away from the first metropolitan area (Lisbon). It is a mountainous region, with a diversified orientation of the relief, not far away from the Atlantic Ocean with great altitude unevenness. Their specific geomorphic and geographical characteristics favoured the formation of several and quit diversified ranges and a great variety of vegetable species, formerly populated of an extremely rich fauna. The park is rich in rare botanical species (as the lily of Gerês, an Iberian endemism, or the fetus of Gerês) and it presents important stains of well conserve oak-groves, riparial vegetation and peat-bogs. The park holds 114 villages, where 10 000 residents are devoted basically to the mountain agriculture and pasture. Too strong humanisation of the area in continuity from the Neolithic period has produced a strongly humanised landscape, that he/she keeps a rich historical-archaeological patrimony. Though this permanent dialogue between Man and Landscape didn't result in heavy ecosystems breach. It produces instead curious humanised landscapes like those of lameiros and prados de lima. The residents’ historical presence has been conditioning the administration of the Park strongly forcing to his/her order in two great areas. The area of natural ecosystem (the nature reserve, that is intended that it continues preserved from the human activities) and the more humanised rural area, opened to all sustainable human activities. The Park has a rich fauna that includes the wolf, the stag, and savage ponies, several species of bats and Iberian Peninsula typical mountain birds. The area is fertile in prehistoric and Roman tracks, medieval monuments, curious mountain agglomerates and popular architecture.
At present, the administration of the park struggles with problems related with financing, human desertification, raising demand of the park for recreation activities, and deficit of education and environmental information on the part of the population in general. The budget of the Park is 13% (OECD 2001) of the total expenditures the Nature Conservation Institute (ICN) has with the management of all the Portuguese protected areas11. The budget significantly increased over the 1990’s largely reflecting the EU co-financing which accounts for 59% of the NPPG budget during the 1994-99 period (OECD 2001). But in 2003 it decreased heavily due to strong budget constraints the country is actually facing. Accruing to the Portuguese financing constraints, EU co-financing may also decrease in 2006. This means further exploration of the possibility of raising funds from private sources will be advisable, like user fees paid by visitors. Along with these financial problems depopulation of rural areas in the interior can make even harder the task of managing the park because traditional agriculture and pasture helps strongly to preserve landscape and natural habitats. Although tourism activity is expected to offer a supplementary source of income to the population, tourism demand must be carefully regulated to minimise the risk of accrue even more the physical or biological environmental damages. This kind of damage is one of the problems PGNP managers are facing actually.
Like many other European national parks, PGNP experiences uneven recreation demand, with a peak period during summer i. e. July, August and September. But it is in August that recreation demand rises exponentially. The rest of the year is non-peak period. There are no available statistics to account and characterise recreation visitors. The only existing data are those of park’s camping sites and they are not sufficient enough to characterise recreation demand. The recreation supply total cost is not
11 One National Park – II IUCN Category; 9 Nature Reserve – IV IUCN Category; 12 Natural Park – V IUCN
known. However both park managers and visitors complain because they have the perception that recreation demand level usually exceeds current natural recreation’s facility capacity. Hence, we can conclude that there are congestion and environmental depletion costs associated with recreation visits, especially during the summer peak-period. Operating costs strictly related with outdoor recreation are an almost residual fraction of the total conservation management costs and they are covered in part by revenue generated by the sale of some few recreation services like rural lodging. In short it can be concluded that although the amount of recreation supply total costs of the National Park is unknown, there are however sufficient evidence to say that on peak-period the marginal cost of supplying the park for recreation purposes is almost equal to congestion and environmental depletion costs. During non-peak period marginal recreation costs are almost null. Hence some demand rationing is necessary because there is a limit capacity of use of the park and an admission fee may be charged during the on-peak period, till the moment visitors are almost few for imposing congestion costs. Still park managers did not define yet the limit over which a marginal visitor will turn positive marginal recreation costs. Under these circumstances the only way to estimate a fee is to set it equal to the marginal net benefit of a recreation visit. This fee may not be economically efficient and revenue may not cover entirely the costs strictly related with the visits but it will be fair from the social point of view. Congestion costs arising from recreation visits will be internalise at least in part and visitors will have some incentive to think a little bit more about their true net benefit of visiting the park for recreation purposes.
The Model
To calculate the PGNP fee we based on a theoretical individual approach of TCM that assumes that individuals visit the park because they have the perception of he/she
ecological and anthropological rarity and so they want to enjoy them McCollum 1987). Using this information they decide to spend time and money to reach the site. Once the site is reached they produce several recreation activities by combining market goods, environmental amenities, and on-site time. Hence, assuming that visitors will attempt to maximise utility, the utility function is solved subject to the production function and the full income and time constraints. The utility that visitor i
has during a certain period of time is therefore given by the function
where RP is a composite recreation good that quantifies the recreation services that the individual produce in the park. These recreation services may be camping, sight seeing, hiking and other outdoor recreation activities. x is a composite good of all the other final goods
(
)
U U RP, x=
12. RP and x are produced with the following production functions:
(
)
= 1 V e 1 1
RP f V,x ,T ,T ,CP ,Q ; x g x ,T ,CP=
(
2 x 2)
where V is the number of visits to the park necessary to produce RP that maximises the utility. x and are public and private goods necessary to produce RP and x
respectively. and represent the time spend on producing the desired quantity
of RP and x. and represent the personal characteristics of the visitors which
are used in the production of RP and x (e. g. level of education, personal income and others). And Q represents the ecological quality of the site, and is assumed to be exogenous. The income and time constraints of the problem are given by
1 x2 e V T ,T 1 CP x T 2 CP + = + + l K 1 1 2 wT Y Vcd p x p x2
)
and respectively, where c is
the trip cost per kilometre , d is the distance since the visitor’s origin till the site, p
(
= +l x + V + e
T T T V T T
1
and p2 are the market prices, w is the wage rate, Tl is the time the visitor spend on
12 In TCM approaches it is usual to assume that RP and x are weakly separable. It is also assumed that the utility of
the recreation activities is additive and separable. The same assumption is made regarding recreation activities in the park and other recreation activities.
working and YK is other incomes. T is the total time. Solving for V, x1, Te, x2 and Tl,
the first order conditions are:
( )
( )
(
)
( )
( )
( )
( )
( )
( )
∂ ∂ ∂ ∂ ∂ ∂ ∂ ∂ − λ∂ − λ − λ ∂ ∂ ∂ ∂ ∂ ∂ ∂ ∂ ∂ = = = + + ∂ ∂ − Ψ∂ ∂ ∂ ∂ = ∂ e 1 1 V e 1 2 2 2 U ... f ... U ... RP f ... RP U ... RP f ... RP Te T RP x x RP V V cd w T T p wV U ... x g ... x x x pWe easily see that the price of one visit to the protected area has two components. One is associated with the distance (cd) and the other with the cost of time [w(Tv + Te)]. The solution of the model is a marshallian demand function of the protected area
of the type V f T ,T ,cd,p ,CP ,Q=
(
V e 1 1)
.To calculate the gate fee to charge the visitors of the PGNP one have to estimate a similar marshallian recreation demand function.
Estimating the Fee
A perfect discriminating pricing like solution was adopted. Visitors will pay for a gate fee equal to their reservation price for the right of using the national park for recreation purposes. To know the visitor’s reservation price one have to estimate the demand recreation curve of the park as a function of that gate fee. Let V be the number of visits to the park of a representative visitor, measured in number of days spend on staying in the PGNP for recreation purposes. Let F be the entrance fee measured in euros per each day of use of the site. Let us assume there is a linear relationship between these two variables of the type V =V(F)=a−bF13. The inverse
of this function, say , gives the marginal reservation price, which is the maximum amount a representative visitor is willing to pay for the right of using the park for
1
V−
13 We are assuming V is an ordinary and normal good. That means V will decrease when the fee
recreation, per each day. Under a perfect discriminating price like solution the total revenues park managers may obtain from a representative visitor are given by the
integral , where F is the current entrance fee value paid by each
visitor and F is the maximum fee each visitor is willing to pay for the right of using the park on the first visit day.
dF ) F ( V Max F min F
∫
Max ) F ( V 0 min =One estimates by using a two-step individual Travel Cost Method (TCM)
approach based on individual observations (Bell and Leeworthy 1990). In this approach the net impact of travel cost is incorporated on total recreation costs. To do so, the quantity of recreation is measured in total days spent in the park (number of visits V) instead of number of visits (trips), which are independent of the length of stay. The number of days of visit varies not only with travel costs (including the opportunity time of travelling) but also with the on site stay costs (including the opportunity time cost of staying). By doing so one resolves one of the limitations of conventional zoned TCM14. Conventional zoned TCM assumes trips are homogeneous in terms of the length of stay. However, trips are non-homogeneous most of the times, as is the case of PGNP because visitors coming from substantially distances may spend more time on site then the others which are closer to it. This means that travel cost can have an opposite effect on the number and length of visits, from the one that is expected. Some authors criticised this on site cost based approach arguing that it is not really a TC’s one because the dependent variable V is “number of recreation days on site” instead of “number of visits” and because the authors used on site costs and not travel costs only (Shaw 1991). But others sustained that the approach is still valid as a travel cost one and might be called “On Site Travel Cost Method” (Hof and King 1992; Font 2000). One of the great advantages of this on site
travel cost method upon the zoned one is that it allows estimating recreation marginal benefits because the dependent variable (number of days) is homogeneous.
In the first step, a marshallian demand function for the park was estimated considering the entrance fee equal to zero (at current level):
(1) ) DP , PC , PCAY , CDR ( V Vi = i i i i
where CDR is the Cost (price) of a Day of Recreation in the park with a null entrance fee; PCAY is the Per Capita Available Income for recreation; PC is a vector of personal characteristics and DP is the degree of perception the ith visitor is suppose to have about the quality and environmental rarity of the PGNP. To specify the personnel characteristics we use the following variables: Time available for Recreation (TR), Age (ID), and Education (ED). CDR is a compounded variable formed by two types of recreation costs: travel cost, including the opportunity cost of time spent on the trip, and on site recreation cost including the opportunity cost of the time spent during the on site stay. It is assumed that V will decrease with the rise of the cost of a recreation day, but will increase with per capita income. It is also assumed that the greater the degree of environmental perception of the visitor the greater will be V. As for the variable PC, the sign of the variation of V will be dependent of the variable chosen for its specification: visits will vary positively with the time available to spend on recreation and level of education and negatively with the age of visiotrs.
A recreation demand curve for a null entrance fee (2) is estimated using the recreation demand function (1): (2) ) DP , PC , PCAY ; CDR ( V Vi = i i i i i
where Vi is dependent of the total recreation costs of a visit, ceteris paribus.
Finally, in the second step, a separate demand curve for the recreational use of the park (3) is derived from (2), by assuming successive increments in entrance fee (F), ceteris paribus: (3) ) F ( V Vi = i
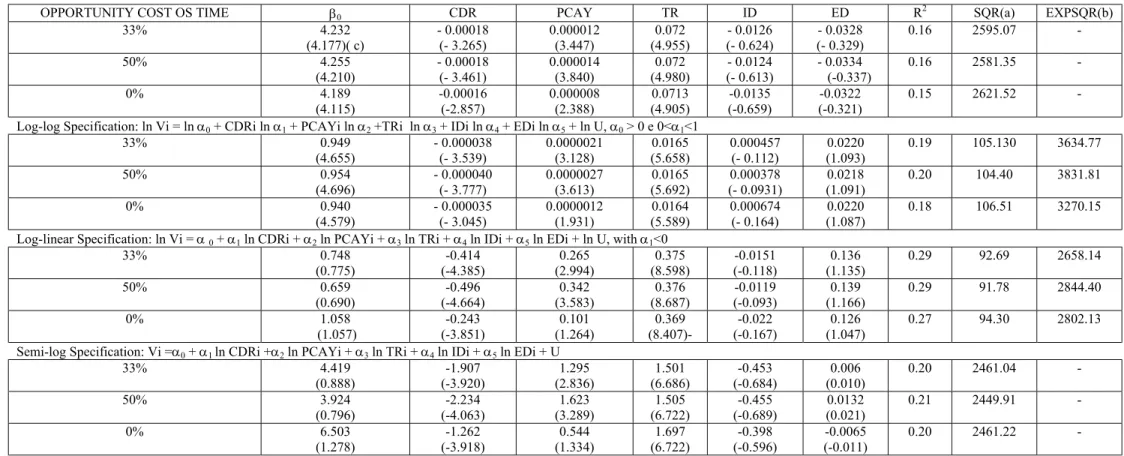
Some of the data used to quantify the recreation demand function variables15 were obtained through an inquiry by questionnaire, to a population composed of Portuguese citizens over-18th that visit the PGNP for periods greater then 24 hours. 1000 questionnaire were distributed during the peak – period months i. e. August and September. 243 had been correctly fill out which means the dimension of the sample is superior to the minimum limit that a sample may contain for recreation demand estimation purposes (Walsh 1986, Chapter 8). Regression analysis was used to test which of the four appropriate specification forms under the constraints of underlying demand theory, provided the best “fit” for the data. Minimum least-squares estimator was considered the more adequate to obtain unbiased parameter values for the variables of demand function. The choice of the estimator is dependent of the type of the questionnaire sample and of the research study’s object. The results are in Table 116. From the econometric point of view, the specifications used to explain visitor behaviour in terms of number of visitor days V and for the three types of opportunity cost of time spent on recreation proved to be relatively appropriated. Regarding the adequacy of the four specifications for the explanation of the individual’s behaviour in terms of V, and for the three valuations of recreation time costs, it is verified, invariably, that all explain the recreation demand better, when a larger opportunity cost of time is used. This conclusion is based on the analysis of the R2 statistic. For each specification, R2 is higher when time cost is set equal to 50% of the available
recreation income per capita. Though differences are not accentuated, on the contrary. Even if they were, that could not be interpreted in the sense of saying that one valuation’s time cost was more appropriate in relation to another. It would just mean that the specification with such recreation time approach explained the recreation demand behaviour better then the alternative ones. Be noticed that this conclusion contradicts, in a certain way, the general idea that when people are on vacation or on trip for recreational purposes, they are not aware of time as being a cost. But it goes, simultaneously, to the encounter of the conclusions obtained in several TCM’s approaches, according to which the cost of time is an important variable to explain the behaviour of demand recreation.
The coefficients of all the variables used in the four specifications of the demand recreation function are significantly different from zero to 1% (CDRi and TRi) and to 5%. This means that the variables contribute strongly to any explanation of the variation of Vi. The coefficient of the variable PCAYi is significant to 5% in half of the specifications. The relatively less safe results were obtained in the log-linear and semi-log specifications. Though, it will be of noticing that, the fact of the coefficients of PCAYi be significant, seems to contradict a certain tendency for the opposite, that it is verified in many TCM’s applications (McCollum 1987). Hence, one can conclude that the method one used to introduce the available income in the specifications was adequate. An exception is made for the variables Age and Education, whose coefficients are not significantly different from zero. This is explained, perhaps, by the fact that the sample’s dimension is not sufficiently high to incorporate the ID and ED variations as being significant for the V’s explanation.
16 For the estimation we considered three different values to measure the opportunity cost of time: 50%, 33%, and
The comparison among the four specifications can only be made using the statistics of the sum of the squares of the residues (one used transformed variables for the log-log and log-linear specifications). Then, by comparing the values of the columns SQR (Sum of the Squares of the Residues) for the linear and semi-log specifications with the values of the columns EXPSQR for the log-log and log-linear specifications, one conclude that the semi-log specification is the best to explain the behaviour of V. It is the one that presents the smallest value of EXPSQR. The log-log specification is the worse to explain V for the opposite reasons.
The analysis of the coefficient values of the log-linear specification is important, because they can be interpreted as measures of the relative variations of recreation demand (V) resulting from the relative variations of the independent variables. The analysis of the coefficient β1 is very important to the issue of this empirical approach,
because it is equal to the elasticity of recreation demand with respect to recreation price. Reading the results for β1 in the 3rd column of Table 1 for the log-linear we see
that a unit increase of CDRi, reduces the number of on site recreation days from 0.243 (minimum) to 0.496 (maximum) depending from the opportunity cost of time under consideration. Though price-demand of PGNP’s visitors is inelastic because it is inferior to one. However, the higher is the opportunity cost of time one considered the lower is the rigidity of the recreation demand with respect to the recreation price. The price-demand elasticity more than duplicates when one passes from a demand specification with no time costs, to another with time costs equal to 50% of the available recreation income per capita. β2 is the coefficient of PCAY variable and it is
equal to the elasticity of demand with respect to the available recreation per capita income. These values are very low which means that demand for V is not very sensible to income variations. As it already happens with price-demand elasticity,
income-demand elasticity doubles from the specification with no time costs to the specification with time costs equal to 50% of the available recreation income per capita.
All the coefficients have the expected sign to all specifications. CDR’s is negative, as expected, for all the specifications. Hence, recreation is an ordinary good. The PCAY’s is positive which means that V is a normal good. Furthermore, that of TRi is also positive; the greater the time available to spend on recreation, the greater the Vi demand. That of ID proved negative; the younger the visitor, the greater his or her preference for staying in the park. Finally, that of ED is positive revealing the existence of a direct relationship between the years of education and the days of stay in the protected area.
The White test shows the existence of heteroescedasticity in the specification for a α = 5% (which is normal for cross-section models). However the White estimator demonstrates this problem does not affect the conclusions of the model.
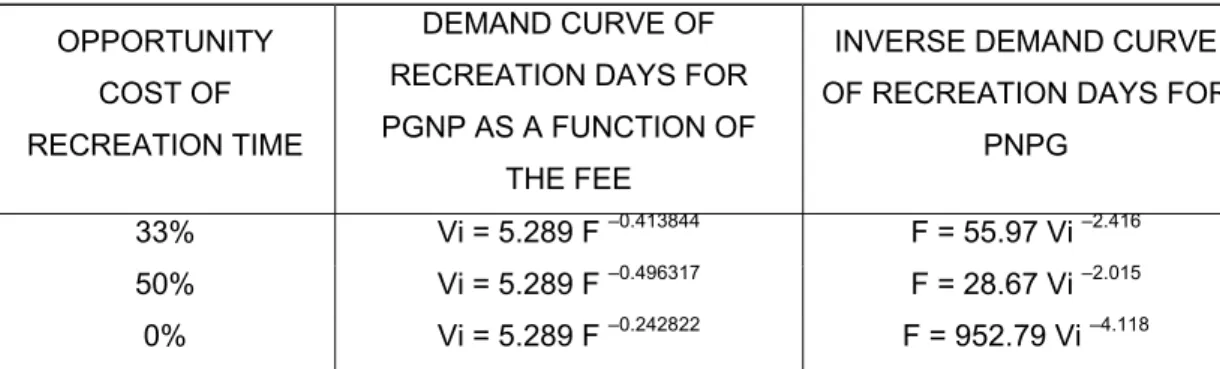
To estimate the recreation curve for a null fee and it’s inverse we choose the log-linear specification because econometrically it’s the best suited to our purposes (Bockstael and Strand 1987; Adamowicz et all 1989). The results are in Table 2. From the inverse demand recreation function in Table 2 gives the reservation prices17of the PGNP’s representative visitor, for a null gate fee can be estimated.
By using the results of Table 2 a separate demand recreation demand curve (V(F)) and its inverse are derived, assuming increases in the gate fee. As usual in the context of TCM approaches we assume V reacts to fee variations the same way he/she reacts to the variation of recreation costs. The results are in Table 3.
Conditions for Pricing PGNP
Existence of Positive But Unknown Marginal Recreation Costs
At least one of the two basic conditions for pricing the park efficiently exists i. e. the marginal recreation costs are positive due to congestion and environmental costs. If PGNP’s managers want to price recreation visits in some equity way they may charge visitors with a fee set equal to his/her reservation price (Table 4). Let us see an example. If the visitor has an opportunity cost of recreation time equal to zero, he will be willing to pay for the 1st day a fee equal to 6.20 €; for the 2nd day 0.36 €; 0.07 € for the 3rd day; and 0.02 € and 0.01 € respectively for the 4th and 5th days. The total paid by each visitor for the right of using the park for 5 days is 6.66 € i. e. 1.33 € per each day of visit. An easier way to calculate the fee per day would be to set it equal to the medium reservation price for a 5 days medium length visit i. e. 1.33 € per day. This method would be particularly convenient to put into practice, especially for those cases whose visit length is greater then 5 days.
The values of the gate fee are very dependent from the opportunity cost of time. If we compare the values of the fee calculated with no costs of time, with those with costs of time equal to 50% and 30% of the available recreation income per capita per day, we conclude that the amount decreases 2 278% and 1 288% respectively. Therefore we have to conclude that future investigation must be carried on to assess how far a recreation visitor has the perception of time spent on recreation as being a cost or not. One must notice that by the fact of setting the entrance fee equal to the visitor’s reservation prices per each day of visit, one does not guarantee that visitors will fully pay for congestion and environmental depletion costs. What is guaranteed is that visitor’s will pay a fee equal to his/her maximum willingness to pay for the right of using the park. Although Portugal is classified as a developed country his per capita
income is the lowest within the EU context. This implies that Portuguese willingness to pay for environmental improvement and amenities may be lower than that of EU’s, and marginal utility of income may be higher than that of EU’s18. Besides the income problem, congestion and environmental money costs are unknown. Hence one can only say that the total amount paid by the visitors in entrance fees will be a contribution to cover the real social costs. Park managers may use the financial resources generated by the fees to improve environmental conservation directly. Or they can use them as a direct and/or indirect financing stimuli to make residents to participate on the managing and improvement of park’s environmental quality. It is also expected that the fees will contribute to some demand rationing during on-peak period by incentive the ordinary visitors to look for other recreation activity. It is not expected that low- income groups like students will be negatively affect by the fact of being charged with a gate fee because income demand-elasticity is low and income spend on PGNP is a small fraction of the total per capita available recreation income of a representative visitor.
In order to price recreation under revenue and equity issues, the park managers should apply a differential system of entrance fees because of the special outdoor recreation demand characteristics. Because PGNP experiences uneven recreation demand, fees may be charged only during the peak-period, and set equal to zero the rest of the year because congestion and environmental depletion costs associated with the visits will be also zero19. This differential fee system will help to reduce biodiversity pressure
during peak-periods by a ration effect. Those visitors who do not feel the uniqueness of the park will not be willing to pay the fee and hence will be exclude. We do not
18 For details about introducing economic instruments in less developed countries see Panayotou 1998 and Russel
et all 1998.
19 This only stands within the current backdrop of non-existing additional costs related with recreation supply. If
the park managers will intend, in the future, to invest in better recreation conditions for amenities supply then this peak-period differential fee based system must be reviewed.
defend a differential entrance fee system based on cost sharing across different types of visitors. The main reason is because, in practice, it will be difficult to classify the groups of visitors and to explain to the different elements why they have to pay for different fees. Another reason is due to the small amounts to be paid. However, students could be charged with a lower fee as is commonly do in Portugal in other recreation activities like museums, musical shows, and others. And finally, a third reason is that the different recreation groups will always be better off if they pay a price for the supply of the right of using the park that they would have been without it being supplied.
Low cost price system to administer
This is the second basic condition to price the park efficiently. The PGNP’s managers intend to invest in a improving recreation programme of park’s recreation amenity based on the implementation of a system of Interpretation Centres (Projecto das Portas do Parque Nacional da Peneda-Gerês – Peneda-Gerês National Park’s Gates Project). The basic idea of the project is to create a system of infrastructures and of support structures (the so-called Gates) to the reception and visitors' selection, to the advertising of points of interest, to the accompanied and informed access to the interior of the park and to the execution of environmental education activities. Five Gates are proposed in the project and they will serve as access points of the park. Their geographical location will be in the sequence of the more important road accesses of the park. If this project will be concretise then the cost associated with the implementation and management of the price system will be almost residual. Besides, with the investment a new recreation supply cost fraction must be added to the current recreation supply total costs, and new fees have to be estimated. Under these
circumstances the fee may be set equal to the reservation price of the visitor accrued of a fraction related with the investment.
Conclusion
Current institutions, research, and legislation have not yet bee sufficient to achieve the conservation level of Nature required by welfare society. The relatively failure of command-and-control conservation instruments made several economists and biologists to recognise the urgent need of adopting alternative approaches to internalise the negative consequences arising from market failures related to the nature conservation.
In what he/she concerns the peculiar case of the protected areas, it has been a lot spoken the possibility to do the visitors to pay for the right of using the amenities of these sites for outdoors recreation. This interest exists because the sites have been experienced an excess of recreation demand, the underlying cause of congestion and environmental costs. If one joins to these costs the financial difficulties that the administrations of the protected areas traditionally struggle with, the result will be the growing difficulty in reaching the conservation objectives. From the economic point of view, to make individuals to pay for what they want to obtain is the most efficient way to internalise the negative externalities generated by the existence of market failures. Though the calculation of a recreation price to be compatible with the criterion of economic efficiency is only possible when that price is set equal to the marginal cost of a recreation visit. Geographic as well as administrative characteristics define the national park’s recreation total costs structure which is not always compatible with the calculation of an efficient price, i. e. a price set equal to the cost associated to the last visit. That will only be possible if the recreation marginal cost is positive and if the cost of implementation of the price system is not