AN ATLAS FOR THE FUTURE NATIONAL PARK
‘Las Cumbres de la Sierra de Guadarrama’
ii
AN ATLAS FOR THE FUTURE NATIONAL PARK
‘LAS
CUMBRES DE LA SIERRA DE GUADARRAMA
’
Dissertation supervised by
Roberto Henriques
PhD in Information Management
Instituto Superior de Estatística e Gestão de Informação(ISEGI) Universidade Nova de Lisboa (UNL)
Edzner Pebesma PhD in geosciences
Institute for Geoinformatics (IFGI) Westfälische Wilhelms Universitat-Münster
Joaquín Huerta PhD in Computer Science
Institute of new imaging technologies (INIT) Universitat Jaume I (UJI), Castellón
iii
Declaration of originality
This is to certify that the work is entirely my own and not of any other person, unless explicitly acknowledged (including citation of published and unpublished sources).
Date 20/03/2012
iv
ACKNOWLEDGMENTS
I wish to express my sincere thanks to all those who in one way or another have made possible the realization of this work.
I am grateful to the European Commission and the Erasmus Mundus Consortium (Westfälische Wilhelms-Universität Münster, Germany; Universitat Jaume I Castelló, Spain and Universidade Nova de Lisboa, Portugal) for giving me the opportunity to undertake this Master’s degree.
I want to express my gratitude to my supervisors, Prof. Dr. Roberto Henriques, and co-supervisors, for their comments and feedback, and to Prof. Dr. Marco Painho, director of the Master in Science of Geospatial Technologies, for his advice.
I would also like to thank the professors of ISEGI and IFGI and my colleagues for their contributions throughout the Master’s degree.
v
AN ATLAS FOR THE FUTURE NATIONAL PARK
‘LAS
CUMBRES DE LA SIERRA DE GUADARRAMA
’
ABSTRACT
This research aims to create a digital atlas for the future National Park of ‘Las
Cumbres de la Sierra de Guadarrama’ as a driving tool for knowledge and study of
the territory, using a methodology that integrates Information Technologies (IT) such as Geographic Information Systems (GIS) and Internet and the Web technologies, and providing access to geospatial information to the researchers, students and general public interested in the study of this protected area.
The greatest challenge is to develop a database, implemented in a GIS, which enables the integration and processing of large amount of geospatial data that cover the area of interest, allowing for the description of its features, defined by a series of core datasets: administrative boundaries, demography, topography, hydrography, climate, vegetation, geology, land uses, protected areas, urban areas and transport network. However, the heart of the creation of the Atlas is the design and production of the digital cartography, which is essential for the communication and for an effective perception of information.
The visualization of high quality maps, accompanied by text and photographs, through the creation of a digital Atlas embedded in a Web Site, is fundamental to ensure an optimum usability of available geographic information and plays an important role in the process of its dissemination, allowing the user to acquire a wide knowledge of the physical and human environment that characterize the National Park and its surroundings.
vi
UN ATLAS PARA EL FUTURO PARQUE NACIONAL
‘LAS
CUMBRES DE LA SIERRA DE GUADARRAMA
’
ABSTRACT (Spanish)
Esta investigación tiene como objetivo crear un atlas digital para el futuro Parque Nacional de ‘Las Cumbres de la Sierra de Guadarrama’, como una herramienta de guía para el conocimiento y estudio del territorio, utilizando una metodología que integre Tecnologías de la Información (TI), como los Sistemas de Información Geográfica (SIG) e Internet y las tecnologías Web, y proporcionado el acceso a la información geográfica a investigadores, estudiantes y al público interesado en el estudio de esta área protegida.
El mayor desafío es desarrollar una base de datos, implementada en un SIG, que posibilite la integración y procesamiento de gran cantidad de datos geoespaciales que cubren el área de interés, permitiendo la descripción de sus características, definidas por una serie de conjuntos de datos principales: límites administrativos, demografía, topografía, hidrografía, clima, vegetación, geología, usos del suelo, áreas protegidas, áreas urbanas y red de transportes. Sin embargo, el corazón de la creación del Atlas es el diseño y la producción de la cartografía digital, que es esencial para la comunicación y para una efectiva percepción de la información.
La visualización de los mapas de alta calidad, acompañados de texto y fotografías, mediante la creación de un Atlas digital embebido en un Sitio Web, es fundamental para garantizar un óptimo uso de la información geográfica disponible y juega un importante rol en su proceso de difusión, permitiendo al usuario adquirir un amplio conocimiento del medio físico y humano que caracteriza el Parque Nacional.
vii
KEYWORDS
Atlas
Geographical Information Systems
Geospatial Technologies
GIS Database
National Park
Website
KEYWORDS
(In Spanish)
Atlas
Sistemas de Información Geográfica
Tecnologías Geoespaciales
Base de datos SIG
Parque Nacional
viii
ACRONYMS
ASCII – American Standard Code for Information Interchange CORINE – Coordination of Information on the Environment CRS – Coordinate Reference System
DEM – Digital Elevation Model
ECW – Enhanced Compression Wavelet ED50– European Datum 1950
ESRI– Environmental Systems Research Institute ETRS89– European Terrestrial Reference System 1989 GI –Geographic Information
GIS– Geographic Information System HTML – Hypertext Markup Language IT – Information Technology
LIDAR– Light Detection and Ranging, Laser Scanning PNG– Portable Network Graphics
SDI– Spatial Data Infrastructure
UNESCO – United Nations Educational, Scientific and Cultural Organization UTM– Universal Transversal Mercator
ix
TABLE OF CONTENTS
ACKNOWLEDGMENTS ...iv
ABSTRACT ... v
ABSTRACT (Spanish) ...vi
KEYWORDS ... vii
ACRONYMS ... viii
TABLE OF CONTENTS ...ix
INDEX OF TABLES ...xi
INDEX OF FIGURES ... xii
1. INTRODUCTION ... 1
1.1 THEORETICAL FRAMEWORK ... 1
1.1.1 Geographic Information Systems (GIS) and Internet ... 1
1.1.2 Toward cartographic visualization: Atlas on the World Wide Web ... 3
1.1 OBJECTIVES ... 5
1.3 GENERAL METHODOLOGY ... 6
1.4 DISSERTATION ORGANIZATION ... 7
2. GEOGRAPHIC CONTEXT: STUDY AREA ... 9
3. AN UNDERLYING GIS DATABASE ... 12
3.1 OVERVIEW ... 12
3.2 SOFTWARE ... 13
3.3 GEODETIC DATUM, MAP PROJECTION AND SCALE ... 13
3.4 GIS DATA COLLECTION: GETTING THE DATA RIGHT ... 14
3.5.2 Sources and Responsible for the Information ... 14
3.5.3 Synthesis of Geographic Information ... 17
3.5 STRUCTURE OF GIS DATABASE: SPATIAL DATA AND ATTRIBUTES19 3.6 GENERATING NEW GEOINFORMATION ... 21
3.7 CORE DATASETS ... 24
4. CARTOGRAPHIC DESIGN: BASIS FOR THE MAPPING PREPARATION ... 26
4.1 TYPES OF MAPS AND SYMBOLOGY... 26
x
5. VISUALIZING THE GEOGRAPHIC INFORMATION: DESIGN AND
MAKING OF THE ATLAS OVER THE INTERNET ... 30
5.1 SOFTWARE ... 31
5.2 STRUCTURE OF THE ATLAS ... 31
5.3 LAYOUTS AND ELEMENTS... 31
6. THE ATLAS OF THE NATIONAL PARK ‘LAS CUMBRES DE LA SIERRA DE GUADARRAMA’ ... 34
6.1 PHYSICAL ENVIRONMENT ... 34
6.1.1 Topography and Refief ... 34
6.1.2 Hydrography ... 36
6.1.3 Climate ... 38
6.1.4 Vegetation ... 39
6.1.5 Geology ... 48
6.1.6 Land Uses ... 50
6.1.7 Protected Areas ... 53
6.2 HUMAN ENVIRONMENT ... 55
6.2.1 Demographic Characteristics ... 55
6.2.2 Urban Areas and Transport Network ... 57
7. CONCLUSIONS ... 60
BIBLIOGRAPHIC REFERENCES ... 61
ANNEXE 1: Description of different Types of Maps and Geospatial Data. ... 65
ANNEXE 2: Tables of Results. ... 70
xi
INDEX OF TABLES
Table 1. Areas cover by the National Park and its surroundings..………... 10
Table 2. Inventory of Geographic Information collected and integrated in the GIS
database……… 18
Table 3. Spatial layers, geometry of the spatial objects and their attributes……… 24
Table 4. Lettering for annotations on the maps……… 29
Table 5. Changes in land uses between 1990 and 2006………... 52
Table 6. Parameters that define the European Terrestrial Reference System 1989. 70
Table 7. Distribution of Heights in the National Park (NP) and the Peripheral
Protection Area (PPA)……….…. 70
Table 8. Distribution of Slopes in the National Park………... 70
Table 9. Distribution of Vegetation Types and Heights in the study area……….. 70
Table 10. Distribution of Habitats and Heights in the study area……… 71
Table 11. Distribution of Land Uses in the area………... 72
Table 12. Percentage of surface covers by other protected areas within the limits
of the National Park……….. 73
xii
INDEX OF FIGURES
Figure 1. Atlas building diagram………... 7
Figure 2. Situation map of the National Park between the provinces of Madrid and Segovia……….... 9
Figure 3. Map of Situation and limits of the National Park and its Peripheral Protection Area……….………. 10
Figure 4. Map of the Network of Spanish National Parks………. 11
Figure 5. Thematic layers - space as an indexing System………...……….. 12
Figure 6. Components of the digital spatial database………...………. 19
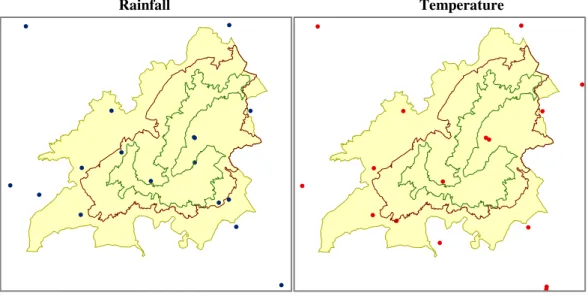
Figure 7. Situation Maps of Weather Stations from which are obtained rainfall and temperature data………..… 23
Figure 8. Grid Cells of National Cartographic Base (BCN25) at 1:25000 scale……… 23
Figure 9. Process of Cartographic Design and Production ………...………..….. 26
Figure 10. The digital production process of the Atlas……….. 30
Figure 11. User Interface of the Website………... 32
Figure 12. Map Gallery……….. 32
Figure 13. Photo Gallery……… 33
Figure 14. Slideshow on the Home Page………... 33
Figure 15. Topographic Map………. 34
Figure 16. Distribution Map of Heights………. 35
Figure 17. Slopes Map………... 36
Figure 18. Map of the Hydrographic Network……….. 37
Figure 19. Distribution Map of Annual Rainfall……… 38
Figure 20. Distribution Map of Average Annual Temperature…...……….. 39
xiii
Figure 22. Map of Vegetation Types………. 42
Figure 23. Map of Dominant Species or Formations………. 43
Figure 24. Map of the Vegetal Stratum……….. 44
Figure 25. Map of Agricultural Crops and Forest Lands ……...………... 45
Figure 26. Map of Dominant Forest Species or Formations………... 45
Figure 27. Dominant Forest Species and formations in the area………... 46
Figure 28. Map of Habitats……… 47
Figure 29. Map of the Conservation Status of Habitats………. 48
Figure 30. Map of Geological Units: age and type of rocky material…………... 49
Figure 31. Distribution of the main types of Geologic Materials in the study area... 50
Figure 32. Map of Land Uses………. 51
Figure 33. Maps of the Changes in the Land Uses between 1990 and 2006……. 52
Figure 34. Map of Protected Areas……… 53
Figure 35. Maps of the Nature 2000 Network: Site of Community Importance (SCI) and Special Protection Areas (SPAs)………... 54
Figure 36. Map of Municipalities……….. 55
Figure 37. Distribution Map of the Total Population………. 56
Figure 38. Population Density Map………... 57
Figure 39. Map of Urban Areas and Transport Network………... 58
Figure 40. Map of Urban Areas and Transport Network around the National Park……… 59
Figure 41. Location map of the National Park in Europe………..……… 74
1
1. INTRODUCTION
The creation of the Atlas is born with the idea of making known the natural values of the National Park ‘Las Cumbres de la Sierra de Guadarrama’ and its surroundings.
1.1 THEORETICAL FRAMEWORK
The natural environment is one of the main sources of wealth of a country, so proper management and conservation is essential to ensure quality of life and development of its people.
Protected Natural Areas have among their main objectives the conservation of the natural resources, favouring the socio-economic development of the territory, which is part of the enjoyment of their natural and landscape values by the society, and becoming a living observatory for research1.
Their statement ensures the conservation of the natural, cultural, landscape and scientific values recognized by society and supported on a legal norm. Thus, the National Park figure is defined in Law 5/2007, April 3 of the Network of National
Parks, as ‘the natural space of great ecological and cultural value, little changed from the exploitation or human activity, than in reason of the beauty of its
landscapes, the representativeness of its ecosystems or the uniqueness of its flora, its
fauna, its geology or geomorphological formations, has some ecological, landscape,
cultural and educational values prominent scientists whose conservation deserves
preferential treatment and is stated of general interest to the State’.
1.1.1 Geographic Information Systems (GIS) and Internet
The usage of the geospatial technologies enables the detailed study of the territory framed within the National Park and its surroundings. Geographic Information Systems (GIS), through the various tools available facilitate the integration and the analysis of large amounts of geospatial data and the creation of maps that describe and allow knowing the physical and human environment of this area.
1
2
Since Geographic Information Systems (GIS) were originated and developed between 1960s and 1970s, it has made enormous progress. In the 1980s, with advances in computer technology and the theory of spatial data processing and analysis, GIS enabled both computer cartography and spatial data analysis to be integrated within one same computational framework.
During the 1990s, the power of personal computers led GIS to becoming an application that could be implemented on a variety of platforms and operating systems. Both computer graphics and graphical user interfaces were greatly improved, and spatial database management systems were more robust and stable (Yang, C. et al, 2011).
Therefore, the development in various fields of computing has benefited GIS, thanks to the improvement of databases facilitating the management of vast amounts of information that is referenced to digital maps; computer graphics techniques that provide better data models for storage, retrieval and display of geographic objects; and advanced visualization techniques let us to create elegant representations of territory.
In the 1990s, the Internet and Web technology changed the GIS development allowing access geospatial information and resources through a Web browser.
3
‘The rapid evolution of information science and technologies not only enhance our
ability to collect, archive, and process spatial data more efficiently, but also to
generate and utilize geographic information and knowledge more efficiently than
what we could do in the past’ (Yang et al., 2011).
1.1.2 Toward cartographic visualization: Atlas on the World Wide Web
For centuries, the systematic and coherent collection of maps in book form, recognized as atlas, has allowed for the knowledge of a particular territory. The maps are models of the real world and the main method of identifying and representing the location of geographic features on the landscape.
Atlases are one of the better known cartographic products (Kraak, 2001) since the cartographer Gerhardus Mercator released ‘The World Atlas’ in 1595. They can be understood as a collection of maps with a specific purpose and organized in form of a book, which usually includes tables, graphs and text.
Alonso (1968) defined atlases as: ‘To the layman, any book consisting mainly of
maps is an atlas, but technically to the geographer, no cased collection of maps
deserves the name unless it be comprehensive in its field, systematically arranged,
authoritatively edited and presented in a unified format.’
Cartography, which is defined as the art and science of making maps, is thousands of years old. However in the last several decades has undergone enormous changes as a result of digital technologies.
The study of contemporary atlases involves two distinctive transitions: from paper to digital and from discrete to networked (Da Silva and Cartwright, 2006).
4
devices, especially computers, have gone from being a tool to a medium for cartography.
Siekierska and Taylor (1991) defined the digital atlas as: 'The electronic atlas is a
new form of cartographic presentation and can be defined as an atlas developed for
use primarily on electronic media'.
The rise of the Internet as a medium for cartography in the mid-nineties changed the way to produce and distribute atlases in digital format: from discrete storage (produced for distribution in floppy disks, CD-Rom or DVD) to the World Wide Web (WWW).
WWW, which was developed by Tim Berners-Lee in 1991, is a hypertext-based system that operates over the internet and constitutes a vast collection of electronic documents each one composed of a linked set of pages written in HTML language. The documents are stored in files on many thousands of computers that are distributed around the global Internet, allowing information to be disseminated with speed and accuracy.
Internet has become an important medium for dissemination of maps and geospatial data, allowing to an unlimited number of users the access to information anywhere at all times. Every day, millions of people access to Geographic Information (GI) via the Internet and millions of maps are exchanged every day on the Internet. GI accessible through the WWW, includes from maps that are read as a paper map to sophisticated applications that are used to build queries by submitting requests to the Web map services that are even capable of performing spatial analysis and processing.
5
"Digital Multimedia is considered to be any combination of two or more media,
represented in a digital form, sufficiently well integrated to be presented via single
interface, or manipulated by a single computer program." (Chapman et al., 2000).
Multimedia technology encompasses various types of data, such as text, graphics, hyperlinks, images, sound, digital and analogue video and animation; and presents them in an integrated form. The combination of several media often results in a powerful presentation of information and ideas to stimulate interest and enhance information retention.
1.1 OBJECTIVES
The main objective of this research is to create a digital Atlas for the future National Park of ‘Las Cumbres de la Sierra de Guadarrama’ as a driving tool for knowledge and study of the territory, providing access to geospatial information to researchers, students and general public interested in this protected area.
This main objective can be broken down into other, more specific, which express a higher level of detail:
To collect and systematize the necessary mapping information and determine the technical requirements leading to the design and creation of the Atlas.
To develop and manage a database, implemented in a GIS, that contains the spatial data required to identify the features of the territory, allowing for their processing and analysis and the generation of new information to prepare the digital cartography.
To represent the analysed geographic information, by the building of digital thematic cartography about the different elements that characterize the physical and human environment of the study area.
6
1.3 GENERAL METHODOLOGY
The following steps describe the proposed methodology for achieving each one of the mentioned objectives:
A. Collection and compilation of geographic information from different sources.
B. Selection and classification of acquired spatial information through the elaboration of an inventory.
C. Development and management of the GIS database, by the integration of spatial data obtained from existing data sources, and organization and structuration of GI highlighting core datasets that describe the features of the territory: administrative boundaries, topography, hydrography, climate, vegetation, geology, land uses, protected areas, demography, urban areas and transport network.
E. Exploration and analyses of the spatial information contained in the GIS database and generation of new information derived.
F. Building and design of thematic maps, representing of analysed geographic information and showing the physical and human environmental presence in the area.
7
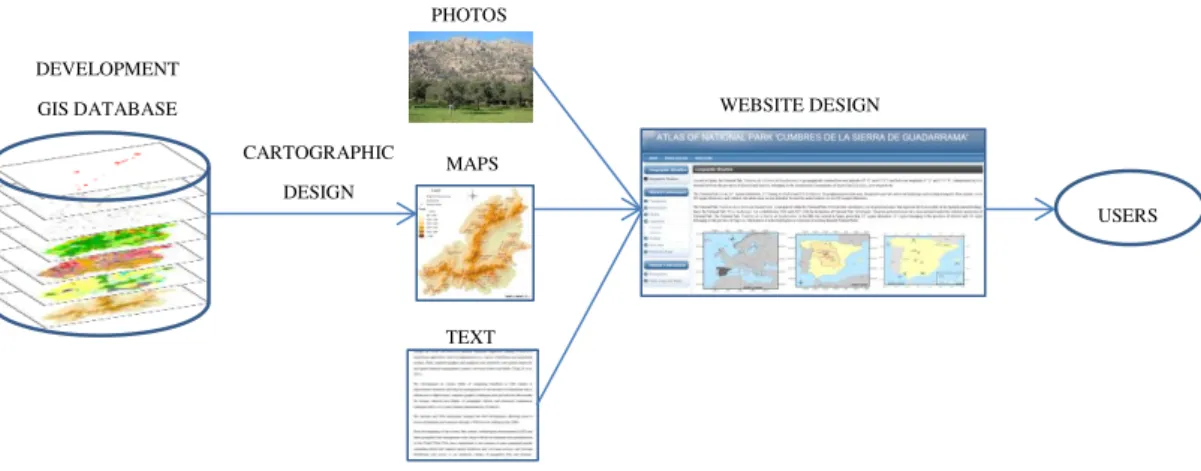
In the figure 1, the phases to the building of the Atlas are detailed:
Figure 1. Atlas Building Diagram.
1.4 DISSERTATION ORGANIZATION
This dissertation is organized into six chapters. The first two chapters cover the introductory content of the thesis. The objectives and the general methodology of the research, as well as the theoretical framework which is divided in two epigraphs:
‘Geographic Information System (GIS) and Internet’ and ‘Toward, cartographic
visualization: Atlas on the World Wide Web’; are described in the first chapter. In the second chapter, the study area is located geographically and administratively and framed within a geographic context at national level.
Creation of GIS Database and Analysis
Spatial Data Datasets
Attributes Statistical data
Selection, Acquisition and Storage of the Data
Data Display Spatial data Integration and
Management Spatial data
Collection
Building and design of Thematic Mapping
Definition and Structure of Contents
Organization and Structuration of GI
Graphs and Tables Data Exploration, Manipulation and
Processing Generation of derived GI
ATLAS USERS Design and creation of Website
8
Chapter 3 entitled ‘An underlying GIS database’ describes the procedures followed for the development of the GIS database and the processing and analysis of the geographic data contained therein. The foundation for the building of cartography and the design and making of the Atlas are described in Chapter 4 ‘Cartographic
design: Basis for the mapping preparation’ and Chapter 5 ‘Visualization the
geographic information: design and making of the Atlas over the Internet’.
The sixth chapter includes the content of the Atlas ‘The Atlas of the National Park
Las Cumbres de la Sierra de Guadarrama’, which is divided into two blocks:
9
2. GEOGRAPHIC CONTEXT: STUDY AREA
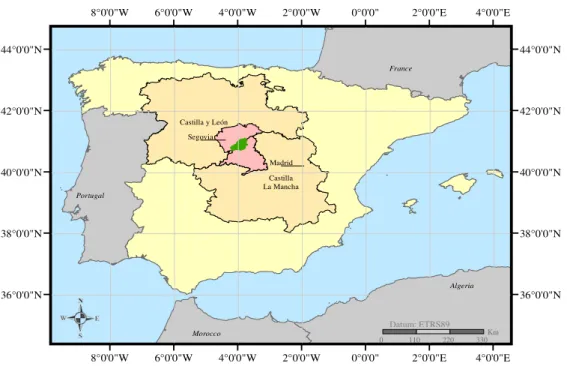
Located in Spain, the National Park ‘Las Cumbres de la Sierra de Guadarrama’ is
geographically situated between latitudes 40º 42’ and 41º 6’ N and between longitudes 4º 13’ and 3º 41’ W. Administratively, it is situated between the provinces
of Madrid and Segovia, belonging to the Autonomous Communities of Madrid and
Castilla y León respectively (figure 2).
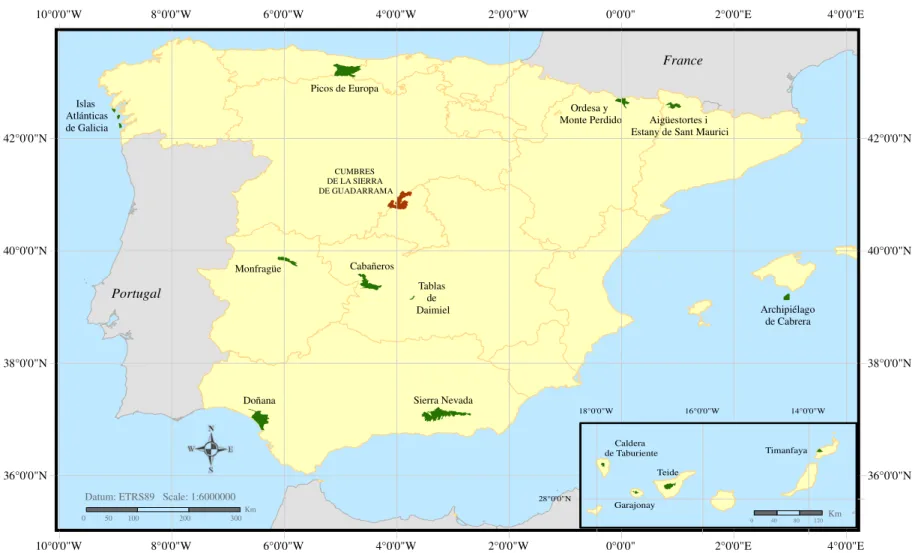
The National Park ‘Las Cumbres de la Sierra de Guadarrama’ is integrated within the National Parks Network that constitutes a set of protected areas that represent the best models of the Spanish natural heritage (figure 4). Since the National Park ‘Picos
de Europa’ was established in 1918, until 2007, with the declaration of National Park
‘Monfragüe’, fourteen protected areas have been declared under the statutory protection of National Park. The National Park ‘Las Cumbres de la Sierra de
Guadarrama’ is the fifth one created in Spain, protecting 337 square kilometres, 217 sq.km belonging to the province of Madrid and 120 sq.km belonging to the province
of Segovia, which places it in the fourth place in terms of extension of existing
Spanish National Parks.
Figure 2. Map of situation of the National Park between the provinces of Madrid and Segovia.
Castilla y León
10
Its Peripheral Protection Area, designed to prevent and avoid landscape and ecological impacts from outside2, covers 629 square kilometres, not including the urban areas. In total, the study area surface covers 966 squares kilometres (table 1 and figure 3).
Area (sq.km) Madrid Segovia Total
National Park 217 120 337
Peripheral Protection Area 300 329 629
Total 517 449 966
Table 1. Areas cover by the National Park and its surroundings.
Figure 3. Map of situation and limits of the National Park and its Peripheral Protection Area.
2
Law 9/1999, of May 26, Conservation of Nature.
3° 45' 0" W 3° 50' 0" W 3° 55' 0" W 4° 0' 0" W 4° 5' 0" W 4° 10' 0" W 41°5'0"N 41°0'0"N 40°55'0"N 40°50'0"N 40°45'0"N Legend
Limit of the National Park
Limit of the Peripheral Protection Area
Scale 1:300000
0 1,5 3 6 9 12 Km
11 Algeria
France
Portugal
Doñana Sierra Nevada
Picos de Europa
Cabañeros Monfragüe Ordesa y Monte Perdido Archipiélago de Cabrera Aigüestortes i
Estany de Sant Maurici Islas Atlánticas de Galicia Tablas de Daimiel CUMBRES
DE LA SIERRA DE GUADARRAMA 4°0'0"E 4°0'0"E 2°0'0"E 2°0'0"E 0°0'0" 0°0'0" 2°0'0"W 2°0'0"W 4°0'0"W 4°0'0"W 6°0'0"W 6°0'0"W 8°0'0"W 8°0'0"W 10°0'0"W 10°0'0"W 42°0'0"N 42°0'0"N 40°0'0"N 40°0'0"N 38°0'0"N 38°0'0"N 36°0'0"N 36°0'0"N
Figure 4. Map of the Network of Spanish National Parks.
Teide Timanfaya Garajonay Caldera de Taburiente 14°0'0"W 16°0'0"W 18°0'0"W 28°0'0"N
Datum: ETRS89 Scale: 1:6000000
0 50 100 200 300 Km
12
3. AN UNDERLYING GIS DATABASE
3.1 OVERVIEW
A Geographic Information System (GIS) is a computerized system designed to
deal with the collection, storage, manipulation, analysis, visualization and display of Geographic Information. Arnoff in 1989 defined GIS as ‘a computer based system
that provides four sets of capabilities to handle geo-referenced data: data input, data
management (data storage and retrieval), manipulation and analysis and data
output’.
Data that describe a part of the Earth’s surface or the features found thereon could be described as geographic or ‘spatial’ data (Guo, 2009). They are referenced to known
locations on the Earth’s surface, i.e. they are ‘georeferenced’ by a Coordinate Reference System (CRS).
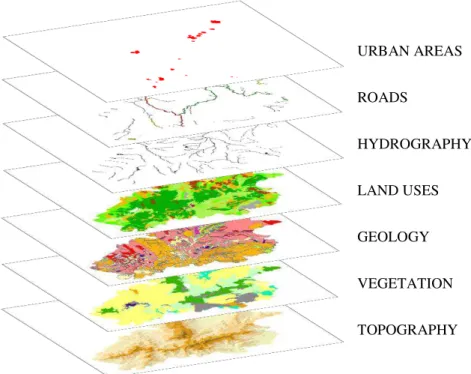
Geographic data are organized into different ‘thematic’ layers (figure 5), one for
each set of defined features or phenomena being recorded, making data management, manipulation and analysis more effective.
Figure 5. Thematic layers - space as an indexing System.
URBAN AREAS
ROADS
HYDROGRAPHY
LAND USES
GEOLOGY
VEGETATION
13
GIS database consists of a set of layers that provide the context for the creation of
the Atlas. It is a computer-based representation of the real world that contains information about the location of the objects and the characteristics thereof, leading to answers questions about where things are or about what is located at a given location.
The extensive GIS database created allows for the description of every feature of the territory included within the study area: topography, hydrography, climate, vegetation, geology, land uses, protected natural areas, demography, urban areas and transport network; by geographic data integration and processed using Geographic Information Systems (GIS).
3.2 SOFTWARE
The database has been implemented using the commercial software ARCGIS 10.00,
created by ESRI (Environmental Systems Research Institute), which consists of four applications (ArcCatalog, ArcMap, ArcScene and ArcGlobe), and which have the capabilities that are adapted to the demands of the research, considering, in particular: support for the formats in which information is presented, analytical skills appropriate to the aims pursued and appropriateness of graphical outputs of the system. It is used for treating digital spatial coverage, both vector and raster, although it was developed with a strong vectorial approach.
3.3 GEODETIC DATUM, MAP PROJECTION AND SCALE
The geodetic reference system employed for the representation of the territory is the
European Terrestrial Reference System 1989 (ETRS89) (table 2), which is the official system adopted in Spain for geographic referencing and mapping in the area of the Iberian Peninsula and Islas Baleares3.
The cartographic projection adopted is the Universal Transverse Mercator (UTM),
in which the earth is divided into 60 longitudinal zones called UTM zone, of 6°
3
14
longitude wide each, numbering from the 180º W meridian and increasing towards the 180º E meridian. The UTM zone for the National Park is the 30, located between the meridians 0º and 6º W.
The GIS database design, whose primary function is to manage and analyse the Core Datasets defined, is implemented to a sub-regional scale (target at 1: 250000 scale).
3.4 GIS DATA COLLECTION: GETTING THE DATA RIGHT
To obtain and acquire the geographic information required for the development of the GIS database and, consequently, for the creation of the Atlas, a large amount of existing digital maps and datasets have been identified, consulted, analysed and selected.
Digital maps have the advantage that they can be more easily manipulated and adapted for the purposes of mapping, and have increasingly become available from many sources.
3.5.2 Sources and Responsible for the Information
The creation of the GIS database is based on the conversion and integration of existing digital databases, such as digital maps in different exchange formats, which are openly available from a wide range of government agencies.
The digital cartography and geospatial datasets are obtained from the following government agencies (table 3):
Autonomous Agency of National Parks (OAPN), public entity under the Ministry of Agriculture, Food, and Environment (MAGRAMA). The dataset corresponding to the boundaries of the National Park and the Peripheral Protection Area has been obtained from this Agency.
15
- Natura 2000 is the European ecological network of conservation areas of biodiversity. The Habitats Directive 92/43/EEC requires all Member States of the European Union to deliver a National List of Sites of Community Importance (LICs) and Special Protection Areas for Birds (SPAs) to shape the Natura 2000 Network (point 4).
- Protected Natural Areas (PNA) dataset contain information about the areas included under one of the five legal protection status: Parks, Nature Reserves, Marine Protected Areas, Protected Landscapes and Natural Monuments; declared by the various Autonomous Communities under the Law 42/2007 of December 13, of Natural Heritage and Biodiversity (Before Law 4/89 of March 27, Conservation of Nature) (point 5).
- The Series Vegetation Map was developed by Salvador Rivas Martínez from the review of the Vegetation Map of Luis Ceballos (1941). This work was done by synthesis in 1981 and revised in 1987. It delimits the areas of the recognized series in a map at 1:400000 scale, in order to make known the great diversity of plant ecosystems of Spain (point 11).
- Andradre Allúe developed a phytoclimatic classification for Spain, the result of which was the characterization of 19 subtypes of vegetation, each one associated to specific climatic characteristics, which met into four types: Arid, Mediterranean, Nemoral and Oroborealioide (point 12).
- The Second National Forest Inventory (IFN2) is a project from the Forest Inventory Service developed between 1986 and 1996. It is part of the National Forest Inventory that reviews the status of national forest land every ten years (point 13).
- The Forest Map of Spain (MFE200) at 1:200000 scale was started in 1985. It contains more than 5,500 species including trees, shrubs and herbaceous plant and is the main layer to the representation of vegetation in Spain (point 14).
- The Inventory of Habitats of Community Interest is a dataset about habitats that was adapted to Spanish territory according to Annex I of Habitat Directive 92/43/EEC (point 15).
16
- It supplies information reflected in the GEODE Plan, which constitutes the support for the generation of a Continuous Geological Map at 1:50000 scale, using as the reference the National Geological Map (MAGNA) (point 16).
The Download National Center, belongs to the National Geographic Information Center (CNIG), an autonomous body of Spain belonging to the Central Government and established in 1989, under the Ministry of Development (MF) through the Directorate General of the National Geographic Institute of Spain (IGNE) (points 1, 8-10 and 17-19).
- The National Air Orthophotography Plan (PNOA) aims to obtain digital aerial orthophotos with 25 or 50 cm of resolution and high precision Digital Elevation Models (DEM) throughout the Spanish territory, with an update period of 2 or three years, depending on the area. Two of the products offered are Orthophoto Mosaics and Digital Terrain Models (DTM) with 5 m of resolution, created by interpolation from LIDAR data (points 8 and 19).
Project management is taken over by the Ministry of Development, through the Directorate General of the National Geographic Institute (IGN) and the National Centre for Geographic Information (CNIG).
- The National Cartographic Base (BCN200) is a set of geographic data obtained by scanning and digitizing of information originally contained in the series of provincial maps at 1:200000 scale, and subsequently enriched and updated by generalizing of the data contained into the National Cartographic Base at 1:25000 scale (BCN25). It conducted to support national projects like the National Geographic Information System (SIGNA) and Spatial Data Infrastructure of Spain (IDEE), and internationally as EuroRegionalMap (ERM) (point 9).
- Land Cover Map of Spain, corresponding to the CORINE Land Cover Project, includes versions 1990, 2000 and 2006. The CORINE Land Cover (CLC) has been the responsibility of the European Environment Agency (EEA) since 1995 and was founded with the objective of obtaining a European database of land use (point 17).
17
information about urban and interurban road network. It also incorporates urban maps and census information and post codes of all municipalities in Spain (point 18).
The website of the National Statistics Institute of Spain (INE), that provides the statistical data for the analysis of demographic characteristics.
Finally, State Weather Agency (AEMET), that provides climate data about temperature and rainfall.
3.5.3 Synthesis of Geographic Information
The collected geographic information and integrated in the GIS database is detailed in the inventory included in Table 2. This consist of the limits of the National Park and the Peripheral Protection Area; administrative boundaries (municipalities, provinces and autonomous regions) and livestock and agricultural regions; protected natural areas and areas belong to the Natura 2000 Network; Digital Terrain Model (DTM), contour lines and hydrography network; vegetation and habitats, forest and climatic regions; geology; land uses; urban areas; transport network; and finally, orthophotos.
18
Name Scope Scale/Res. CRS Geometry Type Extens. Date
Limit of the National Park Regional - ETRS89 Polygon Vectorial (.shp) Nov 2012 Limit of Peripheral Protection Zone of Park Regional - ETRS89 Polygon Vectorial (.shp) Nov 2012
ADMINISTRATIVE BOUNDARIES
1 Municipalities, Provinces and Autonomous Communities National 1:50000 ETRS89 Polygon Vectorial (.shp) March 2012 2 Livestock Regions/Agricultural Regions National 1:25000 ED50 Polygon Vectorial (.shp) 2011/ 2007 3 Database of Global Administrative Areas (GADMIN) World - WGS89 Polygon Vectorial (.shp) 2012
PROTECTED NATURAL AREAS
4 Natura 2000 Network: Special Protection Areas for birds (SPAs) and Sites of Community Interest (LICS) National 1:50000 ETRS89 Polygon Vectorial (.shp) Sept 2011
5 Protected Natural Areas of Spain: Parks, Nature Reserves, Natural Monuments, Protected Landscapes and other legal status. National 1:50000 ETRS89 Polygon Vectorial (.shp) Dec 2011 6 Spanish Inventory of Wetlands (IEZH) National 1:50000 ETRS89 Polygon Vectorial (.shp) April 2011 7 Biosphere Reserves (MaB) National 1:50000 ETRS89 Polygon Vectorial (.shp) 2009
RELIEF, TOPOGRAPHY, HIDROGRAPHY AND ROAD NETWORK
8 Digital Terrain Model (DTM) Lidar National 5 m ETRS89 Cell Raster (.asc) 2010 9 National Cartographic Base (BCN200 y BCN25) National 1:200000 1:50000 ETRS89 Point, Polyline Polygone Vectorial (.shp) July 2010 10 Grid cells of BCN25 National 1:50000 ETRS89 Polygone Vectorial (.shp) 2011
VEGETATION AND FOREST
11 Vegetation Map: Series and storeys of potential vegetation National 1:400000 ED50 Polygon Vectorial (.shp) 1987 12 Phytoclimatic Subregions National 1:1000000 ED50 Polygon Vectorial (.shp) 1990 13 Second National Forest Inventory (IFN2) National 1:50.000 ED50 Polygon Vectorial (.shp) 1986-1996 14 Forest Map of Spain (MFE200) National 1:200000 ED50 Polygon Vectorial (.shp) 1986-1997 15 Habitats National 1:50000 ED50 Polygon Vectorial (.shp) 1997
GEOLOGY
16 Continuous Geological Mapping (GEODE) National 1:50000 ED50 Polygon Vectorial (.shp) 2005-2011
LAND USES
17 Corine Land Cover 1990 (CLC90) and 2006 (CLC06) European 1:100000 ETRS89 Polygon Vectorial (.shp) 2006
URBAN AREAS
18 CARTOCIUDAD: urban and interurban road network National 1:25000 ETRS89 Polygon,Polyline Vectorial (.shp) 2009
ORTHOPHOTOS
19 Mosaic Orthophotos (PNOA) National 1:50000 ETRS89 Cell Raster (.ecw) Sept 2012
19
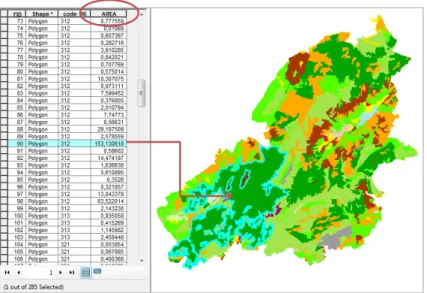
3.5 STRUCTURE OF GIS DATABASE: SPATIAL DATA AND ATTRIBUTES
Before starting the elaboration of the maps, it is necessary to design the structure of all core datasets with the purpose of determining how data are organized. Defining a clean database structure is not a trivial task. Within this framework, data are divided logically into two categories: geometric data and attribute data (Annexe 1). The GIS database stores both categories of data in a file in tabular form.
The GIS database consists, therefore, of the following components:
The spatial objects database, containing the entities;
And the geographic attributes table. This file contains one record and one unique identifier for each entity, and the alphanumeric data, such as the values of variables that they describe, like for example, the area measured in square kilometres.
The figure 6 illustrates how the spatial objects database and their attributes table are linked internally, representing a dataset. What makes GIS different from other kinds of computer systems is that these two kinds of information are always connected and are processed together.
20
Non-spatial attributes are input, by conversion from Microsoft Excel spread sheets (.xls) or other database format like Microsoft Office Access (.mdb), and linked the spatial data by means of joining operations through unique identifiers of spatial objects. It is the case, for example, of the attribute data that describes the demographic characteristics (total population and population density) or the climate (temperature and rainfall).
- Spatial Data and Geometry
The two fundamental ways of representing spatial information in the GIS database are vector and raster data model. The types of geometry adopted for representing the spatial objects that are utilized are described in the tables included into the Annexe 1.
The vector data model is used to symbolize discrete features, using a set of geometric primitives: points (e.g. points of interest), lines (e.g. roads, rivers or railways) and polygons (e.g. municipalities or land uses).
The raster data model is most often used to represent continuously varying phenomena such as elevation or temperatures. It divides space into a regular array of rows and columns and is represented by cells or grid, which are usually squares, aligned in rows and columns.
The data file formats are: shapefile is a vector data file from ESRI, ASCII is a text file for storing raster data and ECW is an image format optimized for aerial and satellite imagery from Intergraph company.
- Attributes and measurement scales
21
measurement scales are used to denote quantities, but in this case the intervals between the values are based on equal or regular units, as in the case of the intervals employed for representing the variables of temperature, height and population.
3.6 GENERATING NEW GEOINFORMATION
Accessing spatial data is the first step of geoinformation processing, and this process involves subsetting, that refers to the process of extracting datasets based on data request; processing, that refers to any intentional manipulation of datasets for specific applications; and visualization, that is the graphical representation of requested results, masking the complexity of spatial data, which involves the conversion of the data into visual representation (Yang, R., 2011).
The data management and integration involves the collection and acquisition data from multiples sources al different scales, allowing access to heterogeneous spatial datasets in customized formats and contents, for its processing and subsequent visualization.
The process of GIS database implementation and management begins with needs assessment, continues through data acquisition and processing, and ends with the data analysis and interpretation. That, along with the data visualization by the creation of the maps, will constitute the fundamental part to elaborate the content of the Atlas.
The following items are taken into account for the implementation of the GIS database:
• An inventory of existing data sources is compiled, in accordance with the priorities of implementation according to the purposes and objectives.
• Geospatial data are designed and organized by establishing structure within and among datasets that facilitate their storage, retrieval and manipulation.
• Development of procedures followed both for data acquisition through the
22
The development of the GIS database includes identifying the geographic data that are necessary to determine the environmental characteristics, setting limits of the study area and choosing the attributes for each feature.
GIS provides the tools to integrate large amounts of datasets, from a range of heterogeneous existing data sources, within a common reference framework that is defined by the geographic coordinate system. This allows for the combination of different data types, creating new information or executing complex queries that involve several data layers.
Management of the GIS database involves putting geospatial data into the same real-world coordinate system and joining the different coverage. Data from various sources are brought together into the common database, and re-projected from one mapping coordinate system into another for its integration using GIS software. Spatial data and associated attributes in the same coordinate system are viewed together and layered on top of each other to create maps.
The changes performed in the content of geographic data are: the modification, that includes the elimination of unneeded data and the addition of information content to raw data through analysis (e.g. reflect new subdivisions); extraction of data (e.g. create a new dataset as a subset of a larger dataset); and analysis of data (e.g. synthesize or abstract data to make it compatible with other datasets or integrate multiple datasets into a single dataset).
Using spatial analysis tools, the slope layer, the hillshading layer (azimuth 315 and elevation 45), and the flow direction to obtain the river basins layer are generated from DTM 5 m. Likewise, the reclassification is utilized to change the values of raster layers, for instance, in the case of distribution of heights, precipitation and temperature, which are subsequently converted to vector format.
23
averaging the values of sample data points in the neighbourhood of each processing cell, creating a continuous surface representation.
These are some geoprocessing tools are manipulated: extract (clip, in the case of vector data, or extraction by mask, in case of raster data), e.g. to extract data of the study area; overlay (erase), e.g. to obtain the urban areas and the main roads outside the area of National Park; merge, e.g. to join data presented in different sheets (figure 8); and dissolve, e.g. to the generalization of the data from different sheets by removing the grids.
Figure 7. Situation maps of weather stations from which are obtained rainfall and temperature data.
Figure 8. Grid Cells of National Cartographic Base (BCN25) at 1:25000 scale..
Rainfall Temperature 0508I 0509I 0483I 0484I 0508II 0483II 0483III 0457III 0484III 0458III 0483IV 0457IV
0508III 0508IV 0509III
24
In addition, other GIS capabilities are employed for the creation of the maps: spatial database query, by selecting features that match a set of criteria to obtain information about them; and database operations to extract summary statistics or cross tabulations from the geographic attribute table of a data set, allowing for instance, computing the total area of each land use category or calculating the minimum and maximum height of them.
3.7 CORE DATASETS
The core datasets are defined as the set of spatial information necessary for the support of natural environmental analysis (table 4). The ten core datasets identified and described are: (1) administrative boundaries, (2) demography, (3) topography, (4) hydrography, (5) climate, (6) vegetation, (7) geology, (8) land uses, (9) protected areas, (10) urban areas and (11) transport network.
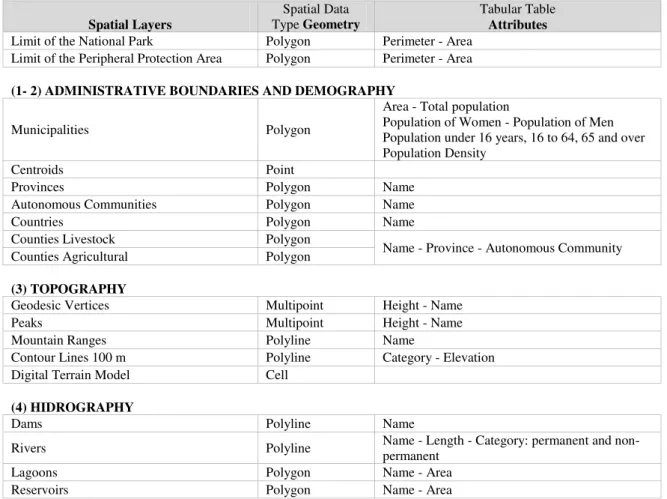
Table 3. Spatial layers, geometry of the spatial objects and their attributes.
Spatial Layers
Spatial Data Type Geometry
Tabular Table
Attributes
Limit of the National Park Polygon Perimeter - Area Limit of the Peripheral Protection Area Polygon Perimeter - Area
(1- 2) ADMINISTRATIVE BOUNDARIES AND DEMOGRAPHY
Municipalities Polygon
Area - Total population
Population of Women - Population of Men Population under 16 years, 16 to 64, 65 and over Population Density
Centroids Point
Provinces Polygon Name Autonomous Communities Polygon Name Countries Polygon Name Counties Livestock Polygon
Name - Province - Autonomous Community Counties Agricultural Polygon
(3) TOPOGRAPHY
Geodesic Vertices Multipoint Height - Name Peaks Multipoint Height - Name Mountain Ranges Polyline Name
Contour Lines 100 m Polyline Category - Elevation Digital Terrain Model Cell
(4) HIDROGRAPHY
Dams Polyline Name
Rivers Polyline Name - Length - Category: permanent and non-permanent Lagoons Polygon Name - Area
25 (5) CLIMATE
Weather Stations - temperature Point Name - average annual temperature Weather stations - rainfall Point Name - average annual rainfall
(6) VEGETATION
Phytoclimatic Region Polygon Type
Potential Vegetation - Altitudinal Zonation Polygon Type - Description Vegetal Stratum Polygon Type - Area - Percentage Vegetation Type Polygon Type - Area - Percentage Dominant Species or Formations Polygon Description - Area - Percentage Agricultural Crops and Uses Polygon Type - Area - Percentage Dominant Forest Species Polygon Description - Area - Percentage Habitats Polygon CODE - Type
Conservation status of the habitats Polygon Category
(7) GEOLOGY
Geology Polygon Age - Description - Area - Percentage
(8) LAND USES
Land Cover (CLC) 1990 Polygon Type - Area
Land Cover (CLC) 2006 Polygon Type - Area - Percentage
(9) PROTECTED AREAS
Protected Areas: parks Polygon Figure - Name - Area Special Protection Areas (SPAs) Polygon Name - Area Site of Community Importance (SCI) Polygon Name - Area Wetlands Polygon Name - Area Biosphere Reserve Polygon Name - Area
(10) BUILDING AND URBAN AREAS
Place of Interest Multipoint Type: Monument, Religious Building - Name Accommodation Multipoint Type: ski resort, camping area, mountain refuge - Name Mining Multipoint
Urban roads Polyline Type - Name
Villages Point Name
Blocks Polygon
(11) TRANSPORT NETWORK
Dual Carriageway Polyline Name Motorway Polyline Name National Highways Polyline Name
Regional Roads Polyline Category: 1st order, 2nd order, 3rd order - Name
Tracks Polyline
Railway Stations Multipoint Name Railway Line Polyline Name Line High Speed Rail Polyline Name
OTHERS
Orthophoto Cell
26
4. CARTOGRAPHIC DESIGN: BASIS FOR THE MAPPING
PREPARATION
After the GIS database is completed and the data are analysed, the next step is to create cartographic outputs. The geographic data, stored in layers inside the GIS database, are combined to make thematic maps which allowing the display of the spatial distribution of the attributes referred to specific geographic theme (Annexe 1).
The process of cartographic design and production is shown in the following graphic:
Figure 9. Process of Cartographic Design and Production.
The maps are a graphic representation of a portion of the territory on a two dimensional surface. They summarize large amounts of geographic information, communicating a message and getting the reader's attention.
The maps created here are made following the “Five Principles of Cartographic Design” proposed by British Cartographic Society’s Design Group in 1999:
Hierarchy with Harmony, Simplicity from Sacrifice, Maximum Information at Minimum Cost, Engage the Emotion to Engage the Understanding and Concept before Compilation. Every piece of work is checked to ensure that no errors appear in the final maps, hereby verifying way its quality.
4.1 TYPES OF MAPS AND SYMBOLOGY
The hillshade map is the base map for the cartography of the Atlas, which simulates the shadows that would be cast on the landscape.
Thematic maps can be divided in two groups:
Qualitative maps show the location or distribution of nominal data (e.g the
vegetation map, the geology map or the land uses map).
27 Quantitative maps show the variations or changing magnitudes of spatial
phenomenon in different places (e.g. the total population map or the height distribution map).
The total population and population density maps are choropleth maps, which use colours or patterns to represent the attributes associated with each municipality. This technique is employed for the representation of discrete nature data perfectly delimited. Darker colours represent higher data values and vice versa.
The isopleth maps generalize and simplify data with a continuous distribution: the rainfall map is an isohyets map which shows lines indicating places of equal rainfall; the temperature map is an isotherms map which shows lines that are formed by points of equal temperature; and the elevation map is a contour lines map that connect points of equal height on the earth's surface.
Quantitative symbology is employed for the classification of the attributes values, such as slope, temperature, rainfall, population and population density, into interval categories using manual techniques.
4.2 MAP ELEMENTS AND COMPOSITION
The maps are designed and built taking into account the harmonious integrating its elements, colours and typography. The unambiguity of the symbols and the highlighting of the most relevant information facilitate readability and its understanding.
The data frame, in the most cases, has the following characteristics: 18 cm width and 17,6 cm height. The space is subdivided reasonably and the various map elements (scale bar, north arrow and legend) are positioned and aligned considering the proportion between them, to generate a good visual balance according to the design criteria.
ESRI NORTH is the type of North Arrow preferred to be displayed in
the map, with 60 pts. size, Times New Roman font, Gray 70% colour
28
The scale preferred to the representation of the most maps, expressed as ratio, is 1:250000, what means that each centimetre on the map represents 2,5 kilometres in the real world. The scale bar has the advantage of remaining accurate regardless of
map enlargement or reduction.
Number of divisions: 4 / Number of subdivisions: 0 Units: Km - label Position: after bar – Gap: 2,8pt
Number: above the bar – Gap: 2pt Text: Times New Romans 8 – Color: Gray 70%
Bar: Color: Gray 50% Size .– 5pt Size: Width: 4,1cm – Height: 0,6cm
Position: x:15,64cm – y:0,92 cm
The legend is the key identifier, whose features are represented on a map to help the
user understand the information at hand with direct use of symbols as explanations.
The data are classified and represented using graphic symbols that enables the map
reader to interpret the real-world objects, which are referred by points (e.g. points of interest), lines (e.g. roads, railways, rivers and contour lines), areas (urban areas and vegetation type) and surfaces (e.g. temperature distribution). The way in which they are represented was explored in 1967 by Bertin, who established the following visual variables used to provide a palette from which to represent perceived differences on a map: size, value, colour, orientation, shape, texture and position.
To fully understand the cartographic symbolization, one must realize the relationship among the fundamental types of geographic data, the measurement levels, the forms of cartographic symbolization, and the visual variables, or the graphic elements that make up a specific symbol (McMaster, R.B, 2001).
Lettering appears in the legend and labelling of the map (table 4). Characteristics such as font, size, style or colour are employed systematically to underscore kind and hierarchy of map objects.
With respect to the digital output, the maps are exported to a graphic file format PNG with 300 dpi of resolution for its distribution on the web site. Most computer systems admit 256 grades of colour in each of the red, green, and blue (RGB) additive colours, generating over 16 million possible colours.
0 1 2 4 6 8
29
Font (pts.) Size Style Alignment Color Legend
Title ‘Legend’ TNR 12 bold Center Black
Other titles TNR 10 bold Left Black
Text TNR 10 normal Left Black
Numbers TNR 10 normal Left Black
Labelling
Provinces TNR 8 Underline Center Black
Autonomous Communities TNR 8 Normal Center Black
Countries TNR 8 Normal Center Black
National Parks TNR 12 Normal Center Black
Font (pts.) Size Style Alignment Color
Grid Cells Arial 10 Normal Center Black
Geodetic Vertices Arial 9 Itlalic Center Cherrywood Brown
Mountain Ranges TNR 12 Italic Center Dark Umber
Colour Lines Arial 8 Italic Center Dark Umber
Rivers Arial 8 Italic Center Ultra Blue
Lagoons Arial 8 Italic Center Dark Navy
Reservoirs Arial 8 Italic Center Dark Navy
Protected Areas TNR 8 Normal Center Black
Special Protection Areas (SPA) TNR 8 Normal Center Black
Sites of Community Importance (SCI) TNR 8 Normal Center Black
Municipalities TNR 9 Normal Center Black
- TNR: Times New Roman
30
5.
VISUALIZING
THE
GEOGRAPHIC
INFORMATION:
DESIGN AND MAKING OF THE ATLAS OVER THE
INTERNET
The digital Atlas of National Park ‘Las Cumbres de la Sierra de Guadarrama’ is the final outcome of a series of data processing steps, beginning with collection, through editing, management and analysis, and concluding with the creation of the maps. Each one of these activities transforms the available geographic information in the GIS database until the maps are in the appropriate form to display them on the screen computer. The digital maps, along with text and photographs, are the contents of the website that will be displayed by the readers. The figure 10 shows the digital production process of the Atlas.
Figure 10. The Digital Production Process of the Atlas.
The display of spatial information analysed is shown in the form of maps, which are published on the Internet by means of the design of an Atlas embedded in a website that is created in HTML (HyperText Markup Language) format, allowing the elaboration of multimedia documents with formatted text, images and tables.
The visualization of the Atlas through the World Wide Web (WWW) helps to facilitate the knowledge of this territory, showing each one of the elements that characterize the environmental and the natural values of the National Park and its surroundings.
CARTOGRAPHIC DESIGN
TEXT PHOTOS
WEBSITE DESIGN
USERS DEVELOPMENT
GIS DATABASE
31
The host name for the website of the digital Atlas of National Park ‘Las Cumbres de
la Sierra de Guadarrama’ is http://www.geomundo.es. The digital Atlas is
presented as a collection of maps accompanied by photographs and text, in a visually appealing and user-friendly interactive website.
5.1 SOFTWARE
The design and making of the website is performed with the open source software Joomla 1.5.5, which is a Content Management System (CMS). To the editing and retouching photographs, the software Adobe Photoshop CS5 is used.
The operation of the Internet is run by two major players, a server where data is stored and a customer who requests or uses that data. This interaction is known as client-server.
5.2 STRUCTURE OF THE ATLAS
The thematic content of Atlas is divided into three sections that describe the situation and the physical and human environment in the territory of the National Park ‘Las
Cumbres de la Sierra de Guadarrama’ and it surroundings: geographic situation,
physical environment and human environment. These are broken down into different themes: topography, hydrography, climate, vegetation, geology, land uses, protected areas, demography, and urban areas and roads.
5.3 LAYOUTS AND ELEMENTS
After an initial planning stage in which structure and content are specified, all atlas elements (maps, text and photographs) are combined to their inclusion onto the website.
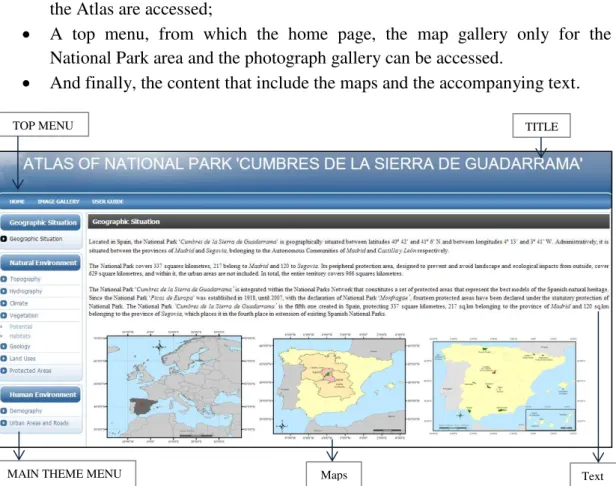
The user interface design of the website includes (figure 11):
At the top, the header containing the title: Atlas of National Park 'Las
Cumbres de la Sierra de Guadarrama’;
32 On the right, the main menu from which the various sections and themes of
the Atlas are accessed;
A top menu, from which the home page, the map gallery only for the National Park area and the photograph gallery can be accessed.
And finally, the content that include the maps and the accompanying text.
To open the map gallery, it is required click on them. This will open a viewer that lets display and explore the maps, and even enlarge (figure 12). Similarly, photo gallery can display the photographs by selecting the thumbnails (figure 13).
Maps Text
MAIN THEME MENU
TOP MENU TITLE
Figure 11. User Interface of the Website.
33 Figure 13. Photo Gallery.
The home page presents a slideshow, which let the transition of images with introductory text and the selection of the different themes of the Atlas by mean of links (figure 14).
34
6
. THE ATLAS OF THE NATIONAL PARK ‘
LAS CUMBRES DE
LA SIERRA DE GUADARRAMA
’
6.1 PHYSICAL ENVIRONMENT 6.1.1 Topography and Refief
Sierra de Cuadarrama is a mountain system that is part of the Central System,
natural division between north and south of the plateaus that form the centre of the Iberian Peninsula. It is constituted by two mountain ranges structured in two main axes:
The northern or Montes Carpetanos, oriented in direction SW-NE, in which highlights the peaks Peñalara (2428 m.) and Nevero (2209 m.);
And the southern, oriented in direction W-E, and divided into two sections:
- The stretch located at west of Bola del Mundo, comprising Mujer Muerta, whose highest peak is Oso (2196 m.), and Siete picos, whose peaks are aligned in form of arc and are one of the narrowest parts of Sierra de Guadarrama.
35
- And Cuerda Larga, situated between Bola del Mundo (2257 m.) and Najarra
(2104 m.), where highlights Cabeza de Hierro (2380 m.). It is characterized by gentle slopes and rounded morphology.
From this extended alignment emerge others mountain ranges, which present a lower elevation and different orientations, as Maliciosa, Porrones, Pedriza de
Manzanares, Morcuera and Cabrera.
The National Park is situated between 946 and 2427 meters. Practically, 85 per cent of this territory is located above 1500 meters, and nearly a quarter has slopes above 25 degrees, reaching in some areas to 79 degrees (figure 17). If the peripheral protection area is also analyzed, the whole territory is elevated to between 823 and 2427 meters, and the corresponding height distribution is as follows: 13% between 800 and 1200 meters, 38% between 1200 and 1500 meters, 30% between 1500 and 1800 meters, and 19% above 1800 meters (tables 7 and 8).
36 Figure 17. Slopes Map.
6.1.2 Hydrography
Sierra de Guadarrama is the dividing line between two of the major river basins of
the Iberian Peninsula: Duero, at the north, and Tajo, at south. The watershed coincides with the boundary of separation between the provinces of Madrid and
Segovia. Many rivers and streams flow through this territory, where numerous
natural springs are born.
Among the rivers of the northern slope, stands the Eresma River, which rises in
Valsaín Valley at the confluence of the streams flowing down from the slopes of
Peñalara, Siete Picos and Montón de Trigo. This river, alongside Moros River, is
37
Among the rivers of the southern slope, stands the Lozoya River, which in its upper course receives water from the streams coming from the massifs of Peñalara and
Cuerda Larga, originating from the wide Lozoya Valley, between the mountain
ranges Cuerda Larga and Montes Carpetanos, and whose flow is regulated by the reservoir of Pinilla. This river, alongside the Manzanares River, which rises on the southern slope of Cuerda Larga and is the main axe of the Regional Park Cuenca
Alta del Manzanares, and the Guadalix River, which rises in Sierra de la Morcuera,
are tributaries of Jarama River, tributary to the right of the Tajo.
Figure 18. Map of the Hydrographic Network.
38
6.1.3 Climate
The climate is Continental Mediterranean, with cold winters and summers with low water mark, and varies greatly depending on the height. The annual rainfall is between 363 and 1292 mm, and the average annual temperature is between 8 and 13 °C4.
Figure 19. Distribution map of Annual Rainfall.
4
39 Figure 20. Distribution map of Average Annual Temperature.
6.1.4 Vegetation
This Mediterranean region has different potential vegetal communities distributed in altitudinal zones. The potential vegetation are those 'stable vegetal communities that would exist if man action ceases to influence and alter ecosystems' (Rivas-Martinez, 1978).
- Cryoromediterranean (1300-2250 m.): Grassland (Festuca curvifolia);
- Oromediterranean (2000-2450 m.): Pine forest, broom and junipers (Juniperus
communis subsp. nana);
- Supramediterranean (900-2000 m.): Quercus pyrenaica forest, Quercus
faginea forest and Holm Oaks (Quercus ilex);