Filipa Duque Fragoso de Almeida Carvalho
Bachelor of ScienceConception of a Tissue Equivalent Plastic
Dosimeter Using Scintillating Fibres for Hadronic
Therapy and Space Radiation Effects Studies
Dissertation submitted in partial fulfillment of the requirements for the degree of
Master of Science in Biomedical Engineering
Adviser: Jorge Sampaio,
Auxiliary Professor, University of Lisbon Co-adviser: Sofia Pessanha,
Auxiliary Investigator, NOVA University of Lisbon
Examination Committee
Chairperson: Fátima Guerreiro da Silva Campos Raposo Raporteur: João Gentil Mendes Saraiva
Conception of a Tissue Equivalent Plastic Dosimeter Using Scintillating Fi-bres for Hadronic Therapy and Space Radiation Effects Studies
Copyright © Filipa Duque Fragoso de Almeida Carvalho, Faculty of Sciences and Tech-nology, NOVA University Lisbon.
The Faculty of Sciences and Technology and the NOVA University Lisbon have the right, perpetual and without geographical boundaries, to file and publish this dissertation through printed copies reproduced on paper or on digital form, or by any other means known or that may be invented, and to disseminate through scientific repositories and admit its copying and distribution for non-commercial, educational or research purposes, as long as credit is given to the author and editor.
This document was created using the (pdf)LATEX processor, based in the “novathesis” template[1], developed at the Dep. Informática of FCT-NOVA [2].
Ac k n o w l e d g e m e n t s
Firstly, I would like to thank my advisers, Jorge Sampaio and Sofia Pessanha, who were always available when I needed and who showed great competence in their work. I also want to thank professor Susana Sério for her availability and friendship. Secondly, I would like to thank FCT-NOVA for its friendly and welcoming environment, if I had the opportunity to go back, I would still pick this school as my second home. I would also like to show my appreciation to LIP, a group of creative and ambitious people who are always eager to involve younger generations in their work, a special thanks to João Gentil, professor Amélia Maio, Rute Pedro, Ricardo Gonçalo and Patrícia Muiño. I would like to thank BEST for taking me into this loving family and provide me with really useful social and technical tools for this new adventure I am about to head in. I will cherish every moment I spent in our organization.
I want to thank my family for going out of their way to give me the best medical support without which I probably could not have made it this far. Thanks for believing in my capabilities and for giving me all the tools necessary to conquer all obstacles. A very warm thought goes to my closest friends who were there for the good and the bad and who, in a way or the other, helped me become a better version of myself. Thank you André, Benny, Borrego, Borralho, Brandão, Cavaleiro, Cruz, Dino, Freire, Guga, Inês Dias, Linda, Pampi, Parada, Pestana, Rocha, Salles, Sérgio, Spínola, Sol, Ticas, Zagalo e Zanal. Finally, I would like to deeply thank my boyfriend, António, who not only is my companion, but also my best friend.
A b s t r a c t
Radiotherapy, and more specifically, proton therapy, presents a state-of-the-art treat-ment for many types of cancer. Although this relatively new approach to cancer treattreat-ment is enticing, it needs to be carefully monitored as it can result in unwanted severe side-effects. The control of the treatment depends on test phases, namely to determine the dose to be deposited at the site, as well as on equipment that monitors the particle beam during treatment, a beam profile monitor, which verifies the stability of the intensity and position of the beam, its range and its straggling effect. This work proposes using scin-tillating fibres in the assembly of an equipment that allows measurements both for dose determination, as well as for beam monitor profile aplications. Plastic fibres in dosimetry present many advantages such as that gas is not required, the scintillation decay time is typically on the order of a few nanoseconds, the tissue equivalent characteristics of plastic, the spatial granularity is proportional to the fibre diameter and the signal ampli-tude is proportional to the deposited energy in the fibres. Though this linearity does not happen near the Bragg peak due to quenching, a typical effect in scintillating materials. Another issue is the crosstalk effect between adjacent fibres.
Therefore this work is the beginning of a characterization study to learn about the fibre’s properties and evaluate their use in detectors for hadronic therapy and space effects studies. Given the complexity of the problem few results were obtained, nevertheless several iteration of Monte Carlo simulations are performed, we successfully measure the attenuation coefficient of the fibres as we also create a tray in order to quantify the crosstalk effect between adjacent fibres.
R e s u m o
A radioterapia, e mais concretamente, a prototerapia, apresenta-se como um trata-mento de tecnologia de ponta para muitos tipos de cancro. Embora esta relativamente nova abordagem ao tratamento oncológico seja atrativa, é necessária uma monotorização atenta, já que poderão ser induzidos efeitos secundários severos. O controle do tratamento depende de fases de teste, nomeadamente para determinar a dose a ser depositada no tumor, assim como de equipamento que monotorize o feixe de partículas durante o tra-tamento, designadamente um monitor de perfil de feixe, que verifica a estabilidade da intensidade e posição do feixe assim como o seu alcance e a sua dispersão. Este trabalho propõe a utilização de fibras cintilantes na construção de um equipamento que permita medições tanto para a determinação da dose depositada num alvo, assim como para apli-cações de monitor de perfil de feixe. As fibras de plástico em dosimetria demonstram ter inúmeras vantagens como, por exemplo, o facto de não ser necessário recorrer-se a um gás, o tempo de decaimento de produção de luz cintilante ser da ordem dos nano segundos, as características equivalentes de tecido do plástico, a granularidade espacial ser proporcional ao diâmetro da fibra e que a amplitude do sinal é proporcional à energia depositada nas fibras. No entanto, isto deixa de ser verdade perto do pico deBragg devido
aoquenching, um efeito típico em materiais cintilantes. Outro problema que se verifica
ainda é o efeito decrosstalk entre fibras adjacentes.
Este trabalho é o início de um estudo para caracterizar as propriedades de fibras cintilantes e avaliar o seu uso em detetores para estudos de terapia hadrónica e efeitos de radiação no espaço. Devido à complexidade do problema poucos resultados foram obtidos, no entanto neste trabalho são realizadas várias iterações de simulações de Monte Carlo, é medido com sucesso o coeficiente de atenuação das fibras assim como a criação de um tabuleiro a fim de quantificar o efeito decrosstalk entre fibras adjacentes.
C o n t e n t s
List of Figures xiii
List of Tables xv Glossary xvii Acronyms xix 1 Introduction 1 1.1 Context . . . 1 1.2 Historical Perspective . . . 2 1.3 Motivation . . . 3 1.4 Thesis Outline . . . 4 2 Background 7 2.1 Dosimetric Quantities. . . 7 2.1.1 Absorbed Dose . . . 7
2.1.2 Linear Energy Transfer . . . 7
2.2 Microdosimetric Quantities . . . 8
2.2.1 Specific Energy . . . 8
2.2.2 Lineal Energy . . . 9
2.3 Survival Curves . . . 10
2.4 Relative Biological Effectiveness . . . 11
2.5 Radiotherapy Principles . . . 12
2.5.1 External Beam Therapy . . . 12
2.6 Radiation in Space. . . 14
2.7 State-of-the-Art Microdosimeters . . . 15
2.7.1 Tissue Equivalent Plastic Scintillators . . . 16
2.7.2 Tissue Equivalent Proportional Counter . . . 17
2.7.3 Si-based Microdosimeters . . . 18
2.8 Silicon Photomultipliers . . . 20
2.9 Optical Fibres Overview . . . 20
C O N T E N T S
2.10.1 Light Attenuation Coefficient . . . 22
2.11 Crosstalk . . . 22
2.12 Quenching . . . 23
3 Methods & Materials 25 3.1 Scintillating Fibres . . . 25
3.2 Optical Fibres Support System for Output Readout . . . 26
3.3 Characterization Techniques . . . 27 3.3.1 Raman Spectroscopy . . . 27 3.3.2 Spectrophotometry . . . 30 3.4 Film Deposits . . . 30 3.4.1 Magnetron Sputtering . . . 30 3.4.2 Thermal Evaporation . . . 31 3.5 Simulations. . . 32
4 Results & Discussion 33 4.1 Fibres’ Composition . . . 33
4.2 Light Yield . . . 36
4.2.1 Linear Attenuation Coefficient. . . 37
4.3 Crosstalk . . . 38
4.3.1 Optical Fibres’ Tray . . . 38
4.3.2 Measurements . . . 41
4.4 Film Deposits . . . 42
4.4.1 Magnetron Sputtering . . . 42
4.4.2 Thermal Evaporation . . . 45
4.4.3 Depositions Discussion . . . 47
4.5 Simulations of the Optical Fibre Response . . . 47
5 Conclusions 53 5.1 Overview . . . 53
5.2 Summary and Future Work. . . 54
Bibliography 57
I Annex I Fibres’ Tray 63
L i s t o f F i g u r e s
1.1 Depth dose for different particles and for different energies in water [7]. . . . 3
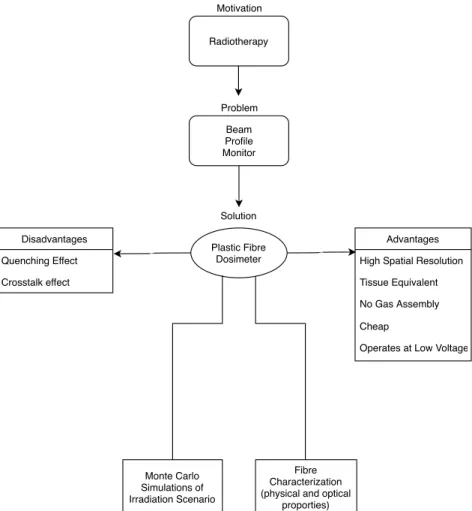
1.2 Diagram highlighting the advantages, disadvantages and methods for the so-lution of a plastic fibre dosimeter for the beam profile monitor problem in radiotherapy. . . 4
2.1 Representation of the comparative effects of low and high LET radiations in a population of cells [9]. . . 8
2.2 Cell survival curves as a function of the dose for different kind of particles and energies [18]. . . 10
2.3 Dose plotted over depth for an ion beam with different energies. A Spread out Bragg peak is created by having particles with varying range hitting our target. The integration of ions with different Bragg peak creates a plateau of maximum energy deposited [6]. . . 13
2.4 Set of picture of elements that may take part in radiotherapy treatment [31]. 14
2.5 Schematic representation of pencil beam treatment. The intensity can be var-ied from spot to spot, or continuously along the path [31]. . . 14
2.6 Detector system resulting from HIT research.The ribbons were 20 cm long
and the width covered by the photosensor was 51.2 mm [41]. . . 17
2.7 2D map of the median energy of charge collection in a SOI [11] . . . 19
2.8 Microdosimetric distributions yd(y) in silicon detectors from experimental
data, FLUKA and GEANT4 at different depths in Lucite [11]. . . 20
2.9 Percentage of the incident power absorbed (a) for an optical fibre in isolation (b) in the illuminated fibre, and (c) in the coupled fibre [56].. . . 23
2.10 Light signal measured with an organic scintillator detector. The dose and LET
were calculated using a Monte Carlo model [36]. . . 24
3.1 Representation of the cross section of the scintillating optical fibres used [53]. 25
3.2 Schematic representation of the transverse and longitudinal view of the fi-brometer [58]. . . 26
3.3 Schematic drawing of the aperture cone of an objective lens [61]. . . 28
3.4 Scheme of a confocal (a) and a conventional (b) microscope, coupled to a spec-trometer [61]. . . 29
L i s t o f F i g u r e s
4.1 Raman spectra obtained for the optical fibre and the slabs. . . 33
4.2 Plot of the signal intensity versus the Y position relative to the fibres’ tray. . 37
4.3 Signal intensity versus the fibres’ length. . . 37
4.4 Render of the tray with the support pieces. . . 38
4.5 Schematic representation of the N.A. and its possible influence in the crosstalk effect. . . 39
4.6 Zoomed in view of the tray.. . . 39
4.7 Set of figures of the LED support. This support fits into the red box from figure 4.4.. . . 40
4.8 Photograph of the experimental setup for the crosstalk measurements. . . . 40
4.9 Light output for each measurement. On the right: 1 fibre of 500 µm, between 56 and 60 cm and between 62 to 68 cm we have the signal for 10 fibres. Left: scintillating fibres of 1 mm, between 90 and 95 and between 97 to 103 cm we have the signal for 5 fibres. . . 41
4.10 Photograph of the experimental setup for the magnetron sputtering technique. On the left there is a PMMA slab, on the right, and centered with the elec-trodes, a Polystyrene slab. . . 43
4.11 Transmittance curves of PMMA and PS slabs. . . 44
4.12 Transmittance curves for PS slabs in different conditions. . . 44
4.13 Transmittance curves for PMMA slabs in different conditions. . . 45
4.14 Photographs of the tape used to remove the aluminium coating for different depositions. . . 46
4.15 Schematic representation of the setup in a second version of the Monte Carlo simulation for a beam of 250 MeV reduced to 200 MeV by a lucite range modulator. . . 48
4.16 Spread out Bragg peak simulated in a body of water with beams of energies 250, 200, 150, 100 and 50 MeV. A slab of lucite was added to the system to reduce the beam’s energy.. . . 49
4.17 Schematic representation of the optical fibres inside the water target on a version of the Monte Carlo simulation for a beam of 250 MeV reduced to 200 MeV by a lucite range modulator. . . 49
4.18 Set of graphs of the transverse dose profile for 200 MeV in the third simulation setup. . . 50
4.19 Distribution of the energy deposition for the third setup along the yOz plane. 51
4.20 Distribution of the energy deposition for the third setup along the xOz plane. 51
L i s t o f Ta b l e s
2.1 Physical parameters for polystyrene and water [36]. . . 16
3.1 Physical properties of the different constituents of the optical fibre [53]. . . . 26
4.1 Raman spectroscopy peaks in cm−1 for the scintillating fibre with an
ampli-ation of 10x and for a slab of polystyrene and the Raman bands according to the literature for PS [68]. . . 34
4.2 Raman spectroscopy peaks in cm−1for the fibre with an ampliation of 100x,
for a slab of PMMA with both ampliations of 10x and 100x and Raman bands according to the literature for polyvinylidene fluoride [68, 69]. . . 35
4.3 Measured intensity and wavelength using a spectrometer values for different LEDs illuminating the fibre perpendicularly in optimal current and voltage
parameters at approximately 12.5 cm from the light guide. . . 36
4.4 Results obtained from the exponential fit applied to each scintillating fibre,
their R2and attenuation coefficient with a RLS-UV385 LED with applied
ten-sion of 2.77 V. . . 37
4.5 Parameters during sputtering deposition. . . 43
4.6 Pressure, current and voltage parameters to deposit aluminium using thermal evaporation. . . 46
G l o s s a r y
δ-electron Electrons created during a ionization process with sufficient energy to
induce further ionizations.
Ionizing Radiation Ionizing radiation includes any electromagnetic or particle radiation with sufficient energy to ionize common molecules.
Phantom Models used to simulate complex systems, namely, organs of the human body. The most commonly used one is water, but other more complex phantoms can be used to obtain more accurate measurements.
Radiotherapy Radiotherapy is based on the ionizing property of radiation, and acts by killing the tumoral cells and halting their ability to reproduce.
Straggling Dispersion effect due to the media that surrounds the beam or particle. Wall Effect Distortions in measurements given by the difference in density between the detector boundary. The most common is the delta ray effect, which occurs when multiple delta rays enter the gas from the wall causing the detector to see multiple events rather than a single event.
Ac r o n y m s
CSDA Continuous Slowing Down Approximation.
GCR Galactic Cosmic Rays.
LET Linear Transfer of Energy. LINAC Linear Accelerator.
MOSFET Metal Oxide Semiconductor Field Effect Transistor. PMMA Polymethyl Methacrylate.
PMT Photomultiplier Tube. POM Polyoxymethylene. PS Polystyrene.
PSD Plastic Scintillating Dosimeters. PT Proton Therapy.
RBE Relative Biological Effectiveness. RT Radiotherapy.
SFOD Scintillating Fiber–Optic Dosimeter. SiPM Silicon Photomultipliers.
SOBP Spread Out Bragg Peak. SOI Silicon on Insulator. SV Sensitive Volume.
TEPC Tissue Equivalent Proportional Counter. TEPS Tissue Equivalent Plastic Scintillator.
C
h
a
p
t
e
r
1
I n t r o d u c t i o n
1.1
Context
Dosimetry is an area of great interest given its range of applications in radiation dosime-try, radiation protection and radiation medicine, both in diagnostic and radiotherapy (RT). Radiation dosimetry is the measurement, calculation and assessment of the ioniz-ing radiation dose absorbed by matter [1], where dose is a quantity that quantifies the energy absorbed by matter. Dosimeters are the apparatus conceived to measure the ab-sorbed dose. We could say this is the main field of Dosimetry, as radiation protection and radiation medicine are supported by radiation dosimetry developments.
As far as radiation protection goes, this area focuses on the assessment of radiation effects in living tissues and material components. The risk from carcinogenesis is the major concern, although mutations, and birth defects are also a concern. To ensure the safety of workers exposed to radiation on a daily basis and that of patients exposed to radiation, certain requirements should be met, namely the dose accuracy. For radiation workers or patients subjected to exams with low ionizing radiation, 50% for dose accuracy is widely accepted. In medical applications, such as RT, the accuracy should be greater than 5% [2]. Another important consideration is that there are certain tissues with higher sensitivity to radiation. For instance, the blood-forming cells in the bone marrow are most sensitive for the induction of leukemia [2]. A crucial study point in radiation protection is the shielding from dangerous radiations as well as material degradation over time.
In what concerns radiation medicine, dosimetry gives a quantitative correlation be-tween the radiation that is delivered and the respective biological response [3]. Inside radiation medicine we have treatment planning, medical imaging and treatment [3]. The applications in treatment planning include understanding what kind of treatment is most
C H A P T E R 1 . I N T R O D U C T I O N
appropriate given the type of tumor, its location and size, and by understanding the expo-sure of healthy tissues to radiation. In fact, today there are companies whose sole purpose is to optimize treatments mostly via through the development of software that simulates different types of treatment. Dosimetry during treatment is used to achieve and control the efficacy of therapeutic treatments [3]. It is estimated that about two-third of all cancer patients will be subjected to some form of RT [4].
1.2
Historical Perspective
The biological consequences of ionizing radiation were not recognized until X-rays were first man produced [2] in 1895 by Wilhelm Conrad Röntgen [4, 5] when he took the first X-ray image of his wife’s hand [5]. In the years that followed, several studies were conducted reporting the use of X-rays and radium in medicine [4]. However, very little was understood regarding the mechanisms inherent to the interaction between radiation and biological tissues.
An important mark in the radiological community was achieved in 1928 when the International Commission on Radiological Protection (ICRP) was founded to address the question of radiation protection [4]. From 1930 to 1950 there was a significant scientifical progress in radiotherapy. Brachytherapy was first introduced along with electron and proton beam therapy [4, 6]. In the beginning of the 1950s, intense cobalt-60 sources were widely used in external beam RT (teletherapy) machines, which produced a beam of gamma rays directed into the patient [7]. In the 1970s, these started to be replaced by medical linear accelerators (LINACs), which can produce a high energy electron beams or X-rays. Nowadays, most developed countries have abandoned the use of cobalt units and RT is done with LINACs.
The 1970s and 1980s were characterized by the introduction of proton therapy (PT). Even if their first clinical use dates back to 1954, it was only on the late seventies that proton beams were successfully applied to treat cancer [4]. Today there are over 75 particle therapy centers worldwide (including proton and carbon beams) and the number is increasing rapidly as PT is now a commercial off-the-shelf technology.
Some of the most important of these scientific developments has been the paradigm of fractionated dose delivery, where the treatment is done in several sessions of small doses (∼2 Gy) adding up to the desired dose and the of Intensity-Modulated Radiother-apy, where treatment is done with beams in multiple directions in the tumor volume. This only became possible due to the technological advances in X-ray production and delivery, the improvements in imaging and computer-based treatment planning and the develop-ment of models that predict how cancers behave and how they should be approached therapeutically [4].
Figure1.1compares dose in depth deposition for different particles and energies. The dose profile for photons is characterized by a rapid rise at superficial tissue layers (build-up region), followed by an exponential decay. This means that in-depth photon treatment
1 . 3 . M O T I VAT I O N
of tumors necessarily implies an overdose before and after the volume to be irradiated. However, in the last decade new techniques have been developed to significantly reduce overdose in photon treatment.
Figure 1.1: Depth dose for different particles and for different energies in water [7]. From a dosimetric point of view, the main advantage of using protons instead of photons in radiotherapy is shown in figure 1.1. The dose for massive charged particles is characterized by a growth in depth, ending at a very pronounced maximum, called the Bragg peak. By varying the beam energy, it is possible to position the Bragg peak at various depths and thus conform the highest dose to the tumor volume. However, since particle interactions with the medium are statistical, the energy lost and the number of collisions required to bring protons to rest varies slightly (i.e., some protons lose less energy and travel further than others). Hence, there will be a small variation in the range, known as straggling, which means that Bragg’s peak position has an associated uncertainty [8].
1.3
Motivation
The precise determination of proton range is currently a major challenge in PT, as a small variation in range means very high overdose beyond the tumor’s distal edge. The
C H A P T E R 1 . I N T R O D U C T I O N
main objective of this work is to study the possibility of developing a system based on scintillation optical fibres that allows dosimetry with sub-mm resolution. To this end, we studied:
• Physical and optical properties of scintillating optical fibres;
• Simulate irradiation scenarios to study the behaviour of the optical fibres in PT dosimetry;
• Study different coating methods and materials to maximize light trapping efficiency; • The design of a tray to quantify crosstalk effects between adjacent fibres.
Problem Motivation Solution Radiotherapy Beam Profile Monitor Disadvantages Quenching Effect Crosstalk effect Advantages High Spatial Resolution Tissue Equivalent No Gas Assembly Cheap
Operates at Low Voltage Plastic Fibre
Dosimeter
Fibre Characterization (physical and optical
proporties) Monte Carlo
Simulations of Irradiation Scenario
Figure 1.2: Diagram highlighting the advantages, disadvantages and methods for the solution of a plastic fibre dosimeter for the beam profile monitor problem in radiotherapy.
1.4
Thesis Outline
In the next chapter, there is a brief description of the dosimetric quantities, concepts and their relation to biological systems. The average concepts of dose and linear energy
1 . 4 . T H E S I S O U T L I N E
transfer do not describe accurately the stochastic effects of energy deposition at the micro-scopic scale. For this reason, we also introduce the relevant microdosimetric quantities that should be measured at this scale.
Further on, we describe the state-of-the-art microdosimeters. In particular, we de-scribe recent progresses made by a group in Heidelberg that is developing a PT tracking system similar to the dosimeter we want to develop. The chapter ends with a short overview of the physical properties that characterize the scintillating fibres.
Chapter 3 explains the methods materials used in this work and in Chapter 4 the results are presented. Future work and summary of the document is discussed in Chapter 5.
C
h
a
p
t
e
r
2
Ba c k g r o u n d
2.1
Dosimetric Quantities
2.1.1 Absorbed DoseDose (D) is the mean value of the imparted energy absorbed per unit mass at a point in a body and comes in units of J/kg or Gy (Gray). Since dose is a non-stochastic quantity, it can be defined as a point function in differential form [8]:
D = d ¯ε
dm (2.1)
Where d ¯ε is the mean energy imparted in a volume of mass dm. Taking in account
the time exposition to a given type of radiation an absorbed dose rate, ˙D, is defined as,
˙
D =dD
dt =
d2ε¯
dmdt (2.2)
2.1.2 Linear Energy Transfer
Linear Energy Transfer, LET, as defined by the International Commission on Radiation Units (ICRU), is a measure of the loss of energy due to electronic collisions per unit distance along the path of a charged particle (incident or secondary). The unrestricted LET (that includes the energy lost to high-energy δ-electrons) is identical to the electronic stopping power: LET = − dE dx ! e (2.3)
LET can be classified as being high or low. High LET (which ranges between 20 to 100 keV/µm) is usually produced by protons, alpha particles, and heavy ions [9], as they have
C H A P T E R 2 . BAC KG R O U N D
large masses and thus, the collision probability (cross section) is high. Therefore, these particles will be more easily stopped and will transfer a lot more energy on impact. Low LET particles (< 10 keV/µm) are, for example, beta and gamma radiation. Beta radiation is low LET because when compared to protons, the electrons have much smaller mass, thus resulting in a greater distance between ionizing collisions and a lower energy transfer. However in some cases, like low energy Auger emission, electrons can be considered high LET radiation because they have a very small range, rendering a high energy deposition per unit length [10]. In figure2.1it is possible to observe what was stated above regarding the difference in the travel distance between high and low LET radiation.
Figure 2.1: Representation of the comparative effects of low and high LET radiations in a population of cells [9].
2.2
Microdosimetric Quantities
It is through microdosimetry that we are able to study the impact of radiation at the micron scale. This has special interest to study the effect of radiation in cellular systems. This type of studies proves to be fundamental for radiation protection, as it helps to determine the probability of injury or lethality on living cells during radiotherapy [8,11].
Rossiet al. were the very first recognizing that there is a fundamental difference
be-tween macroscopic dose and the energy deposition in microscopic structures [12]. Since ionizing radiations interact in a discontinuous way with matter, dose and dose rate are statistical averages that disregard the inherent random behaviour of stochastic processes. Because of that, the knowledge of absorbed dose gives little information about the en-ergy deposited in cellular and sub cellular structures. As we increase the resolution, the fluctuations are more and more substantial, for both dose and for more densely ionizing radiations [12].
2.2.1 Specific Energy
Specific energy is the analogous to the absorbed dose in dosimetry and it comes in units of J/kg, or Gy. It is defined as quotient of ε by the volume mass m, where ε is the energy imparted by ionizing radiation in a single interaction,
2 . 2 . M I C R O D O S I M E T R I C Q UA N T I T I E S
z = ε
m (2.4)
Specific energy is a hard to compute quantity given that it is almost impractical to carry out the microscopic track structure simulation because of the computational-time limitation [13].
2.2.2 Lineal Energy
This quantity is the analog to the stochastic version of LET, and by definition it only takes into account the energy deposited by a single event. Lineal energy is commonly presented in units of keV/µm and is defined as the quotient of ε by ¯l, where ε is the energy imparted to matter in a volume by a single energy deposition event, and ¯l is the mean chord length in that volume [8,14].
y = ε
¯l (2.5)
The mean chord length in a convex volume is:
¯l =4V
S (2.6)
where V is the volume and S is the surface area of the target body.
The probability distribution of lineal energy (f (y)) and dose distribution (d(y)) are fundamental functions in microdosimetry. The relationship between f (y) and d(y) is:
d(y) =yf (y)
¯
yF
(2.7)
From this relationship we can see that higher lineal energies deposit a higher dose [14]. ¯
yF and ¯yD have the following averages defined as
¯ yF= Z ∞ 0 yf (y)dy (2.8) and ¯ yD = Z ∞ 0 yd(y)dy (2.9)
In which ¯yFis the frequency mean lineal energy, and ¯yDis the dose mean lineal energy.
The spectrum is traditionally displayed as a log–linear plot due to the wide range of lineal energy (from 0.01 to 103 keV/µm) [14]. One of the aims of this project is to design a system able to measure the d(y) and f(y) distributions.
C H A P T E R 2 . BAC KG R O U N D
2.3
Survival Curves
In the early study of radiotherapy, it was observed that the same dose of different radiation produced different biologic responses in the same tissue, as it’s possible to observe in figure 2.2. The survival curves depicts the relationship between the fraction of cells retaining their reproductive integrity and the absorbed dose of radiation. These are usually plotted on a logarithmic scale [8,14]. There are several factors that determine the behaviour of survival curves such as the radiation dose, number of dose fractions, this means giving smaller doses over a longer period of time, and the type of cells that are being irradiated, as well as the mitotic phase they are in [15–17]. Figure2.2shows the survival curves for different kind of particles and energies.
Figure 2.2: Cell survival curves as a function of the dose for different kind of particles and energies [18].
Several mathematical models were developed to describe the experimental data of the survival curves. High-LET radiation, like alpha-particles, produce a exponential decay of the survival fraction [19]. The most simple model is inactivation by single event, represented by a Poisson distribution [8,20]:
S(D) = e−αD (2.10)
Where S is the surviving fraction when the mean number of lethal events in cells caused per unit absorbed dose, D, is equal to α [8].
Low-LET radiation like X-ray exhibit a ’shoulder’ at low doses before the onset of the exponential decay. In this case, the most frequently used model to fit the data is the linear quadratic (LQ). This model only accounts for the damage imparted to the DNA molecule,
2 . 4 . R E L AT I V E B I O L O G I C A L E F F E C T I V E N E S S
especially the double stranded breaks, which are highly likely to induce death. We can consider two types of damage [8,19]:
• Type A: the ionizing particle breaks the two strands of DNA (double strand break) with only one collision.
• Type B: two different particles break each strand of DNA at close sites, and consid-ering that there was not enough time for the cell to recover from the first collision.
S(D) = e−αD−βD2 (2.11)
Where α is the constant that represents the probability of lethal damage due to dam-age of type A, and β the constant that represents the probability of lethal damdam-age by type B damage [19,21]. Within this interpretation, high-LET radiation produces only type A damages, since β = 0. Because LQ model needs only 2 [19,21] parameters to compute, it is easier to fit several different types of survival curves [20].
2.4
Relative Biological E
ffectiveness
The survival curves show that equal doses of different LET radiations do not produce the same biologic response [9]. This phenomenon is quantified by the Relative Biological Effectiveness (RBE), defined by,
RBE = Dose from 250 keV X-ray
Dose from test radiation !
same endpoint
(2.12)
Historically, the biological effectiveness of the beam is determined by the comparison with a 250 keV X-ray beam that was the primary radiation beam available in the early days of radiotherapy [9]. Depending on the study it is possible that another beam is used as a reference to determine the RBE. In order to obtain the values to compute the RBE using equation 2.12, it is necessary to irradiate cells and plot the survival curves, as a function of dose and compute RBE for the same endpoint. The endpoint could be, for instance, the dose at which half of the cells died.
The determination of RBE is a crucial step in clinical proton and heavy ions radiother-apy. Given the type of treatment, the RBE factor chosen depends mostly on the type of radiation to be used [22,23]. There have been several studies where it was observed that irradiating different types of cells with the same radiological source, refuted the assump-tion that all the same type of radiaassump-tions cause the same biological effect [22]. Most of the studies that study the RBE-LET relationship focus on the damage inflicted to DNA [21,
24,25] where it is unanimous the conclusion that there is a relationship in the induction of mutations with the type of LET. In one of these studies, it was observed that RBE values for induction of double strand breaks generally increase slightly with the LET (by a factor 2-3). This implies that at least part of the processes involved in the conversion of DNA
C H A P T E R 2 . BAC KG R O U N D
lesions to cellular effects could be dependent on LET [21]. Recent studies also suggest that the DNA damage induced by high-LET radiation is qualitatively different from that induced by low-LET radiations [24].
But there are some serious limitations in using this concept solely to explain biologi-cal effectiveness of radiation and the differences between types of radiation. It has been shown that there are two other major physical factors which can influence the surviv-ability of mammal cells: distribution of the dose in time (fractional dose irradiation) and the spatial distribution of energy deposition along the tracks of ionizing particles [4,
21]. Firstly, LET alone does not take into consideration variations in the track structure pattern of different ion species. For example, ions with high energy and high atomic number (HZE) produce considerably more δ-electrons than low energy and low atomic number ions (LZE) for the same LET [13,14]. Secondly LET does not assume variation through the site of interest [14, 26]. Finally, LET is a non-stochastic average quantity which means it does not account for the random fluctuations in energy deposition and range straggling [14].
2.5
Radiotherapy Principles
Radiotherapy is a type of cancer treatment that uses high doses of radiation to either dis-able the reproductive capability of cancer cells, or to kill them by permanently damaging the cells’ DNA [27]. This is achieved by ionization, the most important form of radiation interaction in RT [20].
There are two main types of radiotherapy, external beam and internal. Throughout this thesis we will mainly focus on external beam therapy.
2.5.1 External Beam Therapy
In this section only proton and ion beam therapy will be addressed, although electron and photon beam therapy are commonly used.
Proton and ion beam therapy are medical treatments built around an intrinsic prop-erty of these charged particles that has to do with the way they deposit their energy in matter. By plotting the energy deposition with depth, it is possible to identify a peak for which energy deposition has a maximum, the Bragg peak. The depth at which this peak occurs has to do with the initial energy of the particle and with the material the particle is traveling in. The particle range, R, measures the average distance the particles travel before stopping and deposit most of their energy. Range comes usually in units of g/cm2. By dividing the range by the density of the media, you get the average distance the particles travel before stopping and deposit most of their energy. NIST (National In-stitute of Standards and Technology) has available on their website a dataset with ranges of particles in function of their initial energy for several different materials [28,29].
2 . 5 . R A D I O T H E R A P Y P R I N C I P L E S
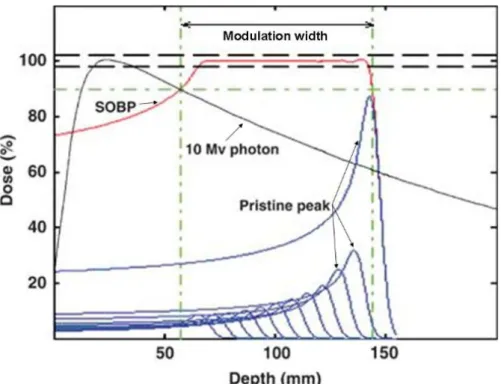
There are several techniques in external beam therapy used to scan all of the tumor volume with high accuracy in depth. For instance, you can create a spread out Bragg peak (SOBP) by varying the range and the fluence of the beam [6]. By combining multiple Bragg curves of particles with different ranges, the sum of those curves adds up to a plateau of high energy at a certain interval of depth. Figure 2.3illustrates the rational that was just explained.
Figure 2.3: Dose plotted over depth for an ion beam with different energies. A Spread out Bragg peak is created by having particles with varying range hitting our target. The integration of ions with different Bragg peak creates a plateau of maximum energy de-posited [6].
SOBP can be created by varying the energy of the beam. Range modulation can be achieved by 3 different ways: variable reach shifter [11], rotating modulator wheel [20] and weight optimization [30]. The most common method is to use the rotating modulator wheel. This wheel has angular segments of widths and thicknesses corresponding to the pullback and weight of individual Bragg peaks that comprise an SOBP (figure-2.4a) [20].
Another treatment technique is to create an aperture-compensator system which shapes the fields to a desired target profile using patient customized molds (figure2.4b). They are often made out of Brass since it offers the best choice in terms of cost, weight and production of secondary radiation [31].
Because protons can be deflected magnetically, another alternative is to generate a narrow mono-energetic “pencil” beam and control it magnetically across the target vol-ume. The depth scan is done by means of energy variation and it works as follows: One starts with the deepest layer, corresponding to the highest energy, and scans the plane.
C H A P T E R 2 . BAC KG R O U N D
(a) Photograph of a range shifter. (b) Photograph of the aperture-compensator sys-tem.
Figure 2.4: Set of picture of elements that may take part in radiotherapy treatment [31].
The energy is then reduced and so forth until all 20-30 layers have been delivered.
Figure 2.5: Schematic representation of pencil beam treatment. The intensity can be varied from spot to spot, or continuously along the path [31].
2.6
Radiation in Space
In space there are two main sources of radiation: the galactic cosmic rays (GCR) and the solar wind [32]. Additionally, solar particles are trapped in the Earth’s magnetic field producing the radiation belts around our planet known as the Van Allen belts. The interaction of the GCR with the upper atmosphere also produces showers of secondary radiation that reaches the ground. Space radiation and induced radiation in the atmo-sphere places not only astronauts but aviation crews as well at significant radiological risk. Not only is necessary to guarantee the safety of the astronauts and aviation crews,
2 . 7 . S TAT E - O F -T H E - A R T M I C R O D O S I M E T E R S
but it is also imperative to shield the electronics from radiation [33].
The main problem of space radiation is that unlike most of the natural and artificial radiation on the ground, which is constituted by photons and other low LET particles, the GCR and solar wind is made of high LET ions. The RBE of most of these ions is not well known and studying their biological effects is an important line of research nowa-days [34]. Also the microstructure of the energy deposition of the space radiation fields is an important issue in radiobiological studies with these ions. For these reasons there are several missions that include detectors to measure microdosimetric distributions. For example, the TEPC Environmental Monitor model was commissioned by NASA and used on the Mir Space Station, the Space Shuttle Discovery and other NASA spacecraft, and airplanes [35]. Currently there are mini-TEPC being tested in airplanes.
These are also possible future applications of the system we started to study in this work. However, this analysis was not developed in this thesis.
2.7
State-of-the-Art Microdosimeters
This section will cover the most commonly used detectors for dosimetry and microdosime-try and evaluate their advantages and disadvantages.
An ideal radiation detector should mimic as closely as possible the medium in which the absorbed dose will be measured. The charged particles crossing a detector will then interact in a manner similar to that within the medium [36]. Water and plastic are often the dose-absorbing medium of choice for phantoms used in dosimetry because for their similar composition to tissue. That is why for biological assessment the detectors are tissue equivalent.
There are certain characteristics that should be considered when creating a detector.
• Stability - Stability is the capability of the detector to reproduce the results with as little variation as possible [1, 36]. The longer the detector is able to preserve this capacity, the more stable it is. Radiation damage is an important aspect to consider for the stability of a dosimeter, especially when using plastic scintillators, as they quickly degrade with high-energy radiation and this can influence their ability to produce or transmit light, resulting in an overall loss of scintillating efficiency [36]. • Precision and Accuracy - Precision can be estimated from the data obtained in
repeated measurements and the overall precision is reflected on the standard devia-tion of the results. The accuracy of dosimeter measurements expresses the proxim-ity of their expectation value to the true value of the quantproxim-ity being measured.
• Dose rate proportionality - Ideally, the detector should be independent of the dose rate as well as the overall dose. A constant dose sensitivity throughout the range provides a linear response that is desirable for ease of calibration and interpreta-tion [36].
C H A P T E R 2 . BAC KG R O U N D
• Resolution - Depending on the purpose of the detector. Sometimes the objective is to accurately measure dose distributions, but there also could be the case where the goal is just to assess the overall macroscopic dose absorption.
• Temperature - Temperature dependence should always be considered, especially for detectors used forin vivo dosimetry.
• Pressure - Pressure dependency is relevant for detectors that rely on gaseous supply, for instance, ion chambers.
The value output given by a microdosimeter is calculated based on several corrections factors. For instance, Tissue Equivalent Porportional Counters (TEPC) need to consider wall effects, as well as volume recombination, which occurs when ions and electrons recombine on their way to the electrodes [1], and Tissue Equivalent Plastic Scintillators (TEPS) generally suffer a degradation over time [36,37] as mentioned previously as well as having a quenching effect associated.
2.7.1 Tissue Equivalent Plastic Scintillators
This type of detectors use materials that scintillate when radiation interacts with them. They are generally comprised of three main components: a detector probe, a light guide, and a photodetector [38], generally a photomultiplier (PMT). This is the kind of detector we aim to build during this work, where the scintillating material are the optical fibres.
Some of the advantages of using plastic scintillators as detectors for dosimetry are the intrinsic water equivalence properties of plastic polymers [39]. Furthermore, these detectors have been shown to accurately determining the absorbed dose and the dose distribution in a comparative study of small volume dosimeters [38]. In Table2.1 it is possible to see different physical parameters for polysterene, a material that is commonly used in scintillators. It is also the material of the core of the fibres used in this work.
Table 2.1: Physical parameters for polystyrene and water [36].
Parameters Polysterene Water
Density (g/cm3) 1.06 1.00
Ratio of number of e- in the
compound to molecular weight (Z/A) 0.5377 0.5551 Electron density (1023e-/g) 3.238 3.343
The Heidelberg Ionenstrahl Therapiezentrum (HIT) is developing a prototype plastic scintillating fibre microdosimeter with large similarities to the one intended to build in this work. The group built a detector system for beam monitoring, based on double cladding Kuraray SC-78 250 µm with a multilayer ribbon. The scintillating fibres were bonded with TiO2 epoxy in a single layer and the overall thickness of the fibres plus the TiO2 epoxy is approximately 1.2 mm. However, the authors claim that using two
layer scintillating fibre stationed with epoxy would contribute almost 60% more to water
2 . 7 . S TAT E - O F -T H E - A R T M I C R O D O S I M E T E R S
equivalent material than using the current system, based on multi-wire proportional counter beam monitor [40]. This increase on the water equivalent material is an unwanted effect, as it will increase the straggling and dispersion effects to the beam than what would be idealized. The system can be observed in figure2.6.
Figure 2.6: Detector system resulting from HIT research.The ribbons were 20 cm long and the width covered by the photosensor was 51.2 mm [41].
Scintillating Fibre–Optic Dosimeters (SFODs) present many advantages such as: mea-surement of the dose distribution with minimal perturbation, small sensitive volume, its robustness, that gas and high voltage are not required. The scintillation decay time is typ-ically on the order of a few nanoseconds and the spatial granularity is proportional to the fibre’s diameter, which can be as low as 0.25 mm for plastic fibres. The signal amplitude is proportional to the deposited energy in the fibre, though extensive research has shown this to be non-linear with increasing stopping power, dE/dx, for plastic scintillator [36,
40].
2.7.2 Tissue Equivalent Proportional Counter
The Tissue Equivalent Proportional Counter (TEPC) consists of a camera, generally a sphere or a cylinder, filled with a tissue equivalent gas [42] such as propane [43] or a mixture of methane, carbon dioxide and nitrogen [44], in which the variation of density is proportional to the energy radiation lost while traveling through the gas. The TEPC walls are made tissue equivalent to provide correct secondary particle spectra entering the gas.
C H A P T E R 2 . BAC KG R O U N D
For a tissue sphere of diameter dt, density ρt, and mass stopping power (S/ρ)t and
a gas sphere with parameters dg, ρg, and (S/ρ)g, the required condition of equivalent
energy loss is:
∆Et= (S/ρ)tρtdt = (S/ρ)gρgdg = ∆Eg (2.13)
where ∆Et and ∆Eg are the mean energy losses from the charged particle in tissue
and gas. The gas used must be also tissue equivalent. If the mass stopping powers are independent of density, then we have:
ρtdt = ρgdg (2.14)
By adjusting the gas pressure and therefore the gas’ density, it is possible to mimic the micron sized sensitive volume (SV) of tissue cell with a large gas volume [14].
Nevertheless, this type of detectors presents some disadvantages such as: having a large physical size and thus is only able to represent a unitary cell; it requires the supply of a gas, which can be expensive; requires a complicated correction process [45]. For instance, the wall effects which stem from the scattering of particles and production of secondary and tertiary particles lead to an increase in the energy imparted [37]. Finally they operate with high voltages, which can be dangerous [14].
In general, the proportional gas should not contain electronegative elements (i.e. oxy-gen) otherwise electrons heading towards the anode will combine with the gas [1, 44]. The gas in a proportional counter is usually a noble gas because it does not react chem-ically with the detector components. Of the noble gases, argon is the most widely used because of its low cost [44].
NASA developed a TEPC that is currently on-board the International Space Station (ISS) to characterize the radiation environment. This environment is characterized by mixed fields of high LET particles including protons and heavy ions. The purpose is to collect a record of the ISS environment to construct exposure history records for the crew. TEPC also provides near real-time measurements to ground personnel during radiation events as well as survey measurements in different parts of the ISS for shield verifications [43].
2.7.3 Si-based Microdosimeters
Si based microdosimeters rely on the use of a Metal Oxide Semiconductor Field Effect Transistor (MOSFET) which consists of three terminals: gate, source and drain. The source and drain terminals are made of a semiconductor, the gate terminal is made of metal and is detached from source and drain terminals using a metal oxide [46]. By applying a sufficiently high voltage to the gate, we are increasing the gap between the valence band and the Fermi level of the material, therefore current starts flowing, leading to the free movement of charges from the source to drain [36].
2 . 7 . S TAT E - O F -T H E - A R T M I C R O D O S I M E T E R S
MOSFET based detectors measure the change in the threshold voltage necessary for current to flow between the source and drain. The threshold voltage changes as free electrons and holes are produced by ionizing radiation within the oxide layer. The change in threshold voltage is proportional to the absorbed dose [36].
Among the advantages of Si-based microdosimeters we highlight its small physical size (2-10 µm) and consequently its extremely high spatial resolution of up to 10 µm, which allows measurements near the Bragg peak and provides detailed assessment of dose mean lineal energy with depth, no gas-flow ensemble, operating at low voltages (10 V), high sensitivity [47] and the ability to replicate an array of cells [14]. Some of the disadvantages of this type of device are its temperature and dose rate dependencies, which require careful calibrations in order to produce accurate measurements. They are highly radio-sensitive therefore their ability to function as a detector deteriorates with accumulated dose, which requires the detectors to be periodically replaced. Finally, MOSFETs also exhibit angular dependency, which can lead to measurement errors in cases where the incident beam angle changes in relation to the detector [36].
The Centre for Medical Radiation Physics (CMRP) at the University of Wollongong, has been studying the implementation of a solid state microdosimeter on a single sensi-tive volume using a reverse biased p–n junction of the source diode in the n-type MOSFET. The group developed 5 generations of Si-based microdosimeters and found that there was a good agreement between the data obtained with Silicon on Insulator (SOI) microdosime-ters and TEPC. SOI proved to be resistant even with high energy protons and ions [14]. In figure2.7we have an image of the median energy on each SV. It is possible to observe that most of the energy is deposited at the center.
Figure 2.7: 2D map of the median energy of charge collection in a SOI [11]
Gomézet al. have also been involved in the development of silicon dosimeters and
tested their efficiency by exposing it to an ion beam. The experimental results of lineal energy spectra were compared to those obtained through GEANT4 and FLUKA and the group found that there was excellent agreement between the experimental measurements and the simulations [11] as it is possible to see in figure2.8.
C H A P T E R 2 . BAC KG R O U N D
Figure 2.8: Microdosimetric distributions yd(y) in silicon detectors from experimental data, FLUKA and GEANT4 at different depths in Lucite [11]
2.8
Silicon Photomultipliers
Silicon photomultipliers (SiPMs) are cell-structured, photo-sensitive semiconductors that have been replacing conventional photomultiplier in multiple areas such as high-energy, astroparticle physics [48] and have several applications for biomedical devices [49,50].
SiPMs offer single-photon resolution allowing for a precise calibration of the incident light flux and have similar or higher photon detection efficiencies than conventional photomultiplier tubes (PMTs) [49]. In addition, they are tolerant against the exposure to bright light and offer a mechanically and optically robust design [48,50]
2.9
Optical Fibres Overview
Over the last years, most of the research done with regards to optical fibre-based dosime-try concerns low dose applications. This research field is now quickly expanding to different applications such as those associated with high energy physics facilities [51], radiation test facilities, monitoring of nuclear power plants and even space missions [52]. Plastic fibres are comprised of a core and a cladding or multiple cladding. Multi cladding fibres have higher light yield than single cladding fibres because of its larger trapping efficiency [53]. Amongst other purposes, the cladding allows total internal reflection since the refractive index (n1) of the core is larger than the index of the cladding
(n2) [36]. This process obeys to Snell’s law.
n1
n2 =
sinθ2
sinθ1 (2.15)
2 . 1 0 . F LU O R E S C E N C E L I G H T Y I E L D
This geometric property allows the imprisonment of light which can thus be trans-mitted over a substantial large distance. What’s more, the cladding is useful to protect the core from abrasion or accumulation of foreign material [36]. Finally, using a multi-cladding layer over just one helps enhancing the efficiency of total reflection inside the optical fibre [54].
Using optical fibres as detectors has many advantages over other types of detectors such as high spatial resolution due to the small diameter of the optical fibre [40], the signal amplitude is proportional to the deposited energy, though it has been shown to be non-linear with increasing stopping power [36,40]. Long-distant signal transmission and immunity to electromagnetic interference [45] (a characteristic especially useful in the medical environment) their robustness and flexibility.
2.10
Fluorescence Light Yield
When a scintillator is excited it emits light. This effect is called luminescence. There are several ways to excite a substance. For example, when it is excited with visible photons, it is called photoluminescence, whereas if it is excited by ionizing radiation, is called radioluminescence or scintillation [36].
The intensity of the signal n(t) in photons as a function of time for plastic scintillators is expressed as: n(t) = N τ − τR [e−τt −e −t τR] (2.16)
Where N are the photons that hit the scintillator, τR is the time necessary for the scintillator’s response reach its peak, which is of the order of 10−9s, and τ represents the signal falloff, typically of the order of 10−8
-10−9s [36].
Although most of the light reaching the light-measuring system is scintillating light, there is a portion of light which results from the stem effect within the optical fibre. The two main components causing the stem effect are fluorescence and Cerenkov radi-ation [36, 38]. While fluorescence is the property whereby a molecule or atom emits light with a higher wavelength than the one that caused the excitation [36,55], Cerenkov radiation is produced when a charged particle’s velocity exceeds the speed of light in a given medium [38]. Cerenkov radiation is generated at the core of the optical fibre, when the core has a refractive index greater than 1. Cerenkov is the main contributor to the stem effect in the fibre [36]. Since the plastic fibres are made of materials with low atomic number (Z), Cerenkov radiation is mainly produced by electrons through Compton interactions [36].
If irradiation conditions were always the same for every measurement, Cerenkov light would be a constant added to the output signal. Two different methods have been developed to filter Cerenkov induced noise. The first one relied on the use of two optical fibres. The first fibre would be of a scintillating material and second just a normal fibre.
C H A P T E R 2 . BAC KG R O U N D
By subtracting the signals, the Cerenkov would be successfully removed [36]. The second method depended on the use of filters. Since Cerenkov radiation is mostly emitted in the violet-blue region of the visible spectrum, several filter combinations were tested with a reduction of more than 50% of Cerenkov radiation [36].
From previous studies it is known that the signal produced from scintillation light rises linearly with both the radius and the length of the scintillator. However, increas-ing the size of a scintillator also increases the attenuation the light will undergo [38]. Therefore, there is always a trade-off between light production and attenuation.
2.10.1 Light Attenuation Coefficient
In a fibre-optic system there is a light attenuation factor which results in an optical power loss of the light that is propagated along the length of the fibre [36]. The attenuation coefficient of optical fibres has a logarithmic relationship with the power emitted, also known as Lambert-Beer law:
Pout Pin
= exp(−αL) (2.17)
The linear attenuation coefficient, α, is influenced by a number of factors. As a main intrinsic factor we have Rayleigh scattering. Rayleigh scattering is caused by nonunifor-mities in the optical fibre and is the most common form of scattering [36]. Attenuation is also dependent on the core diameter of the fibre. It increases with the decrease of the core diameter, light rays strike more frequently on the interface between the core and the cladding, and this gives rise to higher attenuation. The attenuation coefficient also varies with the wavelength of the source and core material of the optical fibre [36].
It is possible to determine the attenuation coefficient experimentally. By plotting the signal detected at the readout system with the distance at which the optical fibre is illuminated from the readout setup and by doing an adequate fit to the curve, using equation2.17we can get α.
2.11
Crosstalk
Crosstalk is the transference of radiation from one optical fibre to another adjacent fibre. This neighbouring fibre then absorbs or filters some of the transferred light. Consequently, there is a change in the absorption spectrum and cross contamination of the signal along the optical fibres [56].
In figure2.9, curve (b) shows an enhancement of the shorter wavelength absorption. This is due to the coupling effect, which is wavelength dependent [56], and a consequent small shift of the absorption peak towards the short-wavelength end of the spectrum.
2 . 1 2 . Q U E N C H I N G
Figure 2.9: Percentage of the incident power absorbed (a) for an optical fibre in isolation (b) in the illuminated fibre, and (c) in the coupled fibre [56].
2.12
Quenching
Quenching is the variation of response of scintillators with the ionization density, which is the number of ions per unit of path length produced by a fast-charged particle along its track. This phenomenon is mostly due to the dissipation of energy by non-radiatively means and is associated with a reduction of the scintillation efficiency [36]. Many detec-tors suffer from LET-dependent quenching, such as silicon diodes [36].
Quenching is more significant when considering protons or heavy ions because the ionization density increases with depth [36]. As discussed in section 2.5, this kind of particles show an increase of energy deposition (Bragg’s peak) at a certain depth. The increase in the energy deposition leads to a higher ionization density and therefore an increase in the quenching effect, causing a decrease on the signal intensity at the Bragg’s peak [36,39,54] as it is represented in figure2.10.
Quenching models are semiempirical because of the lack of comprehension of the physical process in scintillators; the most commonly used is Birk’s model [36]. The light output yield per unit length, dYdx, for a scintillator has been parameterized as a function of the stopping power as,
dY
dx = S
dE dx
C H A P T E R 2 . BAC KG R O U N D
Figure 2.10: Light signal measured with an organic scintillator detector. The dose and LET were calculated using a Monte Carlo model [36].
where S is the scintillation efficiency, which is defined as the fraction of energy ab-sorbed by the scintillator by the total energy originally deposited, and kB is the Birk’s constant, characteristic of each material. Scintillation efficiency is strongly dependent on the particle type and energy, the response for electrons being higher than that for heavier particles such as proton and alpha particles for equivalent energies [57].
Outside the Bragg peak region, when kBdEdx << 1, the light yield is proportional to the
stopping power (or LET),
dY
dx = S
dE
dx (2.19)
Since the stopping power, dEdx, in the Bragg peak is very high, the saturation occurs along the particle’s track [36]. In that regime, the Birk’s formula can be written as:
dY dx = S kB . (2.20) 24
C
h
a
p
t
e
r
3
M e t h o d s & M a t e r i a l s
In this chapter the methodology and tools used to study the optical properties of scintil-lating optical fibres are presented.
3.1
Scintillating Fibres
The optical fibres used were manufactured by Kuraray, Japan. These were plastic scin-tillating (SCSF-78), multi cladding fibres. The diameters of the fibres used in this work were 1 mm, 500 µm and 250 µm. The total thickness of the claddings could vary between 4% up to 6% of the total diameter of the fibre [53]. In figure3.1it is possible to find a schematic representation of the optical fibres.
Figure 3.1: Representation of the cross section of the scintillating optical fibres used [53].
In table3.1it is possible to consult the list of materials the optical fibre is made of, their density, refraction index and atomic density.
C H A P T E R 3 . M E T H O D S & M AT E R I A L S
Table 3.1: Physical properties of the different constituents of the optical fibre [53].
Materials Refracting Index Density (g/cm3) No. of Atoms per cm3
Core Polystyrene
(PS) 1.59 1.05 C: 4.9x10
22 H: 4.9x10²²
for single cladding inner for multi-cladding
Polymethylmethacrylate
(PMMA) 1.49 1.19
C: 3.6x10²² H: 5.7x10²²
O: 1.4x10²²
Cladding
outer for multi-cladding Fluorinated polymer
(FP) 1.42 1.43
3.2
Optical Fibres Support System for Output Readout
At LIP’s laboratory, LOMAC (Laboratório de Óptica de Materiais Cintilantes), there is an equiment named “fibrometer” built to measure the fibres’ light output yield. With this equipment it is possible to estimate, for instance, the attenuation coefficient. This machine has been previously used to measure the yield output of the optical fibres used at the TileCal detector ATLAS [58], one of the four detectors of the LHC experiment in Switzerland.
The fibrometer’s general setup consists of a source of light at one end and a photomul-tiplier (PMT) at the other (see Fig.3.2). In between, one can place the fibres to be analysed in single fibre grooves. The fibrometer has a XY table that allows for the automatization of the signal-reading process [58]. While the X motor moves the LED through the length of the optical fibres, the Y motor moves the table that contains the tray with the fibres.
Figure 3.2: Schematic representation of the transverse and longitudinal view of the fi-brometer [58].
The light readout system of the fibrometer consists of a blue sensitive EMI 9813KB PMT air coupled to a light mixer. The signal from the PMT is read by a KEITHLEY 485 auto-ranging picoammeter, equipped with a KEITHLEY 4853 IEEE488 interface [58]. The
3 . 3 . C H A R AC T E R I Z AT I O N T E C H N I Q U E S
PMT and light mixer are enclosed in a cylindrical metallic case with a 300 µm slit in the center. These slits work as a filter for unwanted radiation and its width can be adjusted. Since we wanted to quantify crosstalk effect in adjacent optical fibres, it was necessary to adapt the setup to our problem. Therefore, a new tray was designed with specific characteristics that would meet our needs. These were:
• Multi-fibre grooves - New grooves were designed to accommodate several juxtapose fibres as well as singe fibre grooves.
• Isolation - One of the main motivations to create this new support was to isolate the array of fibres from any other light source, especially from neighbouring LEDs.
• Materials - Given that one of the purposes of this support was to study the crosstalk effect between the optical fibres, the material of the support had to be non-reflecting (opaque), therefore POM (Polyoxymethylene) was the material chosen.
• Dimensions - The tray could not exceed the fitting dimensions of the platform that would fix the tray to the fibrometer.
• Versatility - The support was designed so that it could accommodate a variable number of optical fibres with different diameters. This was accomplished by cutting grooves with different depths (1 mm, 500 µm and 250 µm).
• Baseline - To control the lighting conditions of the system, an extra groove was added for each fibre diameter. This acted as a measurement of the baseline and as a control factor.
The first drafts of the tray were designed using Fusion 360 and were later sent to a workshop in LIP Coimbra to be further discussed and validated.
3.3
Characterization Techniques
3.3.1 Raman Spectroscopy
One of the tasks of this work was to identify which polymers are present in the scintillat-ing fibres. This was done by acquirscintillat-ing the Raman spectrum of a fibre and then identifyscintillat-ing the different compounds by comparison with references.
Raman spectroscopy is a technique based on inelastic scattering of monochromatic radiation [59], usually a laser [59, 60]. When photons interact with a sample, they are scattered and remitted with a different frequency. This shift in the frequency of the pho-tons is called the Raman effect and it provides information about vibrational, rotational and other low frequency transitions in molecules.
When photons hit the sample, their electric field and the electrons of the molecules of the sample interact, producing a magnetic dipole and consequently the molecules start
C H A P T E R 3 . M E T H O D S & M AT E R I A L S
to oscillate. When this oscillation causes a variation in the polarizability of the molecules Raman active vibrational (or rotational) modes are induced [60]. The bands observed in a Raman spectrum are the vibrational modes of the molecule for which the condition mentioned previously is verified. Each vibrational state has a corresponding wave number (cm−1) associated, making it possible to identify bonds and therefore compounds.
In order to obtain a signal as intense as possible, various factors are important: the intensity of the laser beam, the number of molecules that are irradiated and the collection of the Raman diffused light which should be as efficient as possible [61]. When perform-ing micro-Raman spectrometry, the radiation collection efficiency is greatly influenced by the lens, which should have a transmission coefficient as high as possible [61]. An im-portant parameter of the lens is the Numerical Aperture (N.A.), which describes the size of a conical beam of light that can pass through a lens. This quantity can be calculated as:
N.A. = n × sin(u) (3.1)
with n the refractive index of the medium and u the half top angle of the light cone. In figure3.3we can find a schematic representation of this relationship.
Figure 3.3: Schematic drawing of the aperture cone of an objective lens [61].
An important practical aspect of the Raman technique in this work has to do with the photon capture. In a micro-Raman system there is always a slit entrance into the spectrometer, which can be adjusted in terms of its diameter, and a microscope with various lenses that differ on their N.A. In between the microscope and the slit, it’s possible to install a confocal pinhole, to further reduce the probed volume, which is what we have in our Raman spectrometer. Figure3.4is a schematic of the two setups described.
3 . 3 . C H A R AC T E R I Z AT I O N T E C H N I Q U E S
Figure 3.4: Scheme of a confocal (a) and a conventional (b) microscope, coupled to a spectrometer [61].
In the simplest setup, when there is only the slit without the confocal pinhole, the laser beam is led into the microscope unit, whereby the microscope objective is used as focusing lens. The same lens is used to collect and send the diffused light to the spectrometer [61]. A big disadvantage in this setup is that the signal (peak) to noise is not optimal in most cases as there is a significant amount of photons being captured from other planes.
In the setup with the confocal hole, the assembly isolates the light from a specific plane in the sample which coincides with the illuminated part, and eliminates the radiation efficiently coming from other planes which are out of focus. With this setup it is possible to avoid the Raman signal and the fluorescence contribution of areas which are not in focus [61].
The lateral resolution δpof a Raman spectrometer is given by:
δp= 1.22 × λ
N.A. (3.2)
with λ being the laser wavelength and N.A. the numerical aperture of the lens. This limit value, however, is not reached in practice [61]. Besides the lateral resolution, the depth resolution also plays an important role. An approximate formula for the depth resolution is given by:
![Figure 1.1: Depth dose for different particles and for different energies in water [7].](https://thumb-eu.123doks.com/thumbv2/123dok_br/14997142.1009384/23.892.249.642.253.729/figure-depth-dose-different-particles-different-energies-water.webp)
![Figure 2.2: Cell survival curves as a function of the dose for di ff erent kind of particles and energies [18].](https://thumb-eu.123doks.com/thumbv2/123dok_br/14997142.1009384/30.892.249.657.463.787/figure-cell-survival-curves-function-erent-particles-energies.webp)
![Figure 2.4: Set of picture of elements that may take part in radiotherapy treatment [31].](https://thumb-eu.123doks.com/thumbv2/123dok_br/14997142.1009384/34.892.139.764.149.403/figure-set-picture-elements-radiotherapy-treatment.webp)
![Figure 2.6: Detector system resulting from HIT research.The ribbons were 20 cm long and the width covered by the photosensor was 51.2 mm [41].](https://thumb-eu.123doks.com/thumbv2/123dok_br/14997142.1009384/37.892.256.638.262.671/figure-detector-resulting-research-ribbons-width-covered-photosensor.webp)
![Figure 2.7: 2D map of the median energy of charge collection in a SOI [11]](https://thumb-eu.123doks.com/thumbv2/123dok_br/14997142.1009384/39.892.293.604.747.974/figure-d-map-median-energy-charge-collection-soi.webp)
![Figure 2.8: Microdosimetric distributions yd(y) in silicon detectors from experimental data, FLUKA and GEANT4 at different depths in Lucite [11]](https://thumb-eu.123doks.com/thumbv2/123dok_br/14997142.1009384/40.892.197.699.161.506/figure-microdosimetric-distributions-silicon-detectors-experimental-different-lucite.webp)
![Figure 2.9: Percentage of the incident power absorbed (a) for an optical fibre in isolation (b) in the illuminated fibre, and (c) in the coupled fibre [56].](https://thumb-eu.123doks.com/thumbv2/123dok_br/14997142.1009384/43.892.262.630.170.564/figure-percentage-incident-absorbed-optical-isolation-illuminated-coupled.webp)
![Figure 2.10: Light signal measured with an organic scintillator detector. The dose and LET were calculated using a Monte Carlo model [36].](https://thumb-eu.123doks.com/thumbv2/123dok_br/14997142.1009384/44.892.157.749.185.599/figure-light-signal-measured-organic-scintillator-detector-calculated.webp)
