M
ONETARY AND
F
INANCIAL ECONOMICS
M
ASTER
´
S
F
INAL
W
ORK
D
ISSERTATION
R
ISK
-
TAKING BY BANKS
,
C
ORPORATE GOVERNANCE AND
R
EGULATION
:
E
VIDENCE
FROM
EU
COUNTRIES
A
NA
J
IN
Y
E
M
ASTER
M
ONETARY AND
F
INANCIAL
E
CONOMICS
M
ASTER
´
S
F
INAL
W
ORK
D
ISSERTATION
R
ISK
-
TAKING BY BANKS
,
C
ORPORATE GOVERNANCE AND REGULATION
:
E
VIDENCE
FROM
EU
COUNTRIES
A
NA
J
IN
Y
E
S
UPERVISION:
M
ARIA TERESAM
EDEIROSG
ARCIAThe aim of this dissertation is to study the relationship between banks’ ownership structure and its risk-taking behaviour. Additionally, we also examine the impact of the banking regulation in the way that banks take their risk. The empirical analysis considers a sample of listed banks from EU countries, over the period spanning from 2011 to 2016. The econometric model used was a generalized least squares random effect regression, since we are considering a balanced panel dataset. We test the hypothesis that banks with a large shareholder structure have the propensity to take on more risk, when comparing to those who have a more diffuse shareholder structure. We also consider the structure of the board of directors as an explanatory variable in our model: if a bigger board or more independent directors have an influence on the bank risk-taking behaviour.
Taking into account the selected sample, we found some evidence that the board of director’s structure can influence the bank risk behaviour. On the other hand, to the ownership concentration, little or no evidence was found. Regarding the influence of the regulatory environment in the bank risk, there is no significant relationship between them, i.e. stricter regulation has no effect on how banks take their risk.
Keywords: Banks; Risk; Corporate governance; Regulation; EU countries. JEL Codes: G21; G32; G34; G38.
iv
A
CKNOWLEDGMENTSI would like to thank Professor Maria Teresa Medeiros Garcia for her availability to answer my questions and guidance during the process of this work.
I am also grateful to my family and friends for their support and encouragement to finish this dissertation.
v
T
ABLE OFC
ONTENTS Abstract ... iii Acknowledgments ...iv Table of Contents ... v List of Figures...viList of Tables ... vii
1. Introduction... 1
2. The economic environment and the banking sector ... 3
3. Literature review ... 8
4. Data and Methodology ... 13
4.1 Data... 13 4.2 Bank risk-taking ... 13 4.3 Corporate Governance ... 14 4.4 Regulation ... 15 4.5 Control variables ... 16 4.6 Summary statistics ... 18 4.7 Econometric model ... 23 5. Empirical results ... 25
5.1 Bank risk-taking and corporate governance ... 25
5.2 Bank risk-taking and regulation ... 30
5.3 Robustness test ... 32
6. Conclusions ... 33
References ... 34
vi
L
IST OFF
IGURESFigure 1 - Net interest income of top 20 European banks ... 4
Figure 2 - Total revenues of top 20 European banks ... 5
Figure 3 - Trading income of top 20 European banks ... 5
Figure 4 - Fees and Commissions of top 20 European banks ... 5
Figure 5 - Operating income structure of the euro area banking sector ... 6
Figure 6 - Composition of operating expense of the euro area banking sector ... 6
Figure 7 - Core risk-weighted capital ratio of top 20 European banks ... 7
Figure 8 - Evolution of share prices of European banks ... 7
Appendix Figure A.1 - GDP in EU countries ... 40
Figure A.2 - Unemployment rate ... 40
vii
L
IST OFT
ABLESTable I - Summary statistics of the variables ... 18
Table II - Correlation matrix ... 21
Table III - GLS random effect regression results between bank-risk (dependent variable - Z-score) and corporate governance ... 26
Table IV - GLS random effect regression results between bank-risk (dependent variable - CAR) and corporate governance ... 27
Table V - OLS regression results between bank-risk (dependent variable - Z-score) and corporate governance ... 29
Table VI - GLS effect regression results between bank-risk (dependent variable - Z-score) and regulation ... 31
Appendix Table A.I - Value added by activity ... 41
Table A.II - Definition of the variables ... 41
Table A.III - Detailed information regarding regulatory index ... 43
1
1.
I
NTRODUCTIONBanks play a crucial role in the economic growth and are responsible for preserving financial stability. For instance, the bankruptcy of one of the largest investment banks in the United States, the Lehman Brothers, triggered a financial crisis that affected countries across the world. As a consequence, governments and central banks refocused their attention on the financial sector and, more particularly, on the banking system. Regulators began to deploy more restrict regulation, in order to create a robust banking system, capable of enduring the next financial crisis with increased resilience. Among the many causes of instability in the banking sector, the risk-taking behaviour is one of the main sources of insolvency. In the case of European banks, greater exposures to systemic risk, due to shadow banking activities, caused worse performances (Acharya et al., 2013; Arteta et al., 2013). Additionally, according to Beltratti & Stulz (2012), banks with higher stock returns before the period of the latest crisis, corresponded to those that performed worse during the crisis.
Going forward, recent studies show that the risk-taking behaviour is related with the corporate governance of the bank. As Beltratti & Stulz (2012) suggest, during financial crisis, the stronger the corporate governance, lesser risk the banks took, and consequently better they performed. The corporate governance can be characterized in several ways: concerning to ownership structure – is the financial institution owned by a large shareholder, or by diffuse shareholders? Banks are considered to have a good ownership concentration when their shareholders are diffuse, because in the cases where large shareholders are present, they will tend to behave in their own interest, which is taking more risky portfolios to consequently have higher returns, even if that is harmful to the performance of the bank - agency problems (Laeven & Levine, 2009; Esty, 1998; Galai & Masulis, 1976). The structure and the composition of the board of directors may also play a role in the incentives of a bank to be more risky or not. Smaller board size may perform better as the risk of disagreements, due to diversified points of views, is diminished and the decision making process of the strategy is more
2
straightforward. On the other hand, if directors are not independent from the bank, their behaviour can be skewed and more prone to conflict of interests (de Andres & Vallelado, 2008).
In the context of a financial crisis, it is also important to understand the role of the regulators - is it true to say that more restrict regulation implicates lesser risk behaviour? According to Laeven & Levine (2009), the impact of the regulation varies from bank to bank according to the type of the corporate governance. For instance, financial institutions with larger shareholders tend to choose riskier investment portfolios in order to compensate for the utility loss by stringent capital requirements.
Therefore, it is very important to analyse the role corporate governance plays on banks’ risk-taking behaviour and how the regulatory framework affects it. This dissertation differs from the previous studies in terms of the period that we are analysing, which is between 2011 and 2016, whereas the recent literature essentially covers until a few years after the financial crisis. The majority of the empirical analysis uses a sample of countries across the world or in the United States, whereas scarce studies are focused on European countries. Moreover, using a balanced panel dataset, including observations of European banks, we regress a generalized least squares random effect model to determine whether the corporate governance influence the bank risk-taking behaviour as well as the role of regulation in this relationship.
The dissertation is structure as follows: in Section 2 we briefly introduce the economic environment and describe the banking sector. In Section 3 we present some literature review regarding corporate governance, risk and regulation and the relationship between them. In Section 4 we describe the data and the methodology used. In Section 5 we show the results of the empirical assessment and finally in section 6 we summarize the conclusions of this dissertation.
3
2.
T
HE ECONOMIC ENVIRONMENT AND THE BANKING SECTORGoing back ten years, more specifically to September 2008, Lehman Brothers collapse was the catalyst that ignited the conditions that were being built for several years, ultimately resulting in the eruption of the latest global financial crisis. This shock deteriorated the economy environment in several ways: GDP started to decrease, from 26,100 euro per capita in 2008 to 24,500 euro per capita in 2009 as showed in figure A.1. This decline was essentially led by a contraction in exports and less private investment, namely in manufacturing and industry (including energy) sectors as showed in table A.I. The unemployment rate, as presented in figure A.2, reached record numbers, which consequently also depressed private consumption (figure A.3).
The collapse of the Lehman Brothers acted just a trigger, since the global macroeconomic environment was already showing worrying signs of imbalances and a weak financial system being slowly installed. The lack of strong regulation and supervisory frameworks have progressively lead to a higher risk-taking behaviour by banks, where riskier investment portfolios were chosen to get higher returns. According to Kosmidoua et al. (2017) and Cohen et al. (2014), higher opacity in a bank, i.e. less financial transparency and information asymmetry, is strongly associated to a stock crash risk. At the pre-crisis period the banking sector had precisely being accumulating this kind of opaque financial products and risky assets, of which asset backed securities are the main example. Moreover, liquidity issues were also identified as one of the origins for the vulnerability of the financial market (Longstaff, 2010), in a sense that toxic assets could not be recovered, or liquidated, and consequently banks were unable to raise funds in the market.
Nevertheless, the financial crisis forced significant structural changes in the macroeconomic environment and in the financial system, particularly in the regulatory and supervisory framework. Governments and central banks refocused their attention on the banking system, and began to implement several reforms in this regard. For instance, the Basel Committee on Banking Supervision reformulated and upgraded the
4
Basel Committee Standards by announcing in December 2010 the Basel III framework. This enhanced global regulatory framework had the purpose to foster a more resilient banking system, by introducing the global liquidity risk standards and the overall leverage ratio, as well as strengthening the capital requirements that were already put in place in the past decade (Basel Committee on Banking Supervision, 2010).
As regards Europe, the reforms enclosed with the application of Basel III (started in 2013) along with the implementation of the single supervisory mechanism (SSM), officially launched in 2014. The SSM composition consisted mainly on transferring the direct supervision of significant banks, assessed in terms of dimension and systemic importance, from the national competent authorities to the European Central Bank. Additionally, on the monetary policy front, some extreme measures were taken to stimulate the economic growth. The ECB has progressively decreased the reference interest rate to unprecedented low figures, even reaching real negative levels, and embarked on unconventional measures, such as increasing its balance sheet through the purchasing of large amounts of government bonds with the aim of decreasing real interest rates.
Hence, structural financial indicators started to reveal some recovering from the crisis in the banking sector. As illustrated in figure 1, the net interest income smoothly increased, comparing to the values before crisis, as a repercussion of the low interest rates settled by the European Central Bank.
Figure 1 - Net interest income of top 20 European banks | Euro bn
5
Notwithstanding, total revenue has declined (figure 2), as a significant fall in trading income (figure 3) and fees and commissions (figure 4) have more than compensated the interest income recovery (Schildbach, 2017).
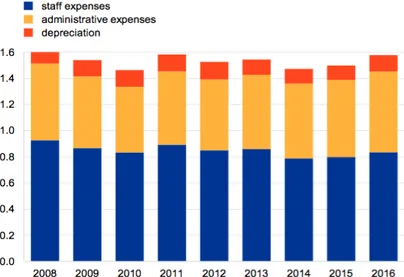
The raise, from 2008 to 2016, of the share of operating income in total assets (figure 5) along with lower expenses (figure 6) demonstrates that banks nowadays seek for a more safe asset allocation, with an improvement on the management strategy and rigorous supervision (European Central Bank, 2017).
Source: Schildbach (2017), p. 3 – figure 6
Figure 2 - Total revenues of top 20 European banks | EUR bn
Figure 4 - Fees and Commissions of top
20 European banks | EUR bn)
Source: Schildbach (2017), p. 3 – figure 3
Figure 3 - Trading income of top 20
European banks | Euro bn
6
Figure 5 - Operating income structure of the euro area banking sector (all domestic
banks) | Percentage of total assets
Source: European Central Bank (2017), p. 41 – chart 2.28
Figure 6 - Composition of operating expense of the euro area banking sector
(all domestic banks) | Percentage of total assets
7
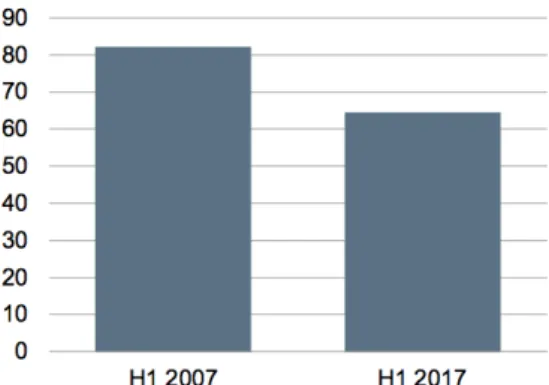
More demanding capital requirements had the intended effect of increasing the capital ratio (figure 7). In this context, regulators and policy makers are more focused on the Common Equity Tier 1 definition, due not only to the more straightforward capital definition used, but also due to the strict criterion on risk-weighted assets (Schildbach, 2017).
Lastly, in terms of market indicators, the European financial stocks are still recovering from the financial crisis aftermath, figure 8 shows that levels of shares prices continue to be lower than pre-crisis period, caused by the heritage of toxic assets and non-performing loans (Basten & Serrano, 2018) from which legacy is revealing to be quite hard to unwind.
Figure 7- Core risk-weighted capital ratio* of top 20 European banks |
%, unweighted average
* 2007: Tier 1 ratio ; 2017: Common Equity Tier 1 ratio (Basel III fully loaded)
Source: Schildbach (2017), p. 5 – figure 12
Figure 8- Evolution of share prices of European banks
8
3.
L
ITERATURE REVIEWIn order to maintain a sound and resilient economy, each agent within needs to play its role in the best way they can. As a practical example, financial institutions, particularly banks, act as the bridge between lenders and borrowers, thus playing a role as financial intermediaries, by channelling funds from one to another. Besides allocating savings and granting credit, they also provide payments services such as credit transfers, direct debits, card payments, mobile and online payments. In this perspective, banks are quite different from non-financial firms since their business model is very distinct.
On one hand, banks are highly leveraged, where debt typically represents more than 90 percent of the balance sheet, comparing to 20-30 percent in the case of non-financial firms (Gornall & Strebulaev, 2014). Due to this singularity, any increase in bank debt has a great effect in the banks’ profitability, especially during financial crisis (Konstantinos, 2012).
On the other hand, Levine (2004) suggests that in the banking system large informational asymmetries exist between internal and external parties, leading to more opaque institutions. Insiders1, tend to choose riskier portfolios in order to have larger
returns, conversely debt holders (as outsiders) are more inclined to take less risk. Thereafter, the existence of opaqueness makes more difficult for outsiders to control this risk-taking behaviour. Naturally, with the purpose to protect bank’s outsiders, governments and supervisors are forced to be stricter in terms of regulating the banking sector, such as establishing minimum capital requirements.
Since the last financial crisis, affecting a large number of countries worldwide, several studies have been focusing on finding more deeply the causes at the origin of the shock. Previous literatures suggest that a relationship between banks’ performance and their risk-taking behaviour do exist (Acharya et al., 2013; Arteta et al., 2013). Considering the crucial role that banks play in the economic growth and their
9
responsibility in preserving the financial stability, an augmenting in their risk-taking behaviour generates an economic fragility (Bernanke, 1983; Calomiris & Mason, 2003a,b; Keeley, 1990). Additionally, the interaction between a weak risk management and a complex and opaque financial products, only further deteriorates the financial system.
Hence, one of the responsible parties for a bank to be riskier or not are the board of directors, in a sense that they are the ones responsible for defining the bank’s strategy and advising managers on their decisions. The type of board of directors established in a bank could determine the distance of insolvency (Battaglia & Gallo, 2017). On the other hand, managers also influence the bank risk-taking behaviour as they are directly responsible for the decisions in the operational business lines and day-to-day business. In this context, banks’ corporate governance receives a reinforced attention among regulators, policy makers and researchers along with the relationship between corporate governance and bank risk-taking. Kirkpatrick (2009) goes as far as to argue that the main cause of the 2007-2008 financial crisis was precisely the presence of a poor governance in the banking industry.
John et al. (2016) compiled the existent literature on corporate governance in banks, specifically with respect to corporate boards, ownership and managerial incentives. They present the empirical assessments’ results from various authors, displaying divergent conclusions on the issues previously mentioned. This fact also shows that this topic has been strongly discussed among researchers in order to better understand the role of corporate governance in banks.
The Basel Committee on Banking Supervision has also addressing this issue in its research works, by publishing guidelines and consultative documents on corporate governance. Particularly, the most recent consultative document, “Principles for enhancing corporate governance” (Basel Committee on Banking Supervision, 2010), references a set of principles for a sound corporate governance in the banking industry. Furthermore, this subject was also included in Pillar 2 requirements (supervisory review
10
process) of Basell II (Basel Committee on Banking Supervision, 2005, pp. 163–1642),
reinforcing the importance of monitoring risk management and establishing principles for a good corporate governance.
Despite several papers revealing some evidence between governance structure and bank risk (Ellul & Yerramilli, 2013; Jensen & Meckling, 1976; John et al., 2008), there is no consensus in the sign of this relationship.
According to Laeven & Levine (2009), Esty (1998) and Galai & Masulis (1976), an ownership with large shareholders raises bank risk. Comparing with managers, shareholders typically have a more diversified portfolio and the losses of choosing a riskier portfolio would not damage their personal wealth so deeply. In addition, for banks with a very concentrated ownership, its shareholders will have stronger power to control the strategic decisions, holding back the opinion of the minority shareholders.
A corporate structure divided by the board of directors and managers creates some agency problems (Berle & Means, 1932). In one way, banks with large shareholders tend to choose directors of the board with the purpose of protecting their own interest of taking more risk. On the contrary, managers have a less diversified investment portfolio and the fact of holding bank’s equity leads them to take less risky activities (Saunders et al., 1990; Bouwens & Verriest, 2014). However, the outcome of Iannotta et al. (2007)
research is different from the previous literature, arguing that “higher ownership concentration is associated with better loan quality, lower asset risk and lower insolvency risk”.
The structure of the board of directors can also be characterized in terms of size and independence. Concerning the latter, it is expected that independent members (someone with no relation with the institution) have a more uncompromised involvement with the financial institution comparing to shareholders and managers, and consequently make more reasonable decisions. In this regard, a negative association
2 In July 2009, the Pillar 2 framework was revised due to the weakness founded during the financial
crisis and published a new document with stricter principles (Basel Committee on Banking Supervision,
11
between bank risk-taking and independence is supported by various researchers (Beltratti & Stulz, 2012; Erkens et al., 2012; Wang & Hsu, 2013). Beltratti & Stulz (2012), conclude that banks with a shareholder-friendly board take more risk during crises, by using a sample of large banks across the world. Erkens et al. (2012) suggest that, in crisis periods, banks performed better when a more independent board was present, since those elements were crucial on the decision of increasing capital, thus transferring wealth from shareholders to debt holders. Wang & Hsu (2013) test the effect of the board composition and the probability of a bank having an operational risk event. The results show that board independence is inversely related to the risk of financial institutions in that front.
In terms of the board size, Battaglia & Gallo (2017) found that banks with larger number of elements in the board suffered greater losses during the crisis, which affected the financial stability by exposing the institutions to more systematic risk. This empirical evidence follow Wang & Hsu (2013), who also suggest that operational risk management performs worse when a bigger board was present. The fact that a board size negatively affects banks’ performance is associated with the fact that numerous directors lead to a more diversified culture and personalities in the board, generating different opinions and strategies for the bank. Additionally, during board meetings it would become more difficult to coordinate and obtain a unanimous decision.
Summing up, strong boards (small size in terms of members and a higher number of them being independent directors, as defined by Pathan (2009) and Battaglia & Gallo (2017)) tend to take less risk and perform better comparing to those with larger board size and less independent directors.
In contrast, Adams (2012) shows that banks characterized as having strong boards, are associated with the TARP (Trouble Asset Relief Program) and an inverted u-shape is reflected when analysing the effect of a bank board structure on bank’s performed (de Andres & Vallelado, 2008). Those different perspectives presume there is still no consensus among economic investigators and still more analysis is needed. John et al. (2000, 2008) reveal mixed results, indicating that the impact of corporate governance on bank risk-taking depends also on the capital regulation. The findings suggest that
12
regulators should take this issue into account in periods of reforms, by distinguishing regulation among financial institutions, according to bank characteristics such as the corporate governance.
One of the principal instruments for regulators to control bank risk is through capital adequacy. This Instrument is being enhanced over the past years, in particular after the last financial crisis. With the former, more relaxed, capital adequacy instruments, several banks had still to be rescued or recapitalized, including those considered “too-big-to-fail”, consequently severely unbalancing the financial system. A higher percentage of capital adequacy suggests that the financial institution is more stable and have less credit exposures, which in turn contributes to preventing future insolvencies (Jeitschko & Jeung, 2005; Grossman, 1992). Commonly, central banks and supervisors set a minimum of capital requirements and monitor those closely through periodic reports. Recently, Basel Committee on Banking Supervision (2010) published Basel III, encompassing stricter standards principles for Pillar I, which incorporate the monitoring of capital, risk coverage and leverage containment. The question is, does this type of regulation actually reduce the bank risk-taking behaviour? In some sense, a few authors suggest that an increase of the minimum capital requirements would lead to higher risk, as banks tend to compensate the utility loss of stricter regulation (Buser et al., 1981;
Koehn & Santomero, 1980; Laeven & Levine, 2009;). In this perspective, when the capital adequacy ratio is determined, banks are inclined to invest in risky assets as far as the capital requirement is reached. As mentioned before, the relationship between ownership structure and bank risk depends on the capital regulation, but on the other hand the risk-taking incentives also vary according to the ownership structure, even with the same regulation in one country (Laeven & Levine, 2009).
All in all, it is important to emphasize the role of corporate governance in the banking industry since it is related with the risk-taking behaviour. Furthermore, the aim of the authorities to create a robust banking system that could endure the next financial crisis through the recourse to stricter regulation may not have the expected effect for all banks alike.
13
4.
D
ATA ANDM
ETHODOLOGY4.1DATA
The initial dataset used in this study, considers all publicly listed active banks identified by Moody's Analytics BankFocus at the beginning of 2018. We focused on banks from European Union countries3 and collected data of income statement and
balance sheet from the period of 2011 to 2016. This original sample was subsequently reduced to 140 banks due to problems of data availability, ultimately resulting in the exclusion of some countries from the analyses, namely Estonia, Ireland and Luxembourg. We have also eliminated France cooperative banks, specifically Credit Agricole group, since we are going to analyse the effect of ownership, risk and regulation of those regional banks through Credit Agricole S.A. Additionally, we only consider banks who were part of the EURO STOXX 50 Index for more than three years during the period comprised between 2011 and 2016. The final sample includes a balanced data of 726 observations, representing 121 banks from 23 countries.
The source of financial information was Moddy’s Analytics BankFocus, whereas data concerning corporate governance were hand-collected from the respective annual reports. The information about countries variables was obtained from Eurostat and complemented by the World Bank. Finally, the market information regarding mergers and acquisitions activities derived from SNL – S&P Global Market Intelligence.
4.2BANK RISK-TAKING
The scope of financial institutions includes diverse activities and each subject is associated with specific risk though they are all related with each other. Some of those
3 Austria, Belgium, Bulgaria, Croatia, Cyprus, Czech Republic, Denmark, Estonia, Finland, France,
Germany, Greece, Hungary, Ireland, Italy, Latvia, Lithuania, Luxembourg, Malta, Netherlands, Poland, Portugal, Romania, Slovakia, Slovenia, Spain, Sweden and United Kingdom.
14
risks are external and not controlled by bank managers, for instance risk related with adverse market movements (e.g. variations in the interest rate, foreign exchange, equities and commodities). However, banks should always be prepared for those types of events. Others, such as credit risk and operational risk, can be supervised and moderated depending on the strategy of the bank. Prior studies argued that risk behaviour is related with bank’s performance and consequently the probability of bankruptcy (Bernanke, 1983; Calomiris & Mason, 2003a,b; Keeley, 1990).
A commonly used measure to proxy the variable of risk is the z-score, calculated as (ROA+CAR)/σ(ROA), also used by several authors: Laeven & Levine (2009), Pathan (2009)
and Beltratti & Stulz (2012). ROA correspond to Return on Assets, calculated as Net income plus Interest Expense divided by Total assets. The CAR (Capital Adequacy Ratio) is measured by the division of Tier 1 Capital to Risk-Weighted Assets and σ(ROA) indicates the volatility of Return of Assets. Bank’s z-score refers to the inverse probability of insolvency (Roy, 1952), whereby a higher value in the distance of failure indicates less risk and greater stability. As Laeven & Levine (2009) and Battaglia & Gallo (2017), we transform z-score into a natural logarithm, which is normally distributed, since this measure is highly skewed.
We also examine a component of this measure separately, that is the Capital Adequacy Ratio, as a risk measure. The reason for integrating this variable in our model is due to this ratio being closely monitored by the regulators and supervisors, where higher values means a more stable bank. The data collected to calculate the two measures was obtained from Moddy’s Analytics BankFocus considering the period 2011-2016.
4.3CORPORATE GOVERNANCE
The analysis of corporate governance can be conducted in different ways and in this dissertation we mainly focus on ownership concentration and the board of director’s structure. Information on bank ownership and board structures were hand-collected
15
from the annual reports from the year of 2016 of each bank. We assumed this data remained unchanged for the entire period (2011 to 2016) since corporate governance structures changes little over time (Black et al., 2006; Cremers & Ferrell, 2010; La Porta et al, 1998, 1999). Additionally, in case of absent information on the 2016 annual report, we based on the current situation with respect to ownership and bank board.
Regarding the ownership concentration, we follow La Porta et al. (1999) and Laeven & Levine (2009) ownership references, and consider a bank as widely held when the largest shareholder holds less than 10% of the bank’s voting rights. In our model we distinguished ownership in two variables: a dummy variable that assumes 1 when it is classified as large shareholder and 0 otherwise; and the other as a direct percentage of the voting rights of the largest shareholder.
Among other features, a strong board can be characterized as having a small size in terms of members and a higher number of them being independent directors (Pathan, 2009; Battaglia & Gallo, 2017). For the board size we collected the number of directors on the board and for independence we considered the share of total directors who are independent. Independence is defined as follow:
An independent director is not an existing or former employee of the banks or its immediate family members and does not have any significant business ties with the bank.
In: Pathan (2009), p. 1343
4.4REGULATION
Following prior studies (Beltratti & Stulz, 2012; Laeven & Levine, 2009), we use four variables as proxies of regulation: regulatory restrictions, capital stringency, power of official supervisor and private monitoring. All of those indicators are characterized by country and it is based on the World Bank Banking Supervision Survey4, conducted in
2011 by Barth et al. (2012). The definition of the variables is as follow:
4 The survey provides information about the regulation and supervision for 143 countries, regarding
16
• Regulatory restrictions is an index of regulatory restrictions on bank activities; • Capital Stringency is an index of regulatory oversight of bank capital;
• Power of official supervisor is an index of the power of the bank supervisory agency;
• Private monitoring is an index of monitoring on the part of the private sector of the banking system.
All of those indexes indicate the degree of regulation in a country, where greater values indicate that the bank industry is highly regulated.
In our analysis we exclude the indicator of capital requirements that is commonly used by researchers. In fact, most of the samples used on those studies cover countries across the world where the regulation varies from country to country. In case of Europe, particularly in the countries of our sample, the minimum capital requirements is the same, settled as 8% (identical to Basel III). We also did not consider the dummy variable used by Laeven & Levine (2009) regarding deposit insurance, for the reason that all European countries are covered by a deposit guarantee scheme (defined by each national authority).
4.5CONTROL VARIABLES
Furthermore, we incorporate in our model certain control variables with respect to bank-specific characteristics. According to Demsetz & Strahan (1997), when compared with smaller banks, major financial institutions have a tendency to invest in more risky loan portfolios and operating with higher level of leverage ratios, since they can compensate from the benefits of having a more diversified options to invest. In this perspective, we account the leverage ratio variable as a control variable, corresponding to the division of tier 1 capital to total assets, where a lower ratio indicates more leverage, hence a higher bank risk.
corresponds to a numeric value. Our dissertation includes the follow issues: i) bank activity, ii) capital, iii) official supervisory and iv) private monitoring.
17
The variable bank credit risk is taken from the ratio of impaired loans to gross loans and aims to measure the amount of total loans, which are impaired or doubtful. It can also be considered as a proxy of portfolio quality (Casu et al., 2011), where a lower ratio means a better asset quality. A commonly used measure for asset quality is the loan loss provision over net interest revenue. This ratio indicates how much of interest income is reserved to non-performing loans (NPL). The variable for liquidity risk is calculated by the ratio of liquid assets (cash and balances with central banks plus net loans and advances to banks plus level one assets) over deposits and short term funding (customer deposits plus short term funding).
To control the bank business activity, we considered the ratio of loans over total assets, corresponding to the percentage of total assets that are invested in the loan portfolio, controlling the differences in banking business model across banks (de Andres & Vallelado, 2008).
We use the cost to income ratio to evaluate operational bank’s efficiency and this indicator is calculated as the ratio of total operating expenses over total operating income. A lower ratio means that the bank is more efficient. As previously mentioned, the size of the bank also affects the risk behaviour, so for that reason we use the natural logarithm of the total asset variable.
Lastly, we include a dummy variable that assumes 1 when a bank was subject to a merger or a major acquisition over the sample period and 0 otherwise. These kind of events can indeed be disruptive and there is a good chance they might influence bank governance (Schranz, 1993; Berger et al., 1998).
Regarding the country control variable, we use the logarithm of GDP per capita to account for economic environment changes. All bank-specific data were obtained from Moody's Analytics BankFocus, except for the variable merger and acquisition, which was derived from SNL – S&P Global Market Intelligence.
18
Table A.II presents the definitions for all variables of our sample and the respective expected sign. Additionally, in table A.III, we describe the questions made on the survey for each index, as defined by the authors.
4.6SUMMARY STATISTICS
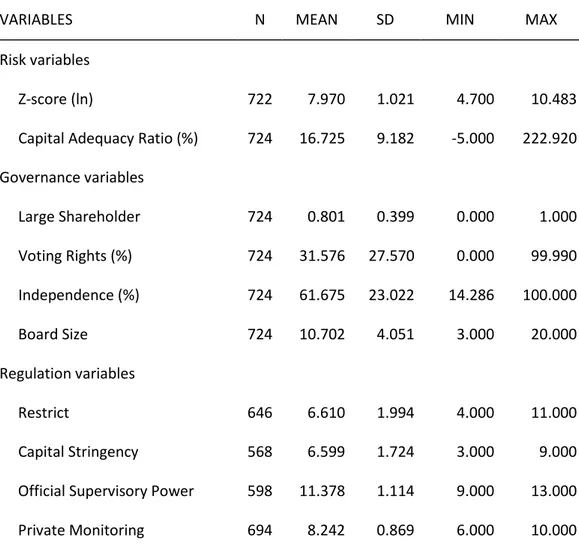
Table I displays the summary statistics for risk, ownership, regulation and control variables used in the empirical analysis. Additionally, in table A.IV, we present the average value of each variable of our sample, clustered by country.
Table I - Summary statistics of the variables
VARIABLES N MEAN SD MIN MAX
Risk variables
Z-score (ln) 722 7.970 1.021 4.700 10.483 Capital Adequacy Ratio (%) 724 16.725 9.182 -5.000 222.920 Governance variables Large Shareholder 724 0.801 0.399 0.000 1.000 Voting Rights (%) 724 31.576 27.570 0.000 99.990 Independence (%) 724 61.675 23.022 14.286 100.000 Board Size 724 10.702 4.051 3.000 20.000 Regulation variables Restrict 646 6.610 1.994 4.000 11.000 Capital Stringency 568 6.599 1.724 3.000 9.000 Official Supervisory Power 598 11.378 1.114 9.000 13.000 Private Monitoring 694 8.242 0.869 6.000 10.000
19
Control variables
Leverage Risk (%) 724 8.050 5.688 -4.196 65.010 Liquidity Risk (%) 724 34.388 58.327 1.550 819.090 Bank Business Activity (%) 724 53.910 19.041 1.340 87.480 Asset Quality (%) 723 35.464 68.231 -878.890 693.950 Bank Credit Risk (%) 705 10.863 11.696 0.000 88.970 Efficiency (%) 724 64.269 36.972 -484.150 586.120 Bank Size (ln) 724 16.579 2.550 10.861 21.536 Merges & Acquisitions 724 0.0580 0.2339 0.0000 1.0000 GDP (ln) 724 10.143 0.549 8.631 10.787
The average Capital Adequacy Ratio is higher than the minimum required (8%), presenting a percentage of 16.725, meaning that the majority of banks are accomplishing the regulation.
As seen in table A.IV, the country with lower percentage is Greece (12.300), mainly because of the economic and financial assistance program the country went through5.
On the contrary, the highest percentage is seen in Netherland with an average percentage of 24.900. Continuing the analysis per country, the one with higher insolvency risk is Greece (5.998) for the reasons mentioned before, whereas the country with less probability of default is France (8.827).
Regarding the corporate governance variables, the mean of large shareholder is 0.801 indicating that the majority of banks of our sample have an owner with more than 10% of shares. On the other hand, that percentage is not so high in a sense that the mean of the voting rights is merely 31.576. Additionally, only 4 banks have a shareholder with more than 90 % of the voting rights, where three come from Slovakia and 1 from
5Provopoulos (2014) describes the economic environment in Greece and the banking system during
20
Netherland. For shareholders with less than 10% of voting rights, we consider it as a null value, by following Laeven & Levine (2009). According to Kohler (2010), the mean of United Kingdom (UK) voting rights presented on table A.IV is lower comparing to Continental Europe6 mainly due to the protection of shareholders rights in UK, where
large shareholders do not need to have much control of the bank in order to be able to control the management decisions.
As to the term of independent directors, the mean percentage is 61.675 with a minimum 14.286 and a maximum of 100.000. In this sample, 19 financial institutions have a full independent board. The lower percentage belongs to a Lithuanian bank - Siauliu Bankas. It is also found that, on average, the board of European Union countries has 10 elements, with a minimum of 3 and a maximum of 20. The bank with fewer elements is Prima Bank Slovensko A.S., in spite of not being the smallest bank when considering the average of total assets. The smallest bank has 7 directors on the board. On the other hand, there are three banks with 20 board members7, all of them belonging
to the top 15 biggest banks of our sample.
Concerning the regulation variables, there are great differences between countries regarding the restrictions, where the range of this index is 3-12 and in our sample we have a minimum of 4 and a maximum of 11. Poland is the country with higher restrictions in banking activities. Concerning capital stringency, the average is 6.599, which is slightly above the range media (5) of this index. The official supervisory agencies in countries from EU have a highly power over the banking system, since the minimum is 9 and a maximum of 13 in a range of 0-14. Lastly, the minimum value for private monitoring is 6, as it is the case for Portugal, and the maximum value is 10, corresponding to a mean of 8.242.
In table II we present the correlation matrix by using Pearson’s correlation coefficients. According to Barako & Tower (2007) and Gujarati (2003, p.359) findings,
6 The author considers the following countries as Continental Europe: France, Germany, Italy and
Spain.
21
Table II - Correlation matrix
Variables (1) (2) (3) (4) (5) (6) (7) (8) (9) (10) (11) (12) (13) (14) (15) (16) (17) (18) (19) (1) Z-score 1.000 (2) CAR 0.262* 1.000 0.000 (3) Large Shareholder -0.138* -0.040 1.000 0.000 0.277 (4) Voting Rights -0.143* -0.030 0.571* 1.000 0.000 0.417 0.000 (5) Independence 0.196* 0.197* -0.065 -0.071 1.000 0.000 0.000 0.081 0.055 (6) Board Size 0.177* -0.146* -0.139* -0.237* -0.191* 1.000 0.000 0.000 0.000 0.000 0.000 (7) Leverage -0.266* 0.104* 0.167* 0.074* -0.100* -0.275* 1.000 0.000 0.005 0.000 0.047 0.007 0.000 (8) Liquidity -0.083* 0.043 0.013 -0.006 -0.066 -0.036 0.709* 1.000 0.025 0.242 0.728 0.873 0.078 0.339 0.000 (9) Business Activity -0.219* -0.268* 0.051 -0.048 -0.151* 0.012 -0.029 -0.371* 1.000 0.000 0.000 0.168 0.199 0.000 0.748 0.435 0.000
22 (10) Asset Quality -0.318* -0.155* -0.021 -0.074* -0.136* 0.104* 0.054 0.040 0.231* 1.000 0.000 0.000 0.567 0.046 0.000 0.005 0.146 0.283 0.000 (11) Credit Risk -0.537* -0.144* 0.067 -0.013 -0.186* -0.090* 0.556* 0.421* 0.042 0.398* 1.000 0.000 0.000 0.075 0.729 0.000 0.017 0.000 0.000 0.268 0.000 (12) Efficiency -0.033 -0.001 -0.032 0.031 0.122* -0.032 0.174* 0.236* -0.145* 0.097* 0.137* 1.000 0.372 0.988 0.388 0.407 0.001 0.396 0.000 0.000 0.000 0.009 0.000 (13) Bank Size 0.172* -0.100* -0.269* -0.150* -0.076* 0.635* -0.529* -0.134* -0.015 0.049 -0.258* -0.127* 1.000 0.000 0.007 0.000 0.000 0.040 0.000 0.000 0.000 0.687 0.188 0.000 0.001 (14) M & A -0.032 -0.051 -0.024 -0.063 -0.074* 0.166* -0.126* 0.004 -0.045 0.018 -0.025 -0.051 0.276* 1.000 0.392 0.170 0.513 0.089 0.046 0.000 0.001 0.920 0.223 0.622 0.503 0.168 0.000 (15) GDP 0.402* 0.151* -0.117* -0.379* 0.185* 0.253* -0.014 0.197* -0.165* -0.147* -0.155* 0.034 0.033 0.015 1.000 0.000 0.000 0.002 0.000 0.000 0.000 0.715 0.000 0.000 0.000 0.000 0.360 0.374 0.680 (16) Restrict -0.051 -0.104* 0.139* 0.324* -0.146* -0.224* 0.093* -0.015 0.162* -0.075 -0.025 -0.037 -0.128* -0.053 -0.340* 1.000 0.193 0.008 0.000 0.000 0.000 0.000 0.018 0.711 0.000 0.057 0.523 0.352 0.001 0.180 0.000 (17) Capital -0.026 -0.055 0.150* 0.214* -0.080 -0.237* -0.035 -0.027 -0.113* -0.016 0.109* -0.063 -0.110* 0.027 -0.401* 0.466* 1.000 0.539 0.192 0.000 0.000 0.056 0.000 0.407 0.521 0.007 0.699 0.010 0.134 0.008 0.522 0.000 0.000 (18) Official -0.164* 0.054 -0.122* -0.043 0.122* -0.001 0.171* 0.061 0.043 0.070 0.198* 0.032 -0.198* -0.154* -0.122* -0.041 -0.537* 1.000 0.000 0.191 0.003 0.289 0.003 0.979 0.000 0.135 0.291 0.087 0.000 0.441 0.000 0.000 0.003 0.334 0.000 (19) Private -0.043 -0.060 -0.061 -0.035 -0.085* 0.151* -0.105* 0.034 -0.024 0.009 -0.113* -0.017 0.343* 0.145* -0.007 0.101* -0.185* -0.433* 1.000 0.256 0.117 0.110 0.355 0.026 0.000 0.005 0.377 0.520 0.819 0.003 0.652 0.000 0.000 0.862 0.010 0.000 0.000
23
the multicollinearity issue is not at stake in our model, since none of the correlation coefficient8 are superior to 0.8. The highest correlation coefficient is 0.709 and it is
between the variables leverage and liquidity.
Although the relation is not very strong, it was nevertheless found some statistically significance correlation between z-score and all the governance variables, where independence has the highest value - 0.196. For the variable board size, it is showed to have a positive effect on z-score indicating that a greater board is associated to a more stable bank (higher z-score), which differs from previous studies. In terms of the variable of Capital Adequacy Ratio, the relation is only significant for Independence and Board Size at a significant level of 0.05, with a coefficient correlation of 0.197 and -0.146, respectively.
4.7ECONOMETRIC MODEL
Although several studies have been analysing the interaction between bank risk-taking, corporate governance and regulation, the signs of those relations are still ambiguous. Our empirical analysis consists on testing the following hypothesis:
• H1: Stronger corporate governance (i.e less concentrated ownership, small and more independent board) has a negative influence on bank risk-taking behaviour;
• H2: Stricter regulation is negatively related to bank risk.
For this purpose, we use the generalized least squared (GLS) random effect (RE) method, following Baltagi & Wu (1999) and Pathan (2009). Considering that our sample is a balanced panel data, the most suitable method is GLS. The results of the Breusch and Pagan Lagrangian multiplier test lead us to exclude the pooled Ordinary Least Squared (OLS) method. We have also not opted by the fixed effect (FE) method for our
24
model since our key explanatory variables are constant over time (Wooldridge, 2015, p. 444).
Formally, we estimate the following equation for hypothesis 1:
(1) 𝑅𝑅𝑅𝑅𝑅𝑅𝑅𝑅𝑖𝑖𝑖𝑖 = 𝛽𝛽1 + 𝛽𝛽2 (𝐿𝐿𝐿𝐿𝑅𝑅𝐿𝐿𝐿𝐿)𝑖𝑖2016 + 𝛽𝛽3 (𝑅𝑅𝑅𝑅𝐿𝐿𝑅𝑅𝑅𝑅𝑅𝑅)𝑖𝑖2016 + 𝛽𝛽4 (𝑅𝑅𝐼𝐼𝐼𝐼)𝑖𝑖2016 +
𝛽𝛽5 (𝐵𝐵𝑅𝑅)𝑖𝑖2016 + 𝛽𝛽6 (𝐶𝐶𝐶𝐶𝐼𝐼𝑅𝑅𝑅𝑅𝐶𝐶𝐿𝐿)𝑖𝑖𝑖𝑖 + 𝜀𝜀𝑖𝑖𝑖𝑖
The dependent variable RISK is a proxy for the alternatives measures of bank risk: z-score and capital adequacy ratio, where subscripts i indicates individual bank (i = 1,2,…,121) and t year (t = 2011,…,2016). The explanatory variables are LARGE, RIGHTS,
IND and BS at year 2016. LARGE is a dummy variable for large shareholder, RIGHTS is the
percentage held by the large shareholder, IND is the percentage of independent director on the board and BS indicates the number of members on the board. CONTROL considers the bank specific control variables: leverage risk, liquidity risk, bank business activity, asset quality, credit risk, efficiency, bank size and merges & acquisitions. β parameters are the estimated coefficient and ε is the error term.
In addition, we also test the hypothesis of the impact of regulation on bank risk-taking (H2) by estimating the following regression equation:
(2) 𝑅𝑅𝑅𝑅𝑅𝑅𝑅𝑅𝑖𝑖𝑖𝑖 = 𝛽𝛽1 + 𝛽𝛽2 (𝑅𝑅𝐿𝐿𝑅𝑅𝑅𝑅𝑅𝑅𝑅𝑅𝐶𝐶𝑅𝑅)𝑗𝑗2011 + 𝛽𝛽3 (𝐶𝐶𝐿𝐿𝐶𝐶𝑅𝑅𝑅𝑅𝐿𝐿𝐿𝐿)𝑗𝑗2011 +
𝛽𝛽4 (𝐶𝐶𝑂𝑂𝑂𝑂𝑅𝑅𝐶𝐶𝑅𝑅𝐿𝐿𝐿𝐿)𝑗𝑗2011 + 𝛽𝛽5 (𝐶𝐶𝑅𝑅𝑅𝑅𝑃𝑃𝐿𝐿𝑅𝑅𝐿𝐿)𝑗𝑗2011 + 𝛽𝛽6 (𝐶𝐶𝐶𝐶𝐼𝐼𝑅𝑅𝑅𝑅𝐶𝐶𝐿𝐿)𝑖𝑖𝑖𝑖+ 𝐵𝐵7 (𝐿𝐿𝐼𝐼𝐶𝐶)𝑗𝑗𝑖𝑖 +
𝜀𝜀𝑖𝑖𝑖𝑖
In this equation, RISK indicates the different variables of risk-taking (z-score and capital adequacy ratio), where subscripts i indicates individual bank (i = 1,2,…,121) and
t year (t = 2011,…,2016). The regulation index are the explanatory variables for each j
country: RESTRICT is the index of regulatory restrictions on bank activities, CAPITAL is the index of regulatory oversight of bank capital, OFFICIAL is the index of the power of
25
the bank supervisory agency and PRIVATE is the index of monitoring on the part of the private sector of the banking system. CONTROL considers the bank specific control variables: leverage risk, liquidity risk, bank business activity, asset quality, credit risk, efficiency, bank size and merges & acquisitions. This regression is clustered at a country level, hence we use GDP as a country control variable representing the Gross Domestic Product at j country and year t.
5. EMPIRICAL RESULTS
5.1BANK RISK-TAKING AND CORPORATE GOVERNANCE
In table III we present the results of regressing the equation (1). Firstly we use z-score as our bank risk measure and then we regress independently the corporate governance variables. We find that a large shareholder structure, as well as a higher percentage of voting rights, are both negatively associated with inverse insolvency risk. This outcome supports the idea that higher concentration in ownership leads to an increase in bank risk-taking (Laeven & Levine, 2009; Esty, 1998; Galai & Masulis, 1976). Furthermore, the result for independence is consistent with prior empirical analysis (Beltratti & Stulz, 2012; Erkens et al., 2012; Wang & Hsu, 2013), where a greater percentage of independent members on the board indicates a more stable bank (higher z-score).
For the board size, although an inverted association might be expected, instead a positive sign is displayed. This behaviour can be associated with the fact that through diverse director’s background, deliberations on the board meetings can benefit from additional acknowledge, ultimately resulting on following the ideal strategy, with less associated risk. Additionally, according to de Andres & Vallelado (2008), more directors is beneficial since it can result in better monitoring and advisory.
26
Table III – Generalized least squared random effect regression results between bank
risk (dependent variable - Z-score) and corporate governance
VARIABLES z-score (1) z-score (2) z-score (3) z-score (4) z-score (5) z-score (6)
LARGE -0.363* -0.208 -0.221 (0.209) (0.247) (0.262) RIGHTS -0.005* -0.001 -0.002 (0.003) (0.004) (0.004) IND 0.009** 0.010*** 0.010** (0.004) (0.004) (0.004) BS 0.045** 0.052** 0.057** (0.019) (0.021) (0.028) LEVERAGE 0.064*** (0.013) LIQUIDITY -0.002*** (0.001) BUSINESS -0.011*** (0.002) ASSETQUALITY -0.000*** (0.000) CREDIT -0.003* (0.002) EFFICIENCY -0.000** (0.000) SIZE 0.047 (0.039) M&A -0.033 (0.026) Constant 8.252*** 8.127*** 7.426*** 7.478*** 6.983*** 6.427*** (0.181) (0.128) (0.266) (0.234) (0.425) (0.682) Observations 722 722 722 722 722 702 Number of banks 121 121 121 121 121 121 Note: Robust standard errors in parentheses; *** significance at the 1% level; ** significance at the 5% level; * significance at the 10% level
When we consider all corporate governance variables together, the results change for the large shareholder and the voting rights, as in these circumstances they present no significant association with bank risk. For the board structure variables, the results remain broadly the same, with a slightly increase on the coefficient estimator. Finally, the inclusion of the control variables also indicates that the ownership structure does not have an impact on bank risk-taking. On the contrary, independence and board size are statistically significant to insolvency risk.
27
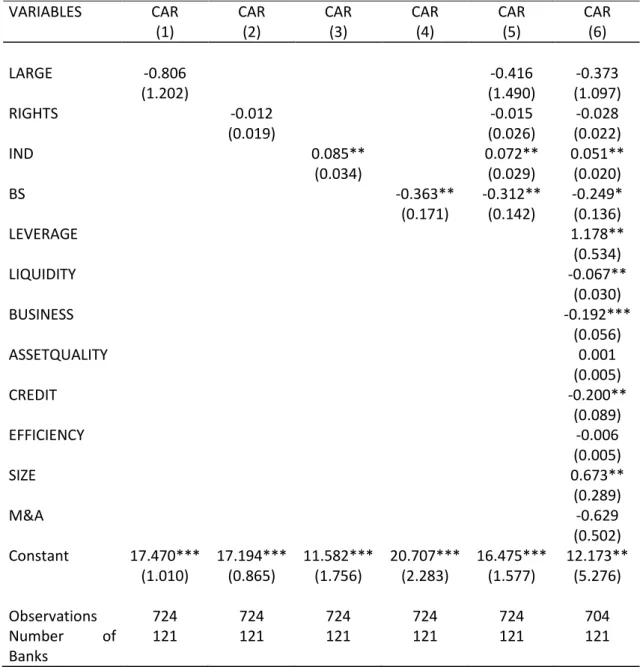
Now we consider the capital adequacy ratio as the alternative variable for bank risk for equation 1, where the results are presented in table IV.
Table IV – Generalized least squared random effect regression results between bank
risk (dependent variable - CAR) and corporate governance
VARIABLES CAR
(1) CAR (2) CAR (3) CAR (4) CAR (5) CAR (6)
LARGE -0.806 -0.416 -0.373 (1.202) (1.490) (1.097) RIGHTS -0.012 -0.015 -0.028 (0.019) (0.026) (0.022) IND 0.085** 0.072** 0.051** (0.034) (0.029) (0.020) BS -0.363** -0.312** -0.249* (0.171) (0.142) (0.136) LEVERAGE 1.178** (0.534) LIQUIDITY -0.067** (0.030) BUSINESS -0.192*** (0.056) ASSETQUALITY 0.001 (0.005) CREDIT -0.200** (0.089) EFFICIENCY -0.006 (0.005) SIZE 0.673** (0.289) M&A -0.629 (0.502) Constant 17.470*** 17.194*** 11.582*** 20.707*** 16.475*** 12.173** (1.010) (0.865) (1.756) (2.283) (1.577) (5.276) Observations 724 724 724 724 724 704 Number of Banks 121 121 121 121 121 121
Note: Robust standard errors in parentheses; *** significance at the 1% level; ** significance at the 5% level; * significance at the 10% level
We follow the previous method and the results are essentially the same. When we analyse individually the ownership structure, no significant association is found. Regarding independence, the positive relationship between capital adequacy ratio and
28
the explanatory variables remain similar, emphasizing the fact that higher percentage of independent directors as board members contributes to a less risk-taking behaviour. By regressing the board size variable, we can say that board size affects positively the bank taking behaviour. This means that banks with larger boards increase their risk-taking behaviour, supporting Battaglia & Gallo (2017) and Wang & Hsu (2013) findings. Moreover, the introduction of the control variables also does not change the results.
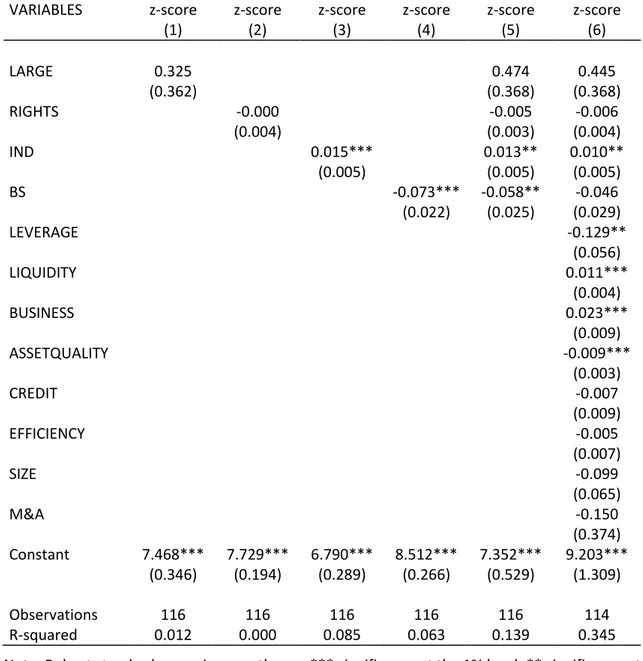
Considering the fact that corporate governance variables are from the year of 2016, we also run a regression where all of the variables are taken from that given year. In this case, we use the OLS method since we are no longer considering a panel data. The empirical analysis consists on taking into account the insolvency risk as our risk measure and examines ownership and board structure individually. The results, presented on
table V, are in line with the previous model, apart from the considerable difference in the board size variable. By regressing this variable individually, the board size affects bank stability (higher z-score) negatively, indicating that smaller board tends to take less risk, following Battaglia & Gallo (2017) and Wang & Hsu (2013) results. Furthermore, large shareholders and their voting rights have no influence on bank risk and the interaction coefficient between independence and z-score is positive. In this perspective we can state that more independent directors within a small board composition reduce the probability of a bank default. For completeness sake, we have also introduced the control variables. In this case the results remain consistent with previous models, except for the interaction between risk measure and board size, where it is found that the correlation is not significant.
All in all, the hypothesis 1 is partially supported, where little or no evidence were found for ownership concentration and distinct results were showed for board size. In terms of independence, we can affirm than more independent directors is positively associated with less risk.
29
Table V – Ordinary least squared regression results between bank risk (dependent
variable - Z-score) and corporate governance
VARIABLES z-score
(1) z-score (2) z-score (3) z-score (4) z-score (5) z-score (6)
LARGE 0.325 0.474 0.445 (0.362) (0.368) (0.368) RIGHTS -0.000 -0.005 -0.006 (0.004) (0.003) (0.004) IND 0.015*** 0.013** 0.010** (0.005) (0.005) (0.005) BS -0.073*** -0.058** -0.046 (0.022) (0.025) (0.029) LEVERAGE -0.129** (0.056) LIQUIDITY 0.011*** (0.004) BUSINESS 0.023*** (0.009) ASSETQUALITY -0.009*** (0.003) CREDIT -0.007 (0.009) EFFICIENCY -0.005 (0.007) SIZE -0.099 (0.065) M&A -0.150 (0.374) Constant 7.468*** 7.729*** 6.790*** 8.512*** 7.352*** 9.203*** (0.346) (0.194) (0.289) (0.266) (0.529) (1.309) Observations 116 116 116 116 116 114 R-squared 0.012 0.000 0.085 0.063 0.139 0.345 Note: Robust standard errors in parentheses; *** significance at the 1% level; ** significance at the 5% level; * significance at the 10% level
30
5.2BANK RISK-TAKING AND REGULATION
Table VI intends to show the relationship between bank risk-taking and regulation by using the equation (2).
First, we regress the regulations indexes individually, which are the restriction of banking activities (RESTRICT), capital stringency (CAPITAL), official power supervisory (OFFICIAL) and private monitoring (PRIVATE). We found no evidence that regulation has an impact on the bank risk-taking behaviour. Additionally, when we introduce the control variables it does not change the results of the association between regulations and bank risk-taking. Those results are not consistent with prior studies, where some interaction was found between corporate governance, bank risk and regulation. Moreover, the change of the dependent variable to capital adequacy ratio, also displays the same unexpected results.
Following Laeven & Levine (2009) empirical analysis, we also test the jointly effect of corporate governance and regulation on bank risk-taking. However, our outcome is different from theirs. Considering the results of our model, there are no evidences supporting hypothesis 2.
A possible explanation for those results might be related to the fact that, during the period covered in our model (2011-2016), European banks were already facing extremely strict regulation, due to the regulatory pressure that followed the financial crisis. For that reason, and taking into account the fierce prudential requirements already in place, there might be the case that banks had no margin to take more risk. In this perspective, small tweaks in the regulatory environment would not have an impact in banks’ risk-taking behaviour. In addition, Bouwens & Verriest (2014) also found no direct evidence between regulation and bank risk-taking.
31
Table VI – Generalized least squared random effect regression results between bank
risk (dependent variable - Z-score) and regulation
VARIABLES z-score
(1) z-score (2) z-score (3) z-score (4) z-score (5) z-score (6)
RESTRICT -0.024 -0.053 0.024 (0.053) (0.054) (0.063) CAPITAL -0.014 -0.077 0.032 (0.058) (0.081) (0.080) OFFICIAL -0.141 -0.073 -0.111 (0.097) (0.083) (0.108) PRIVATE -0.048 0.170 -0.157 (0.142) (0.218) (0.200) LEVERAGE 0.062*** (0.022) LIQUIDITY -0.003*** (0.001) BUSINESS -0.009*** (0.002) ASSETQUALITY -0.001*** (0.000) CREDIT -0.002 (0.002) EFFICIENCY -0.000 (0.000) SIZE 0.093*** (0.032) M&A -0.036 (0.024) GDP 0.443** (0.198) Constant 8.036*** 7.919*** 9.622*** 8.333*** 8.145*** 4.245* (0.359) (0.289) (1.191) (1.215) (2.182) (2.490) Observations 644 566 598 692 424 418 Number of Banks 108 95 100 116 71 71
Note: Robust standard errors in parentheses; *** significance at the 1% level; ** significance at the 5% level; * significance at the 10% level
32
5.3ROBUSTNESS TEST
Following Laeven & Levine (2009) robustness tests, we conduct two more analysis to confirm our results. First, we exclude banks considered as widely held, that is banks where the largest shareholder owns less than 10 percent of the voting rights. The reason for excluding those banks is due to the consideration of a null percentage of voting rights, instead of the exact number leading. Furthermore, we consider a bank with a large shareholder structure when an owner holds more that 20 percent of voting rights, instead of the initial 10 percent.
Even after those adjustments to the sample, the results still hold: i) no significant evidence in relation between ownership structure and bank risk, ii) the board structure has some influence on banks’ behaviour and iii) regulation does not affect banks’ risk behaviour.
33
6.
C
ONCLUSIONSThe financial crisis forced significant structural changes in the macroeconomic environment and in the financial system, particularly in the regulatory and supervisory framework. In this perspective, risk measures and corporate governance have been a trend topic among governments and supervisors. Moreover, an increasing number of studies have been presented concerning the role of corporate governance on banks’ risk-taking behaviour and how the regulatory framework affects it. The aim of our empirical analysis was to shed more light in these different subjects and the dynamics among them. From our main results, we can conclude that a large shareholder structure has no material impact on bank risk, although the board structure is significantly associated with risk. More specifically, a higher percentage of independent board members lead to a lesser probability of default. On the other hand, in certain circumstances, the board size shows some mixed results, where a positive or negative correlation with the bank risk-taking behaviour can be observed. Finally, no evidence where found in the relation between regulation and bank risk.
Moreover, our model presents some limitations regarding ownership concentration. First, we solely consider the voting rights, rather than including cash flow rights and voting rights, likewise Laeven & Levine (2009). Accordingly to empirical studies, the presence of indirect chains of control generates differences between cash flow and voting rights (Caprio et al., 2007). Second, we use the direct percentage of the voting rights, though the majority of large shareholders are corporations owned by other entities. Additionally, the information related to corporate governance concerns the year 2016, albeit all specific variables cover the period between 2011 and 2016. In this perspective, for further studies, we suggest to use the total (direct and indirect) cash flow rights instead of the direct voting rights. Also, it might be relevant to collect information related with corporate governance for the covered period (2011-2016) in order to check for sensitiveness on bank risk-taking behaviour of little changes in the corporate governance model.
34
R
EFERENCESAcharya, V., Schnabl, P., Suarez, G. (2013). Securitization without risk transfer. Journal
of Financial Economics 107 (3), 515–536.
Adams, R.B. (2012). Governance and the financial crisis. International Review of Finance 12 (1), 7–38.
Arteta, C., Carey, M., Correa, R., Kotter, J. (2013). Revenge of the streamroller: ABCP as a window on risk choices. Board of Governors of the Federal Reserve System,
International Finance Discussion Papers 1076.
Baltagi, B.H., Wu, P.X. (1999). Unequally spaced panel data regressions with AR(1) disturbances. Econometric Theory 15, 814–823.
Barako, D., Tower, G. (2007). Corporate governance and bank performance: does ownership matter? Evidence from Kenyan banking sector. Corporate Ownership
& Control 4 (2), 133–144.
Barth, J.R., Caprio, G., Levine, R. (2012). Bank Regulation and Supervision Survey, September 2012. World Bank. Available from: https://www.worldbank.org/en/research/brief/BRSS.
Basel Committee on Banking Supervision (2005). Basel II: International convergence of capital measurement and capital standards: a revised framework. Discussion
Paper Bank for International Settlements November.
Basel Committee on Banking Supervision (2009). Enhancements to the Basel II framework. Bank for International Settlements, Basel.
Basel Committee on Banking Supervision (2010). Principles for Enhancing Corporate Governance. Bank for International Settlements, Basel.
35
Basel Committee on Banking Supervision (2010). Basel III: A global regulatory framework for more resilient banks and banking systems. Bank for International
Settlements, Basel.
Basten, M., Serrano, A.S. (2018). European banks after the global financial crisis: a new landscape. Journal of Banking Regulation, 1-23
Battaglia, F., Gallo, A. (2017). Strong boards, ownership concentration and EU banks' systemic risk-taking: Evidence from financial crisis. Journal of International
Financial Markets, Institutions & Money 46, 126-146.
Beltratti, A., Stulz, R. (2012). The credit crisis around the globe: Why did some banks perform better? Journal of Financial Economics 105, 1–17.
Berger, A., Saunders, A., Scalise, J., Udell, G. (1998). The effects on bank mergers and acquisitions on small business lending. Journal of Financial Economics 50, 187– 229.
Berle, A.A., Means, G.C. (1932). The Modern Corporation and Private Property. New York: Macmillan Publishing Company.
Bernanke, B. (1983). Nonmonetary Effects of the Financial Crisis in the Propagation of the Great Depression. American Economic Review 73, 257–276.
Black, B.S., Jang, H., Woochan, K. (2006). Predicting firms’ corporate governance choices: evidence from Korea. Journal of Corporate Finance 12, 660–691.
Bouwens, J & Verriest, A (2014). Putting Skin in the Game: Managerial Ownership and Bank Risk-Taking. Harvard Business School Working Paper 14-070
Buser, S., Chen, A., Kane, E. (1981). Federal deposit insurance, regulatory policy, and optimal bank capital. Journal of Finance 36, 51–60.
Calomiris, C., Mason, J. (2003a). Consequences of US bank distress during the Depression. American Economic Review 93, 937–947.
36
Calomiris, C., Mason, J. (2003b). Fundamentals, panics and bank distress during the Depression. American Economic Review 93, 1615–1647.
Caprio, G., Laeven, L., Levine, R. (2007). Governance and bank valuation. Journal of
Financial Intermediation 16, 584-617
Casu, B., Clare, A., Sarkisyan, A., Thomas, S. (2011). Does securitization reduce credit risk taking? Empirical evidence from US bank holding companies. European Journal
of Finance 17, 769–788.
Cohen, L.J., Cornett, M.M., Marcus, A.J., Tehranian, H. (2014). Bank earnings management and tail risk during the financial crisis. Journal of Money, Credit and
Banking 46, 171–197.
Cremers, K., Ferrell, A. (2010). Thirty years of corporate governance. Firm valuation & stock returns. Yale School of Management and Harvard Law School Working
Paper.
De Andres, P., Vallelado, E. (2008). Corporate governance in banking: the role of board of directors. Journal of Banking & Finance 32, 2570–2580.
Demsetz, R., Strahan, P. (1997). Diversification, size, and risk at bank holding companies.
Journal of Money, Credit & Banking 29, 300-313.
Ellul, A., Yerramilli, V. (2013). Stronger risk controls, lower risk: evidence from U.S. Bank Holding Companies. Journal of Finance 68, 1757–1803.
Erkens, D., Hung, M., Matos, P. (2012). Corporate governance in the 2007–2008 financial crisis: evidence from financial institutions worldwide. Journal of Corporate
Finance 18, 389–411.
Esty, B. (1998). The impact of contingent liability on commercial bank risk taking. Journal
37
European Central Bank (2017). Report on financial structures. European Central Bank
Publications, October 2017
Galai, D., Masulis, R. (1976). The option pricing model and the risk factor of stock. Journal
of Financial Economics 3, 53–81.
Gornall, W., Strebulaev, I. A. (2014). Financing as a supply chain: The capital structure of banks and borrowers. Stanford University, Rock Center for Corporate
Governance, Stanford, CA, Working Paper 166
Grossman, R.S. (1992). Deposit Insurance, Regulation, and Moral Hazard in the Thrift Industry, Evidence from the1930's. American Economic Review 82 (4), 800-821. Gujarati, D.N. (2003). Basic Econometrics, 4th Ed. New York: McGraw-Hill.
Iannotta, G., Nocera, G., & Sironi, A. (2007). Ownership structure, risk and performance in the European banking industry. Journal of Banking & Finance 31, 2127–2149. Jeitschko T. D., Jeung S. D. (2005). Incentives for risk-taking in banking - A unified
approach. Journal of Banking & Finance 29, 759–777.
Jensen, M., Meckling, W. (1976). Theory of the firm: managerial behavior, agency costs, and ownership structure. Journal of Financial Economics 3, 305–360.
John, K., Litov, L., Yeung, B. (2008). Corporate governance and managerial risk taking: theory and evidence. Journal of Finance 63, 1679–1728.
John. K., Masi, S.D., Paci, A. (2016). Corporate governance in banks. Corporate
Governance: An International Review 24 (3), 303-321.
John K., Saunders A., Senbet L.W. (2000). A theory of bank regulation and management compensation. The Review of Financial Studies 13 (1), 95–125.
Keeley, M. (1990). Deposit insurance, risk, and market power in banking. American