The BI Architecture of a Luxury Fashion company
Elvira Bruno
Internship report presented as partial requirement for
obtaining the Master’s degree in Information Management
201
NOVA Information Management School
Instituto Superior de Estatística e Gestão de Informação
Universidade Nova de Lisboa
THE BI ARCHITECTURE OF A LUXURY FASHION COMPANY
by
Elvira Bruno
Internship report presented as partial requirement for obtaining the Master’s degree in Information Management, with a specialization in Knowledge Management and Business Intelligence
Advisor: Mauro Castelli
INDEX
1.
Introduction ... 1
2.
Business Intelligence System ... 2
2.1.
Business Intelligence ... 2
2.2.
Basic Concepts ... 3
2.2.1.
Database ... 3
2.2.2.
Data Warehouse ... 4
2.2.3.
Enterprise Data Warehouse ... 5
2.2.4.
Business Intelligence platforms ... 5
3.
Organizations ... 7
3.1.
SDG Group ... 7
3.2.
Kering ... 7
3.2.1.
Delivery Team ... 8
3.2.2.
SCDM2.0 ... 9
4.
IT Tools ... 11
4.1.
Stealth – AS/400 ... 11
4.2.
Oracle Exadata ... 11
4.2.1.
OLTP and OLAP ... 12
4.3.
Oracle SQL Developer ... 12
4.4.
Oracle Data Integrator 11g ... 13
4.4.1.
ODI Metadata ... 14
4.4.2.
ODI Interface ... 15
4.4.3.
ODI Procedures ... 17
4.4.4.
ODI Variables ... 17
4.4.5.
ODI Packages ... 18
4.5.
Microstrategy ... 19
4.6.
Kering EDW Standards ... 19
4.6.1.
Data warehouse Architecture ... 19
4.6.2.
Operational Layer ... 20
4.6.3.
Quality Layer ... 20
4.6.4.
EDWT Layer ... 22
4.6.5.
EDWN Layer ... 22
4.6.6.
EDWP Layer ... 25
4.6.7.
Data Mart ... 26
5.
Methodology ... 27
5.1.
Agile Methodology ... 27
5.2.
Jira Software ... 30
6.
Project ... 31
6.1.
Order Management ... 31
6.2.
Task BD-1266 ... 33
6.2.1.
DWH_QLT_EDWN_TRANSFER_RETAIL_PRICE ... 34
6.2.2.
DWH_EDWP_TRANSFER_RETAIL_PRICE ... 38
6.2.3.
DWH_EDWP_D_ORDER_ROW ... 41
7.
Conclusions ... 45
8.
Bibliography ... 46
9.
Appendix ... 48
LIST OF FIGURES
Figure 2.1 – The Data Refinery (IBM) ... 3
Figure 2.2 – Magic quadrant for Analytics and Business Intelligence Platform ... 5
Figure 2.3 – Example of a Sales KPI ... 6
Figure 3.1 – Kering SCDM2.0 ... 10
Figure 3.2 – Traditional ETL vs ODI E-LT ... 13
Figure 3.3 – Examples of ODI Metadata... 15
Figure 3.4 – Example of Mapping ... 15
Figure 3.5 – Example of Filters ... 16
Figure 3.6 – Example of an ODI interface... 16
Figure 3.7 – Example of Knowledge Module ... 16
Figure 3.8 – Example of ODI Procedure ... 17
Figure 3.9 – Example of a Refresh ODI Variable ... 17
Figure 3.10 – Example of an ODI Package ... 18
Figure 3.11 – Example of scenario execution ... 18
Figure 3.12 – Kering Data Warehouse architecture ... 19
Figure 3.13 – Process in the Quality Layer ... 21
Figure 3.14 – Example of Star Schema ... 25
Figure 3.15 – EDWP Layer ... 26
Figure 3.16 – Kering DWH Architecture, main components and data flows ... 26
Figure 3.17 – MoSCow method ... 28
Figure 3.18 – Example of the Kering SCDM2.0 Metabase ... 29
Figure 3.19 – Project approach ... 29
Figure 3.20 – Kering Jira Board Kanban ... 30
Figure 6.1 – Creation process of the table A_TRANSFER_RETAIL_PRICE ... 34
Figure 6.2 – DWH_QLT_EDWN_TRANSFER_RETAIL_PRICE ODI package ... 34
Figure 6.3 – CRT_TRANSFER_RETAIL_PRICE (QLT) TR-INS ... 35
Figure 6.4 – A_TRANSFER_RETAIL_PRICE (EDWN) Upsert – ODI Interface ... 37
Figure 6.5 – DWH_EDWP_TRASNFER_RETAIL_PRICE ODI package ... 38
Figure 6.6 – A_TRANSFER_RETAIL_PRICE (EDWP) Upsert ODI Interface ... 39
Figure 6.7 – PAR_SUGG_RETAIL_PRICE_STATUS (CFG-EDWP) interface ... 40
Figure 6.8 – D_SUGG_RETAIL_PRICE_STATUS (EDWP – SCDM) interface ... 40
Figure 6.9 – DWH_EDWP_D_ORDER_ROW ODI Package ... 41
Figure 6.10 – D_ORDER_ROW (Upsert) ... 41
Figure 6.12 – Mapping new attributes in D_ORDER_ROW (Sugg_Retail_Price_Status)
interface ... 43
Figure 6.13 – D_ORDER_ROW (Sugg_Retail_Price_Status) interface ... 43
Figure 7.1 – Microstrategy Report ... 45
LIST OF TABLES
Table 3.1 – First Normal Form example ... 22
Table 3.2 – First Normal Form example ... 23
Table 3.3 – Second Normal Form example ... 23
Table 3.4 – Second Normal Form example ... 23
Table 3.5 – Third Normal Form example ... 24
Table 3.6 – Third Normal Form example ... 24
Table 6.1 – D_ORDER Granularity ... 31
Table 6.2 – D_ORDER_ROW Granularity ... 32
Table 6.3 – New attributes to D_ORDER_ROW table ... 33
1. INTRODUCTION
In this paper will be explained what Business Intelligence means, what are the practices linked to it and the advantages obtained, translated into insights requested by the end users and the ones they didn’t know it was possible to have access.
The second chapter will describe the basic concepts related to the BI field, like an introduction of what is a Database, which is the basis for every business intelligence system. Ending with a brief presentation of BI platform, used for the creation of reports and dashboards, which make data a real information not only for the analysts but especially for end-users.
While the third chapter exposes the organization and the consultant company in which the BI task was developed and following in the fourth chapter there will be an overview of the technologies and tools used.
Then a chapter will describe the AGILE methodology, that is the procedure adopted by the organization in order to manage and monitor the entire process of development of the different tasks requested by the end-users.
Finally, the sixth chapter will explain the task subject of this thesis, the tables and the integration developed during the internship held at the organization.
2. BUSINESS INTELLIGENCE SYSTEM
This chapter introduces to an explanation of what is Business Intelligence and how it helps organizations to have success in an increasingly competitive market.
Finally, a brief introduction of the basic concepts related to this field, starting from a definition of a database to the different outputs of a BI system.
2.1.
B
USINESSI
NTELLIGENCEBusiness Intelligence is defined as "knowledge gained about a business through the use of various hardware/software technologies, which enable organizations to turn data into information” (Data Management Review, s.d.)
Since a rapid and efficient respond to the market condition and a product differentiation are the main priorities for the majority of the CEOs, in the past two decades Business Intelligence (hereafter referred as BI) has become the main investment for all the organizations that wanted to be successful.
A BI system is a collection of models, methodologies, processes, people and tools that aim to the regular and organized harvesting of organization data.
Facilitating a systematic integration and aggregation of structured and unstructured large amount of data, it contributes in the growing knowledge of new insights and analysis solutions for several and always advanced requests by the end users.
Since these techniques have become necessities for organizations, the BI market has revenues that have reached $18 billion, expected to increase even more by the end of 2020 (Gartner, 2017), especially thanks to Business Analytics and Big Data management that have contributed to the growth of BI software markets. (Bernhard Wieder, 2015)
But, be that as it may, not all the businesses have been able to take advantages by BI implementations, studies showed that almost the 80% of these projects failed to generate benefits at all or at least the profits expected (Gartner, 2015).
Keeping in mind the key priorities already listed, a BI system, used in a proper way, enables
efficiency, minimizing the cost of selling or servicing the customer, effectiveness, allowing real-time
access to customer information and differentiation, empowering a proactively manage opportunity and risk.
Figure 2.1 – The Data Refinery (IBM)
2.2. B
ASICC
ONCEPTSIt is essential to define what are the organizational basis to this major step, starting with an explanation of what is a database to the creation of an actual BI system.
2.2.1. Database
A Database (hereafter referred as DB) is a collection of information easily accessible, manageable and upgradable, that makes less difficult to its users to find the main information, thanks to its organization in a tabular format and a smart use of indexing.
Data contained in a DB represent essential knowledge of the organization customers, it offers ACID (atomicity, consistency, isolation and durability) compliance to guarantee data coherence, through a DBMS, database management systems, a software that allows users to define, manipulate , retrieve and manage data.
Among the most famous there are IBM’s Information Management System and CA’s Integrated Management System.
DB can be distinguished according to their type of content or their organizational approach, based on the first classification there are bibliographic, full text, numeric or images. While the second one classifies them in several other kinds such as relational database, distributed database, cloud database or NoSQL database.
Relational databases are composed by a set of tables, each one of them has at least one column, also called attribute, questioned through a Structured Query Language.
This kind of DB are easy to extend, and data addition can be done without modifying existing applications. In the 1970s it was developed a type of database management software called RDBMS, Relational Database Management System, like Microsoft SQL Server or Oracle Database, in order to manage these specific DBs.
Distributed Databases are divided in several physical locations and they can be homogeneous when the hardware, the operating systems and the database applications used for all the places where it is localized are the same, or heterogeneous vice-versa.
A Cloud DB is characterized by a virtualized environment, providing benefits such as the possibility to pay for storage capacity or bandwidth on a per-use basis, while for Big Data performances issues a NoSql database, useful for large sets of data, is preferred.
2.2.2. Data Warehouse
That being said, it is necessary to distinguish a Database and a Data Warehouse, starting from its definition a Data Warehouse (hereafter referred as DWH) is a “technology that aggregates structured data from one or more sources so that it can be compared and analyzed for greater business intelligence”. (Informatica, s.d.).
DBs differentiate from DWH in two aspects, first, they differentiate for their purpose, the DB has to be a container of real-time data, while the DWH is designed, on the basis of OLAP systems, to aggregate data for analytical reasons.
The second difference is based on their use, on the DB is possible to make subsequent analyses based on a snapshot of data in the current situation. While the added value of a DWH is the high-quality level of analyses, since data are already collected in a way that facilitate them, helped by the possibility to integrate BI and Analytics platforms.
In order to develop a DWH, two main approaches can be followed, by levels or by areas, the first method gives an overall view of the issues but has more cons than this simple advantage.
It gives complexity to the work progress management, since it makes difficult the synchronization of problems between the different workgroups that work in parallels, which is a typical situation in a DWH development.
Also, it requires long period before having a deliverable, this translate in a poor visibility of the project and lack of feedbacks for a lot of time from the end user.
While the second approach, by areas, even if has a limited vision till its implementation, lead to an easier managing of its work progress and less workgroups are required, with little interferences between them.
The final output is delivered relatively quickly and the great advantage is the ability to test the direction of the development every little time, being able to modify it.
2.2.3. Enterprise Data Warehouse
An Enterprise Data Warehouse – hereafter EDW – is a unified DB that refer to a single organization and specifically collects all the business information, making it accessible across the firm. It gives a cooperative approach to organize and represent data, through a classification based on a specific business division (sales, inventory, etc…).
Its main characteristic is that data are always available for analyzing and planning purposes, imposing a standard treatment to all of them, and the presence of a Metabase, which is a document containing all the business requirements, including data dictionary, institutional reporting layout design and technical information of the Business.
2.2.4. Business Intelligence platforms
BI platforms empower firms to build BI applications implementing capabilities of analysis,
information delivery and platform integration. (Gartner, s.d.)
Some examples of most known BI platforms are Microstrategy, Power BI, Tableau, Qlik View and others showed in the following image (Figure 2.2) that represents the Magic Quadrant for Analytics and Business Intelligence Platform (Gartner, 2019), a classification made by Gartner of the best tools used for this purpose.
Figure 2.2 – Magic quadrant for Analytics and Business Intelligence Platform
The outputs of these platforms are dashboards and reports, that are customizable tools which bring several advantages like a cloud accessibility, since are shareable with all the users that have a key role in the decision-making process, enhancing collaboration and communication.
Also, they improve the focus and the alignment on the relevant business information through the creation of KPIs – Key Performance Indicators – which represent a measurable value that evaluate the ability of a firm to achieve a key business objective.
KPIs vary depending on the industry or a department that is intended to analyze, but commonly they regard Marketing, Sales or Financial fields, even if there isn’t a limit of possible application areas.
3. ORGANIZATIONS
The following chapter contain an introduction of the SDG Group company, how it operates worldwide, not only in the Business Intelligence field, and an overview of the company owner of the DWH in which SDG’s developments have been carried out, exposing how the team on-site works.
3.1. SDG
G
ROUPSDG group is operating, over the last 25 years, as an international management consulting firm focused on the practices of Business Analytics, Corporate performance management and Business intelligence.
The experience and professionality leaded the firm to develop an own innovative Management intelligence practice allowing different approaches to an improved requirements management, which brought the company to be listed by Gartner in the 2018 and 2019 Market Guide for Data and Analytics Service Providers, a list containing the top 40 representative Business and Analytics consulting companies in the world. (Gartner, 2018)
The business structure is a function-process matrix structure, which means that it operates on different process divisions, classified as: Public services and utilities division, Industrial and consumer, Financial services, Public and Healthcare and Fashion and Luxury process divisions.
It is also divided in function division, in this case classified as: Predictive and streaming analysis, Visual and search analytics, Marketing and Business Intelligence transformation divisions.
3.2. K
ERINGKering is one of the largest holding company in the fashion and luxury goods market, founded in the 1963 by François Pinault, today run by his son François-Henri Pinault.
Since its establishment the company has continued to develop and grow up to become a pure player in its sector, it is the owner of several international luxury brands, some of the most well-known are: Bottega Veneta, Brioni, Saint Laurent, Gucci, Balenciaga and Alexander McQueen.
This thesis will be focused on the Kering supply chain and its decision support system, SCDM2.0, which covers the orders management, from their creation to their shipment.
Before explaining the implementation of the task, it is necessary to describe how the BI team works and how the customer requests are managed to successful fulfill their needs.
3.2.1. Delivery Team
The Delivery Team is an inside unit which work is focused on a prompt response to all, mostly minor, end user requests within existing bigger projects, making analyses on complications to regular flows or adding new useful features.
It is composed by two teams, the Front-End team (hereafter FE) , focused not only on the simple creation of any possible new metrics, but mostly on the arrangement of the report builders, used by the client, in order to make them capable to create their own report, with all the possible combination of metrics and information about their data.
While the Back-End team (hereafter BE) job is centralized on the setting-up of the new facts, dimensions or more frequently new attributes, that make possible the creation of new insights. These two teams operate in close collaboration, since their works must result from both a BE and FE analyses to reach the customer expectations.
Usually a task, that is a request that comes from a client need, start with a presentation of the requirements and a consequent first analysis, made by both the teams, about the dimension and the fact tables that will be involved, and the time effort required to completely fulfill the request.
After this first step the analysis will be presented to the Data Architects, who ensure that the implementation is conform to the EDW standards.
Only after their approval the task can reach the third step of development in the Quality Assurance environment (hereafter QA).
The QA environment is where a developer tests the upgraded procedures against data, hardware, and software that ‘closely simulate the Production environment’ (Oracle, Development, Test, QA and Production Environment, 2010).
How it is understandable from its definition, in this phase comes the real implementation, which is tested not only regarding the data results, but also in timing terms, especially when the task refers to the addition of new transformations on data, which results in more time consumed by the flow. Subsequently the tests, the next process is to implement the new developments in the production environment, where the flows concrete bring data to the end users.
3.2.2. SCDM2.0
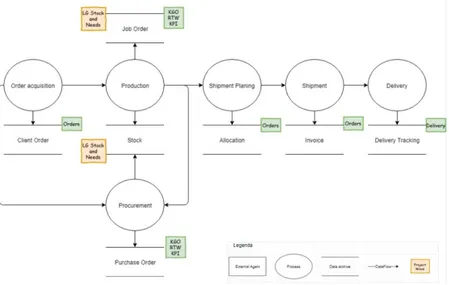
SCDM2.0, which stands for Supply Chain Data Mart, is a complex BI project whose objective is to provide a reliable and complete decision tool that gives management an end-to-end vision of the supply chain process, from order acquisition to its end, including the production process.
It is divided in four project waves: order management, Kering Group Operations KPI, End-to-end delivery, customer-oriented production, and a new one, leather goods manufacturing, that is at its early stages.
As suggested from its name, the focus of this project is the Kering supply chain, which is the alignment of all the business units within the organization, ensuring their cooperation to achieve key business goals. It can be analyzed by six decisive factors:
▪ Sustainability, ability to reduce social and environmental impacts;
▪ Efficiency, in terms of cost-optimization;
▪ Flexibility, which is the ability of the supply chain to be reorganized in order to
satisfy new evolutions of the demand customers;
▪ Velocity, the rapidity to provide final outputs to the client;
▪ Reliability, specifically during the shipping process, is the ability to succeed in all
the necessary steps, starting from the right product, to the perfect condition
for its shipment, to the correct final client;
▪ Stock optimization refer to its efficiency in the raw and final product
management.
The framework of reference is the Supply Chain Operations Reference (SCOR), a model that links business processes, performance metrics, practices and people skills into a unified structure. It gives several advantages such as improvement on business agility, inventory turns and overall operational performances, but also accelerate business process effectiveness and system implementations, giving support to organizational learning goals (Apics, s.d.).
4. IT TOOLS
In this chapter there will be described the source system, the Data Base Management System (DBMS) and the business intelligence tools used by the company. After the first explanation will be presented the main rules which refer all the developer teams.
4.1. S
TEALTH–
AS/400
Stealth is an integrated technologic platform which manage all the production activities, retail sales and channel distributions within a luxury and fashion organization.
It is based on Application System 400 (AS/400), which includes DB2/400 RDBMS and support for security and multiple users. Since the company is the owner of several brands, the management system is dived into libraries, each one for every brand owned. Hence, to access at the different libraries is necessary to specify the name ST3DB, which stands for the Stealth platform, then a letter,
P or F indicates if it is a custom library (P) or a standard library (F), then three characters used to
recall the specific company (i.e. GUC for Guccio Gucci, or LOG for logistic, etc…)
Moreover, a table can be stored in more than one library, hence the ETL process of extraction will loop on the same table throughout all the libraries the table is contained.
4.2. O
RACLEE
XADATAOracle Exadata is a database machine designed by Oracle to enhance database functionalities. It is a
composite database server machine that adopts Oracle database software, it is defined as the fastest database, able to deliver higher performance and capacity at lower costs than other platforms, even in huge data warehouse. (Gartner, 2015)
The goal is reached shifting database algorithms and intelligence into storage and networking rather than traditional processing layers
.
(Oracle Corporation, 2017) .It supports several databases systems such as OLTP (Online Transaction Processing) and OLAP (Online Analytical Processing).
4.2.1. OLTP and OLAP
There are several systems which support the business activities, in the field of Business Intelligence, and from this point of view it is possible to simplify and schematize the different software, dividing them into 2 categories: operational or transactional system, used for operating and management activities, and analysis system, which help strategic and decision-making activities.
OLTP systems, record, change and show real-time data according to the several Business Units. In
this kind of systems data are distributed across multiple tables for speed and simplicity of loading and updating reasons.
The information is inserted and modified only once, avoiding redundancies, even if the queries are complex, there aren’t any particular problems, since they are rarely modified, and it is done only from expert developers.
Due to its nature of support system for daily executive operations, an OLTP system is characterized by a massive use of transactions, that are operations in sequence viewed as a single set, executed as a single block, which is successfully executed or failed in its entirely, an example is a booking system for an hotel chain, in which queries are quickly processed and usually return few records.
While OLAP system don’t work on recent data, but rather on a wider timeframe. They are updated from operational data periodically and they continually grow since they keep historical data.
This kind of systems is used to analyze data from different perspectives, or dimensions, hence they are also called Multidimensional Systems.
Each dimension harvests the criteria on the basis of which data will be used, then the dimension is shown in a cubic structure, which intersection identifies one or more measures.
Data stored in these systems come from OLTP systems and they are used to plan, solve problems and support decisions.
4.3. O
RACLESQL
D
EVELOPEROracle SQL Developer is an integrated development environment which uses the domain-specific
language SQL, that lead to an easier development and management of Oracle Database, through the use of worksheet for running queries and scripts, it allows an entire end-to-end development of PL/SQL applications. (Umamageswaran and Goindi, 2017)
It enhances productivity and simplifies database development tasks, even connecting with third-party that are not Oracle databases.
4.4. O
RACLED
ATAI
NTEGRATOR11
GOracle Data Integrator (hereafter ODI) is a data integration software based on an exclusive ELT
(Extract, Load and Transform) architecture, providing a graphical environment to create, manage and maintaining data transformation and integration processes in business intelligence systems.
The main advantages of ODI are:
▪ A simpler and more powerful architecture, rather than an ETL Server located
between the source and the target servers, the E-LT architecture uses both of
them to perform complex transformations.
Figure 4.1 – Traditional ETL vs ODI E-LT
▪ Wider connectivity, supporting all the RDBMSs and Data Warehousing
platforms.
▪ Better performances, capable to execute data transformations exploiting a
set-based level, through the use of indexes, giving higher performances.
▪ Data quality antiviral, it does a preventive check on data, to prevent the
insertion of faulty data in the target application.
▪ Faster development and maintenance, thanks to the declarative rules driven
approach.
▪ Platform independence.
▪ Cost reduction, through the elimination of the ETL server and engine, enables
not only a cutting of software acquisition costs but also the costs for their
maintenance.
ODI comprises several components, such as:
▪ Repository is the central component of ODI architecture, capable to stores IT
infrastructure, metadata, projects and scenarios information. Its architecture is
designed to allow several separated environments that exchange metadata and
scenarios (such as development and production environments). It is composed
of a Master Repository, that stores information about security, topology,
versioned and archived objects; And one or more Work Repositories, that
assemble developed objects and collect information for Models, including
schema definitions, datastores, metadata, columns definition, data quality
constraints, but also Projects information, regarding business rules, packages,
procedures, etc… and finally details on Scenario execution and scheduling
information;
▪ a web application, Lightweight Designer, that aim to view and edit objects in
the repository through a web browser;
▪ ODI Public Web Services, which allow users to leverage ODI features in a
Service-oriented architecture.
In the following paragraphs will be explained in details, the objects used by a ODI user to develop and maintain data flows.
4.4.1. ODI Metadata
A Metadata is a description of data itself, its purpose, how it is used, and the systems used to manage it, including data model definitions, data transformation descriptions, process and flow information, business intelligence description or any other meaningful information about it. (Oracle , 2012)
It is not related only to DWH or BI, but also to other organization architectures like business, application, data and technology.
Metadata are the center in the ODI architecture, contained in a comprehensive metadata repository, easily accessible, an SDK – Software Development Kit. This repository includes all the domains used in data integration, which are security information, that refer to users and relative access privileges within the ODI platform, topology information, list of technologies, definition of servers, schemas, contexts and languages.
There are also data models, including descriptions of schemas, datastore structures, cross references and so on, integration projects, containing declarative and transformation rules, mappings, packages, folders, knowledge modules, etc…, finally there is also an execution domain, with information about load plans, scenarios, scheduling information and logs.
A key process, regarding this repository, is the reverse engineering, that loads in it metadata from data storage, like DB, or even files.
Figure 4.2 – Examples of ODI Metadata
4.4.2. ODI Interface
An ODI interface is an object that loads into a specific target datastore, data coming from one or more source table, based on requested rules, which can be translated as transformation tools, such as:
▪ Mapping, executed by a relational database server at run-time, is a
transformation made up for attribute valorization coming from the source
datastore to the target.
Figure 4.3 – Example of Mapping
▪ Filter, it’s a SQL clause applied on the source. Used to reduce the group of data
for a specific attribute valorization that is or is not required on the target.
Figure 4.4 – Example of Filters
▪ Join, implemented as a SQL clause, it is used to combine data through different
tables. There are different kinds of join, depending on the resulted data that is
wanted to obtain: cross-join, inner join, left outer join, right outer join and full
outer join.
Figure 4.5 – Example of an ODI interface
▪ Declarative rules are transformed into knowledge modules, that are codes
templates containing the sequence of commands that the interface has to
perform, these modules vary depending on the role of the interface, such as
loading, integration, checking or journalizing.
4.4.3. ODI Procedures
An ODI procedure is a set of commands, used to group actions that cannot be performed within an interface framework. Executable in a package, it is a reusable object, composed of command lines trying to make as generic as possible.
Figure 4.7 – Example of ODI Procedure
4.4.4. ODI Variables
An ODI Variable is an object that stores a single value, that can be a string, number, date and so on. A variable can be a set variable, when is a pre-defined static value, or declared, when the value is a parameter passed when running a scenario.
It can be a refresh variable, as the name suggest, its value change depending on the execution of a statement, or evaluate, used to evaluate an expression and branch the execution sequence in a package.
4.4.5. ODI Packages
Figure 4.9 – Example of an ODI Package
An ODI package is the main object used to organize the complete flow path, which determines the where and how data will be extracted, loaded, transformed and integrated into the target datastore. The path is composed by one or several steps, which can be any of the objects previously defined, and each one of them can ends in a successfully or failure way.
The package can be executed through the generation of a scenario, that contain the translated XML file for each step of the package, once it is generated, if the package is modified, it will receive the changes only by a regeneration.
Finally, the execution of a scenario can be monitored, step by step, thanks to the ODI Operator Navigator.
4.5. M
ICROSTRATEGYMicrostrategy is a software, developed by MicroStrategy Incorporated company, used to analyze internal and external data in order to help the decision-making process.
It uses business intelligence and predictive analytics to search through and perform analytics on big data from a variety of sources, like data warehouse, excel files and so on, making able business stakeholders to transform it into action-driving insights, with intuitive and powerful tools capable to prepare, visualize and map organization data and share it with anyone interested.
Kering offers, through this software, preconstructed prompt reports, which contains all the major details that users request, giving them the possibility to customize the prompts, to satisfy the always changing questions about their company.
4.6. K
ERINGEDW
S
TANDARDSIn this paragraph will be given an overview of the logical and physical architecture of the Enterprise Data Warehouse, defining each layer with its name conventions and guidelines, to follow when new tables are created or modified, in order to work in an aligned environment.
4.6.1. Data warehouse Architecture
The Kering Data Warehouse architecture is divided in different layers, as shown in the following image that gives an overall graphical representation, each one of them represents a step of the data extraction, transformation and loading path.
Some fundamental points to keep in mind in this architecture are:
▪ Each layer reads data either from the previous one or from other tables of the
same layer.
▪ Each table, in the Operational layer, is loaded only once from its source system,
without any transformation applied to its data.
▪ Processes should only access the certified entity needed in the Normalized
Layer and eventually the Publication Layer, avoiding any direct access to the
original one in the Operational Layer.
4.6.2. Operational Layer
This layer implements the exchange between the Source System and the Data Warehouse. Tables are loaded in a one to one scale with the original source system, except for some technical attributes (PARTITION_KEY, AUDIT_ID and so on). Column names are modified in accordance with a shared business dictionary.
Regarding the loading process, historical data is kept, and physical deletions should not be performed, besides small number of cases, and replaced by logical ones.
Tables are named with the original name, preceded by the name of the source system where the data came from in this way: SourceSystem_FormerTableName.
Furthermore, entities may be partitioned in order to allow parallel processing or to reflect the physical segregation in the source environment.
A new attribute added in this layer, over the original attributes, which deserve a particular mention, is the AUDIT_ID, it traces the Audit process that created or modified a certain record (it can be split into two different fields, if there is the need to keep both date of first creation of the record and date of last modification).
Eventually it has great importance in the following layers, to make possible some processes based on its value.
4.6.3. Quality Layer
This layer implements the quality process, checking constraints that must be verified in order to certify a record to the next level, providing specific procedures which allow a full implementation of a real quality process, in particular all the constraints must be defined on a “certification table” created in this schema (QLT).
Input data from the Operational Layer, that pass the checking process is moved eventually into an output table in the quality schema (CRT), while the other that violate one or several constraints are moved or copied into an Error table, depending on the constraint severity level, ERROR when the constraint is very strong, which means that all the records violating it cannot be promoted to the Normalized Layer, and WARNING when the constraint is weak, which means that records violating it are still promoted but are tagged with a specific value.
Figure 4.12 – Process in the Quality Layer
The “final” table reflects the original structure plus possible new attributes in order to provide all necessary new information, coming from joins with other tables.
They must preserve the maximum detail level or eventually increasing it if needed for rule checking reasons.
For each table loaded from the Operational Layer two tables will be created with the following naming: CRT_Entity and ERR_Entity, the first one contains all the records, which are ready to be loaded into the Normalized layer, while the second table, automatically created by ODI Knowledge Module, has the ones that are discarded with the relative reasons.
The quality constraints that can be defined belong to the following categories:
▪ Primary or Alternate keys, checking that records are not duplicated for primary
key, which is an attribute or a combination of them, that identify in a unique
way a record.
▪ Foreign key, a reference constraint with tables in the Normalized Layer,
specified through a direct reference (column to column) or through more
complex expressions involving functions or one or many columns.
▪ Check constraints, also known as business constraints, based on functional or
business driven conditions, that need to be verified by each record.
▪ Mandatory fields, meaning that a certain field must be valorized and cannot
have a null value.
4.6.4. EDWT Layer
In the Transformation Layer is performed the functional transformation process, hence data coming from Operational Layer, after being certified by the quality process is transformed into third normal form, made homogeneous and integrated into the Normalized Layer data model.
The process may involve one or more steps, which may generate temporary tables. These tables should be created in a dedicated schema and should never be referenced from outside, nor they could be reused by other processes. While in case of simple transformations they must be performed directly to the target table in the Normalized Layer.
The name used by these work tables, used to support integration process in the DWH, except for suitably justified exceptions, will be as the following example: WKn_Entity, where n is a numeric incremental value (from 0 to N) corresponding to the number of work tables created.
Work tables are always populated in truncate/insert mode and no historical data is kept, all functional transformations are implemented in order to guarantee that records achieved the characteristics needed to be loaded into the Normalized layer.
4.6.5. EDWN Layer
The Normalized layer stores the consistent, integrated and certified version of data with the maximum level of details.
Normalization is the process of minimizing redundancy from a relation or set of relations, which can cause insertion, deletion or upgrade of anomalies. Normal forms are used for this purpose and they are divided in 3 main different types:
▪ 1st Normal form
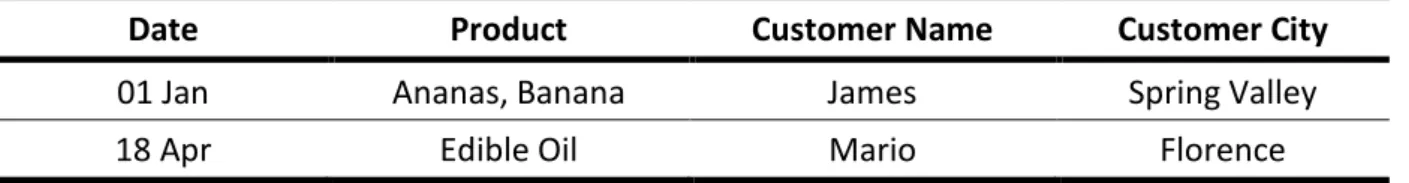
A relation is in first normal form if it does not contain any composite or multi-valued attribute, meaning that each attribute in that relation is a single value.
The following table is not normalized in the first form, since the attribute PRODUCT of the first record has more than a single value. While in the second table has been decomposed into a first normal form
Date
Product
Customer Name
Customer City
01 Jan
Ananas, Banana
James
Spring Valley
18 Apr
Edible Oil
Mario
Florence
Date
Product
Customer Name
Customer City
01 Jan
Ananas
James
Spring Valley
01 Jan
Banana
James
Spring Valley
18 Apr
Edible Oil
Mario
Florence
Table 4.2 – First Normal Form example
▪ 2nd Normal form
A table is in second normal form if and only if it is in First Normal Form and every non-prime attribute of the table is dependent on the whole of a candidate key.
In other words, the candidate primary key in the previous example could be the combination of the attributes DATE, PRODUCT and CUSTOMER NAME, but not the CUSTOMER CITY that is a non-prime attribute.
The latter is only dependent by the attribute CUSTOMER NAME and not also from the others, this means that it doesn’t respect the second normal form, hence in order to bring this table to the 2nd
normal form, It is necessary to break this table in the following way.
Date
Product
Customer Name
01 Jan
Ananas, Banana
James
18 Apr
Edible Oil
Mario
Table 4.3 – Second Normal Form example
Customer Name
Customer City
James
Spring Valley
Mario
Florence
Table 4.4 – Second Normal Form example
▪ 3rd Normal Form
Finally, the third normal form requires that every non-prime attribute of the table must be directly dependent on every key of the table.
For example, supposing that to the previous table, with customer name and customer city attributes, is added the zip code field, this will be a non-prime attribute, dependent on the whole of the key (Customer name), but in this case customer city is only transitively dependent on Customer name through the Zip code attribute, hence the table doesn’t respect the third normal form.
A new table, in order to respect this last normal form could be divided in the following way:
Customer Name
Zip Code
James
122-344
Mario
50144
Table 4.5 – Third Normal Form example
Zip Code
Customer City
122-344
Spring Valley
50144
Florence
Table 4.6 – Third Normal Form example
In this case, the EDWN layer should be designed with a functional prospective and should contain all the relevant information that has to be stored in the 3rd normal form, the pros of this choice is a greater flexibility, the ability to answer to more business questions. It typically requires less storage and it is easier to modify, even if is more complex to maintain and requires more joins between tables.
It contains only certified and consolidated data which belongs to one of the following categories:
▪ Dimension tables, used both for domain tables, which stores abstract entities,
such as types or finite-values domain, and real entities tables, which refer to
real entities, such as Store, Sale Assistants and so on; They should be named as
follow: D_DomainorEntityName
▪ Fact tables, used to store “generic transaction” information. Specifically, they
represent collection of facts regarding organization processes, containing a set
of measures, such as numeric attributes describing the performance of the
behavior of a company process, like sales or stocks. Their naming must reflect
what is modeled in the table, making its fact and granularity intuitive, in this
way: F_MetricName_Granularity, where the Metric name is the name of the
fact being measured, i.e. F_SALE, and the Granularity is not mandatory and
should be discussed with the Data Warehouse Manager.
▪ Associate tables, used to store relations among dimension tables, similar to
fact tables, differentiate from them since they do not contain quantitative
measures. However, there are some exceptions, for example it may be
necessary to calculate an aggregate measure that depends on a set of rows and
not on the row itself, i.e. A_SALE_SA_DEPT table stores the information about
the number of different product categories sold by a Sale Assistant in a single
ticket.
The naming form to follow in this case is: A_AssociationName or
A_DimensionA_DimensionB.
4.6.6. EDWP Layer
The Publication layer stores data “ready to be consumed” by the final user, either directly or after being distributed to the various data marts.
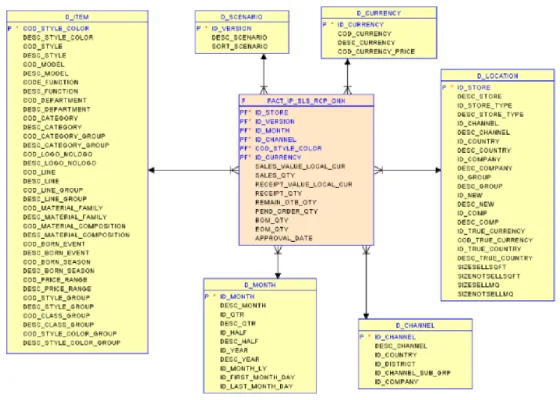
Information are organized in dimensional manner, which is the closer representation to the business user point of view. A common bus of dimension tables is shared among all the star schema, meaning that the EDWP layer is a Constellation of Star Schemas.
Figure 4.13 – Example of Star Schema
Quality and Validity tags (and eventually other fields) added in the previous layers can be used to decide if a record can be published or not into a certain fact table. Publishing rules are imposed, defined in a high-level language and then used to control a rule engine used to filter out records. For example, a same input record can be published into a certain star schema and at the same time discarded from another one, depending on the business area of interest.
These rules are implementable using ODI with a PL-SQL function publication_filter, that uses the flow name and the fields as input, and returns a SQL expression.
Figure 4.14 – EDWP Layer
4.6.7. Data Mart
Finally, the last process is called distribution process, where data is simply distributed from the Publication Layer to the different Data Marts.
A Data Mart is a subject oriented archive that stores data and uses the retrieved set of information to assist and support the requirements involved within a particular business function or enterprise department.
The table structures in these two layers are identical, meaning that no transformations are allowed, it is a mere copy of data from one layer to the marts
5. METHODOLOGY
This chapter describes the Agile methodology, used for the SCDM2.0 project, the context in which it was used, the principles adopted, and the software used to manage it.
5.1.
A
GILEM
ETHODOLOGYThe AGILE methodology, developed by APMG International, is an alternative project management, typically used in BI software development. Among all its advantages, plays an important role the help given to teams to respond to unpredictability through incremental and iterative work cadences, called waves.
It leads not only to a great reduction of development costs and time, but also to a balance between standards, rigor and visibility required for good project management and fast-pace, change and empowerment.
It is based on 8 principles:
▪ Focus on the business needs, means that first thing first is necessary to
understand and document them, then create a valid business case easy to
understand and set a Minimum Usable Subset to deliver, ensuring that it
contains the most important requirements.
▪ Deliver on time, make it possible through the timebox action of the work in
manageable chunks of time and focusing on business priorities using MoSCow
method.
▪ Collaborate, involving the right stakeholders, at the right time, throughout the
project, encouraging the involvement of the business representatives and
finally building a one-team culture.
▪ Never compromise quality, meaning that is necessary to set the level of quality,
before the development begin, setting continuous tests on all the stages, and
finally design and documenting appropriately.
▪ Built incrementally from firm foundations, carrying-out appropriate analyses,
formally re-assess priorities and informally re-assess ongoing project viability
with each delivered increment.
▪ Develop iteratively, taking out feedbacks from each iteration with the business,
embracing change, since the right solution will not evolve without it, useful also
to encourage creativity, experimentation and learning.
▪ Communicate continuously and clearly, encouraging informal, face-to-face
communication at all levels, demonstrate the evolving solution early and often,
using visual communication practices such as Modelling and Prototyping,
keeping honesty and transparency in all communications.
▪ Demonstrate control, making plans and progress visible to all, measuring
progress through focus on delivery of products rather than completed
activities, evaluating continuously project viability based on the business
objectives.
Figure 5.1 – MoSCow method In this case the approach has been divided in different steps:
1.
Definition of a metabase, which is a document that contain all the business
requirements, including a data dictionary, the institutional reporting layout design
and all the technical information of the Business;
The metabase contains all the detailed requirements for an EDW project based on
the business requests and a preliminary result from source data profiling. It allows to
retrieve any kind of information of project requirements, after the user acceptation,
a clear source and target table mapping and technical consideration useful for ETL
and report developers.
Figure 5.2 – Example of the Kering SCDM2.0 Metabase
2.
Data warehouse and Business Intelligence implementation, including all the
logical data model design and the ETL implementation;
3.
Training, in which developers will be trained, also through the providing of the
documentation;
4.
Reporting, in which are created the reports from business requirements and
delivered;
5.
Testing, which include test and data validations, performance test, security
implementation and report publishing.
5.2. J
IRAS
OFTWAREJira is a proprietary issue tracking software used to capture any kind of unit of work, which could
refer to an issue, a bug, a project, a task and so on.
It operates within a predefined workflow, which typically represents processes accomplished by an organization and that is a set of statuses, which are the states of an issue at a specific point in the workflow, and transitions, that are links between statuses which enables the issue to change from one to another through its lifecycle.
The single objects and the workflow can be predefined or customized for specific requirements, whether they must be simpler or more complex. (Atlassian, s.d.) For example, in Kering, it is used a Kanban board, one of the most effective way to visualize a workflow which enables the team to gain control over what is to be done or on working at a certain time. This type of board allows a definition of different roles, distinguished also for parts of project, which corresponds more or less privileges to modify it. (Kanbanize, s.d.)
The great advantages come from the possibility from each user, working on a project, to identify only issues assigned to him, or to an emphasized collaboration, allowed by the use of mentioning comments shared at the same time with all the team members, so they can be on the same page throughout the project.
6. PROJECT
This chapter is dedicated to the explanation of one of the tasks developed by the Delivery Team in the SCDM2.0 project specifically for the order management flow.
In order to proceed with the task resolution, it is necessary to describe the fact and dimension tables that have been modified.
6.1. O
RDERM
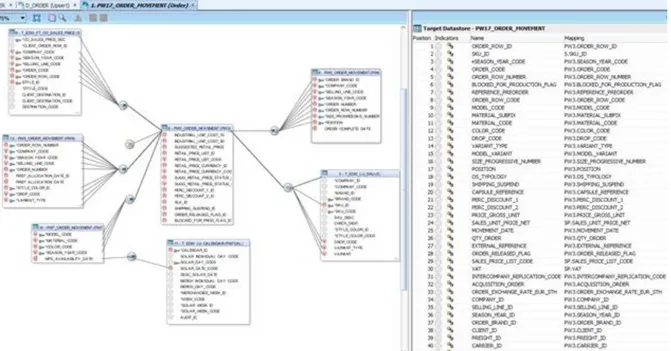
ANAGEMENTThe order management flow focuses on the integration of the F_ORDER_MOVEMENT table, which is the fact table that includes, as its name says, all the movements related to the orders from their placement to their invoicing.
The two main dimension tables, that load data into this fact table are the D_ORDER and the D_ORDER_ROW. The first one contains the information about the client order header while the second one has the details for each row.
Another fact table, that load data into the F_ORDER_MOVEMENT, is the F_ORDER which has information about the quantity of each product ordered.
The three tables have different granularities, the D_ORDER is the table with the highest granularity:
D_ORDER
COMPANY_CODE
SELLING_LINE_CODE
SEASON_YEAR_CODE
ORDER_NUMBER
While the D_ORDER_ROW granularity is:
D_ORDER_ROW
COMPANY_CODE
SELLING_LINE_CODE
SEASON_YEAR_CODE
ORDER_NUMBER
ORDER_ROW_NUMBER
Table 6.2 – D_ORDER_ROW Granularity
Finally, the one of the F_ORDER is:
F_ORDER
COMPANY_CODE
SELLING_LINE_CODE
SEASON_YEAR_CODE
ORDER_NUMBER
ORDER_ROW_NUMBER
SIZE_PROGRESSIVE_NUMBER
POSITION
MOVEMENT_DATE
The F_ORDER_MOVEMENT table was requested in order to have more insights into orders and their invoices, hence their shipments. An example of measures explicable using this table is the average time that a certain kind of product takes from its ordering process to its shipment.
For the task topic of the next chapter, the request was to add a detail of a suggested retail price used for a specific client, using the relative currency. Such as the total amount, quantity ordered multiplied for the retail price used for that client, in Chinese Yuan, if the user who control this measure wants it.
6.2. T
ASKBD-1266
The main goal of the task was focused on the fulfilment for the request of adding several new metrics based on two new attributes Transfer Price and Suggested Retail Price to the already existing table D_ORDER_ROW.
In order to create the new metrics requested, it was necessary to add the following attributes to the D_ORDER_ROW table.
New Attribute Name
Datatype
SUGGESTED_RETAIL_PRICE NUMBER(23,0)
RETAIL_PRICE_LIST_ID NUMBER(12,0)
RETAIL_PRICE_LIST_CODE VARCHAR2(4 CHAR)
RETAIL_PRICE_CURRENCY_ID NUMBER(6,0)
RETAIL_PRICE_CURRENCY_CODE VARCHAR2(4 CHAR) SUGG_RETAIL_PRICE_STATUS_ID NUMBER(5,0) SUGG_RETAIL_PRICE_STATUS_CODE VARCHAR2(4 CHAR)
Table 6.3 – New attributes to D_ORDER_ROW table
The process made up in order to add these attributes follow a series of steps, first, it was created an associative table named A_TRANSFER_RETAIL_PRICE, which links the client information with the sales price and the relative currency.
Data for this table were stored in a source table T_STG_WK0_TTB_TABLES, also called table of tables, which contain all the lookup information related to the orders retrieved directly from STEALTH. In order to obtain the information requested for the associative table, it was necessary to filter the table of tables by attribute PROCEDURE_CODE = 45, TABLE_CODE = ‘RELC’ and TRIM(NULL_RECORD_FLAG) is NULL.
The last filter is used to consider only the valid records, because the not valid ones have the attribute NULL_RECORD_FLAG valorized to N.
Figure 6.1 – Creation process of the table A_TRANSFER_RETAIL_PRICE
As shown in the image the table was created in the QLT, EDWN and EDWP layers, based on the standards rules. This process is translated into two ODI packages, named: DWH_QLT_EDWN_TRANSFER_RETAIL_PRICE and DWH_EDWP_TRANSFER_RETAIL_PRICE. This because the tables for the QLT and the EDWN layers have a different AUDIT_AREA from the EDWP table.
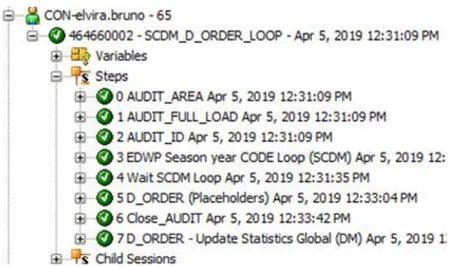
6.2.1. DWH_QLT_EDWN_TRANSFER_RETAIL_PRICE
The flow above is used to carry data into the QLT layer and EDWN layer. The steps executed are the following:
1. Get the variable AUDIT_AREA in set
-“EDWN_TRANS_RET_PRI”;
2.
Get the variable AUDIT_ID in refresh, meaning that each time the package is
executed a new AUDIT_ID value is generated, which identify each process executed;
3.
Execution of the interface CRT_TRANSFER_RETAIL_PRICE (QLT) TR-INS;
4.
Execution of the interface A_TRANSFER_RETAIL_PRICE (EDWN) UPSERT;
5.
Procedure Close_AUDIT in ‘ERROR’ status if there is a problem in one of the
two interfaces;
6.
Procedure Close_AUDIT in ‘DONE’ status if the flow ends correctly.
The following image shows the new interface CRT_TRANSFER_RETAIL_PRICE (QLT) TR-INS created, in which the table of the Quality layer is populated from the source table, present in the Staging layer based on specifics constraints.
Figure 6.3 – CRT_TRANSFER_RETAIL_PRICE (QLT) TR-INS
The source table is the STG.T_STG_WK0_TTB_TABLES, it is not partitioned, and its primary key is composed by the attributes: PROCEDURE_CODE, TABLE_CODE, COMPANY_CODE, LANGUAGE_CODE, TABLE_KEY and PROGRESSIVE_NR.
The target object, in this interface, is the CRT_TRANSFER_RETAIL_PRICE table, created in the quality layer. The integration strategy applied is the Control-Append procedure, this means that the table is truncated, emptied of all its data, every time the package is executed and then populated again with the same, or possible new, data.
Its primary key is composed by the attributes:
▪ CLIENT_CODE
▪ TRANSFER_PRICE_LIST_CODE
▪ TRASNFER_PRICE_LIST_CURRENCY
which represent the business rule requested in order to add the new attributes Suggested_Retail_Price and related to the D_ORDER_ROW table.
As it was said, data integrated in the quality layer passes through a certification process, after which data can be loaded in the next layers.
This process is composed by a certain number of constraints with different severities, in this case all of them check the values of 4 attributes of the table which have to be listed in other lookup tables in order to be accepted.
▪ FK_RETAIL_PRICE_CURRENCY_CODE, this constraint is requested in order to
take only attribute RETAIL_PRICE_CURRENCY_CODE which value has to be
compliant with the lookup table T_EDW_LU_CURRENCY. The expression to test
this requirement is:
UPPER(TRIM(CRT.RETAIL_PRICE_CURRENCY_CODE)) = TRIM(C.CURRENCY_SHORT_DESC)
where CRT is the alias used to recall the table CRT_TRANSFER_RETAIL_PRICE,
while the C, used to recall the table T_EDW_LU_CURRENCY. The constraint has
a WARNING severity, this means that the record will be loaded but the Quality
Tag attribute will have the WARNING Value and it will be also collected in the
ERROR table.
The Oracle/PLSQL UPPER function is used to returns strings with all the letters in uppercase.
▪ FK_RETAIL_PRICE_LIST_CODE, this constraint is requested in order to take only
attribute RETAIL_PRICE_LIST_CODE which value has to be compliant with the
lookup table T_EDW_LU_PRICE_LIST_GENERAL. The expression to test this
requirement is:
UPPER(TRIM(CRT.RETAIL_PRICE_LIST_CODE)) = TRIM(P.PRICE_LIST_CODE)
where the P is used to recall the table T_EDW_LU_PRICE_LIST_GENERAL. The
constraint has a WARNING severity, this means that the record will be loaded
but the Quality Tag attribute will have the WARNING Value and it will be also
collected in the ERROR table.
▪ FK_TRANSFER_PRICE_CURRENCY_CODE, this constraint is requested in order to
take only attribute TRANSFER_PRICE_CURRENCY_CODE which value has to be
compliant with the lookup table T_EDW_LU_PRICE_LIST_GENERAL. The
expression to test this requirement is:
UPPER(TRIM(CRT.TRANSFER_PRICE_CURRENCY_CODE)) = TRIM(C.CURRENCY_SHORT_CODE)
The alias are the same used in the FK_RETAIL_PRICE_CURRENCY_CODE
constraint, but in this case it has an ERROR severity, because the attribute
represents the primary key, hence it cannot be accepted with a wrong value,
this means that the record will not pass the check and it will be only collected in
the ERROR table.
▪ FK_TRANSFER_PRICE_LIST_CODE, this constraint is requested in order to take
only attribute TRANSFER_PRICE_LIST_CODE which value has to be compliant
with the lookup table T_EDW_LU_CURRENCY. The expression to test this
requirement is:
UPPER(TRIM(CRT.TRANSFER_PRICE_LIST_CODE)) = TRIM(P.PRICE_LIST_CODE)
The alias are the same used in the FK_RETAIL_PRICE_LIST_CODE constraint, but
in this case it has an ERROR severity, because also in this case the attribute
represents the primary key, hence it cannot be accepted with a wrong value,
this means that the record will not pass the check and it will be only collected in
the ERROR table.
While the second interface A_TRANSFER_RETAIL_PRICE (EDWN) UPSERT has a simple mapping one to one from the CRT table to the one created in the EDWN layer as shown in the following image:
The target table has the same primary key of the source table, no constraints are checked in this interface while the integration strategy used is an Insert-Update, this means that each time the package is executed records can be inserted or the ones already loaded can be updated.
6.2.2. DWH_EDWP_TRANSFER_RETAIL_PRICE
The next step is the creation of a new package, in which data will be loaded in the EDWP layer and a new parametric table will be integrated in the EDWP and in the SCDM layer, the latter is the name also used to refer to the Data Mart.
Figure 6.5 – DWH_EDWP_TRASNFER_RETAIL_PRICE ODI package
The steps executed are the following:
1. Get the variable AUDIT_AREA in set
-“EDWP_TRANS_RET_PRI”;
2.
Get the variable AUDIT_ID in refresh;
3.
Execution of the interface A_TRANSFER_RETAIL_PRICE (EDWP) UPSERT;
4.
Execution of the interface PAR_SUGG_RETAIL_PRICE_STATUS (CFG-EDWP);
5.
Execution of the interface D_SUGG_RETAIL_PRICE_STATUS (EDWP-SCDM);
6.
Procedure Close_AUDIT in ‘ERROR’ status if there is a problem in one of the
three interfaces;
7.
Procedure Close_AUDIT in ‘DONE’ status if the flow ends correctly.
In the interface A_TRANSFER_RETAIL_PRICE (EDWP) Upsert, data are loaded one to one, in addition are added the IDs attributes, which refer to the codes already existing in the EDWN table, obtained by the joins with the lookup tables, T_EDW_LU_CURRENCY, T_EDW_LU_PRICE_LIST_GENERAL and T_EDW_LU_CORPORATE_CLIENT as shown in the following image:
Figure 6.6 – A_TRANSFER_RETAIL_PRICE (EDWP) Upsert ODI Interface
The alias used in the joins are: T, for the A_TRANSFER_RETAIL_PRICE table, CL for the table T_EDW_LU_CORPORATE_CLIENT, P and P2 for the table T_EDW_LU_PRICE_LIST_GENERAL, C and C2 for the table T_EDW_LU_CURRENCY. The reason why there are two aliases for the lookup tables is because it is necessary to make a join for each one of the different attributes, in this way:
▪ CLIENT_ID, is derived from the join with the lookup table
T_EDW_LU_CORPORATE_CLIENT, with the clause: T.CLIENT_CODE =
CL.CLIENT_CODE;
▪ TRANSFER_PRICE_LIST_ID, is derived from the join with the lookup table
T_EDW_LU_PRICE_LIST_GENERAL,
with
the
clause:
T.TRANSFER_PRICE_LIST_CODE = P.PRICE_LIST_CODE;
▪ TRANSFER_PRICE_CURRENCY_ID, is derived from the join with the lookup table
T_EDW_LU_CURRENCY, with the clause: T.TRANSFER_PRICE_CURRENCY_CODE
= C.CURRENCY_SHORT_DESC;
▪ RETAIL_PRICE_LIST_ID, is derived from the join with the lookup table
T_EDW_LU_PRICE_LIST_GENERAL, with the clause: T.RETAIL_PRICE_LIST_CODE
= P2.PRICE_LIST_CODE;
▪ RETAIL_PRICE_CURRENCY_ID, is derived from the join with the lookup table
T_EDW_LU_CURRENCY, with the clause: T.RETAIL_PRICE_CURRENCY_CODE =
C2.CURRENCY_SHORT_DESC;
Another attribute TRANSFER_RETAIL_PRICE_ID is added using the nextval function, which create a number sequence in order to give a unique identifier number to each record of the table.
After the execution of this interface the A_TRANSFER_RETAIL_PRICE is loaded in the EDWP layer, hence it is ready to be used in the next processes.