ENGENHARIAS, TECNOLOGIA, GESTÃO E TURISMO
ENGINEERING, TECHNOLOGY, MANAGEMENT AND TOURISM
INGENIERÍA, TECNOLOGÍA, ADMINISTRACIÓN Y TURISMO
mill
e
nium
13
Millenium, 2(4), 13‐22.
PREVISÃO DE INTENÇÃO DE COMPRA UTILIZANDO ÁRVORES DE DECISÃO
SHOPPING INTENTION PREDICTION USING DECISION TREES
PREDICCIÓN DE LA INTENCION DE COMPRAS USANDO ÁRBOLES DE DECISIÓN
Dario Šebalj
1Jelena Franjković
1Kristina Hodak
21Josip Juraj Strossmayer University of Osijek, Faculty of Economics in Osijek, Trg Ljudevita Gaja 7, Osijek, Croatia 2 Drinska 13, Tenja, Croatia
Dario Šebalj ‐ [email protected] | Jelena Franjković ‐ [email protected] | Kristina Hodak ‐ [email protected]
Corresponding Author Dario Šebalj Sjenjak 28 31000, Osijek, Croatia [email protected] RECEIVED: 11thof September, 2017 ACCEPTED: 28th of September, 2017
Šebalj, D., Franjković, J. & Hodak, K. (2017).
Shopping intention prediction using decision trees. Millenium, 2(4), 13-22.
m
4
14
RESUMO
Introdução: O preço é um elemento negligenciado na literatura em marketing devido à complexidade da sua gestão e sensibilidade dos clientes sobre as mudanças de preços. Consequentemente, o processo de tomada de decisões de compra pode ser muito desafiador para o cliente.
Objetivo: Criar um modelo para prever a intenção de compra e segmentar os clientes em uma das duas categorias, dependendo da intenção de comprar ou não.
Métodos: A amostra é composta por 305 entrevistados, pessoas com idade superior a 18 anos envolvidas na compra de mantimentos para sua casa. A pesquisa foi realizada em fevereiro de 2017. Para criar um modelo, o método decision trees foi usado com os seus vários algoritmos de classificação.
Resultados: Todos os modelos, exceto onde foi usado o algoritmo RandomTree, alcançaram uma taxa de classificação relativamente alta (acima dos 80%). A classificação com maior precisão foi de 84,75% com algoritmos J48 e RandomForest. Como não há diferença estatisticamente significativa entre esses dois algoritmos, os autores decidiram escolher o algoritmo J48 e criar uma árvore de decisão.
Conclusões: O valor monetário e o nível de preços na loja foram as variáveis mais significativas para a classificação da intenção de compra. No futuro pretende-se comparar esse modelo com algumas outras técnicas de data mining, como redes neurais ou support vector machines, uma vez que essas técnicas alcançaram uma precisão elevada em estudos anteriores neste campo. Palavras-chaves: Modelo; Compra, Árvore de decisão.
ABSTRACT
Introduction: The price is considered to be neglected marketing mix element due to the complexity of price management and sensitivity of customers on price changes. It pulls the fastest customer reactions to that change. Accordingly, the process of making shopping decisions can be very challenging for customer.
Objective: The aim of this paper is to create a model that is able to predict shopping intention and classify respondents into one of the two categories, depending on whether they intend to shop or not.
Methods: Data sample consists of 305 respondents, who are persons older than 18 years involved in buying groceries for their household. The research was conducted in February 2017. In order to create a model, the decision trees method was used with its several classification algorithms.
Results: All models, except the one that used RandomTree algorithm, achieved relatively high classification rate (over the 80%). The highest classification accuracy of 84.75% gave J48 and RandomForest algorithms. Since there is no statistically significant difference between those two algorithms, authors decided to choose J48 algorithm and build a decision tree.
Conclusions: The value for money and price level in the store were the most significant variables for classification of shopping intention. Future study plans to compare this model with some other data mining techniques, such as neural networks or support vector machines since these techniques achieved very good accuracy in some previous research in this field.
Keywords: Shopping intention; Price image; Retailer’s image; Classification algorithms; Machine learning.
RESUMEN
Introducción: El precio se considera un elemento descuidado del marketing-mix debido a la complejidad de la gestión de precios y la sensibilidad de los clientes en los cambios de precios. Esto lleva a reacciones más rápidas de los clientes a ese cambio. En consecuencia, el proceso de toma decisiones de compra puede ser muy desafiante para el cliente.
Objetivo: Crear un modelo capaz de predecir la intención de la compra y clasificar a los encuestados en una de las dos categorías, dependiendo de si pretenden comprar o no.
Métodos: La muestra de datos consta de 305 encuestados, que son personas mayores de 18 años involucrados en la compra de productos de alimentación para su hogar. La investigación se realizó en febrero de 2017. Con el fin de crear un modelo, se utilizó el método de árboles de decisión con sus diversos algoritmos de clasificación.
Resultados: Todos los modelos, excepto el que utilizó el algoritmo RandomTree, lograron una tasa de clasificación relativamente alta (más del 80%). La precisión de clasificación más alta del 84,75% se dio con los algoritmos J48 y RandomForest. Dado que no hay diferencia estadísticamente significativa entre los dos algoritmos, los autores decidieron elegir el algoritmo J48 y construir un árbol de decisión.
Conclusiones: El valor del dinero y el nivel de precios en la tienda fueron las variables más significativas para la clasificación de la intención de compra. Planes futuros de estudio para comparar este modelo con algunas otras técnicas de data mining, tales como redes neuronales o máquinas vectoriales de apoyo, ya que estas técnicas lograron muy buena precisión en algunas investigaciones previas en este campo.
Šebalj, D., Franjković, J. & Hodak, K. (2017).
Shopping intention prediction using decision trees. Millenium, 2(4), 13-22.
m
4
15
INTRODUCTION
The price is considered to be neglected marketing mix element due to the complexity of price management and sensitivity of customers on price changes. As the fastest changeable element, it pulls the fastest customer reactions to that change. Accordingly, the process of making shopping decisions can be very challenging for customer. In order to facilitate customer’s shopping intention, every retailer strives to achieve better price image, which represents the totality of all prices in the retailer's assortment. Zielke (2006) showed the multidimensionality of price images and presented five image dimensions: price-level perception, value for money, price perceptibility, price processing, and evaluation certainty. According to him, retailers have to set priorities to the most important dimensions.
The aim of this paper is to create a model that is able to predict shopping intention and classify respondents into one of the two categories, depending on whether they intend to shop or not. Also, the meaningful variables that affect customers’ shopping intention will be presented. In order to create a model, the decision trees method was used with its several classification algorithms.
This paper is structured as follows: Section 2 gives an overview of previous research in this field, in Section 3 methodology and data are described and Section 4 consists of research results. Conclusion and guidelines for future research are given in Section 5.
1. THEORETICAL FRAMEWORK
There are no lot of papers that deal with predictions of “in-store” shopping intention using data mining techniques. Several authors were predicting online shopping intention. For example, Crone and Soopramanien (2005) evaluated the predictive accuracy of consumer online shopping behaviour using logistic regression and neural networks. Average classification rate for logistic regression was 54.4%, while neural networks achieved accuracy of 57%. Yulihasri et al. (2011) were investigating the factors affecting student’s buying intention through internet shopping. They conducted a multiple regression and concluded that usefulness, ease to use, compatibility and security have a significant impact to attitude for shopping online. Zuo and Yada (2014) presented a research about the prediction of purchase behaviour based on RFID data and using Bayesian network to demonstrate a quantitative analysis process of purchase behaviour decision over stay time. The results showed that Bayesian network has a better accuracy than other typical prediction models. Vieira (2015) compared traditional machine learning techniques to propose a classifier to predict buying intention based on user behaviour within an e-commerce website. Prediction model of consumers’ purchase intention based on mobile search behaviours was introduced by Zhang et al. (2015). They developed a probabilistic generative model to identify search patterns and validated that model on the dataset released by Alibaba. Shi and Ghedira (2016) proposed a prediction model in order to predict customer’s online shopping intention. They used unsupervised (clustering) and supervised learning techniques (classification). For a classification, four algorithms were used: linear discriminant analysis, support vector machines, decision trees C5.0 and naive Bayes. Decision trees model (C5.0 algorithm) had accuracy of 90%. Suchacka and Stemplewski (2017) proposed a neural network model in order to predict purchases in active user sessions in a Web store. The neural network had very high accuracy of 99.6%. Zielke (2010) analysed the direct and indirect effects of price-image dimensions on shopping intentions. The results showed that significant positive direct effects exist for Value for money, Price-level image and Evaluation certainty. Franjković (2017) was researching the impact of the price-image dimensions on shopping intention using regression analysis. She concluded that dimensions Price level, Value for money and Price perceptibility have a statistically significant impact on shopping intention and that price-image dimension Value for money have the strongest impact.
2. METHODS
In this section, methodology and data used for creating a model will be described. 2.1 Decision trees
Decision tree is a data mining technique for solving classification and prediction problems. Data mining consists of different methods and algorithms used for discovering the knowledge from large data sets. Figure 1 shows the taxonomy of data mining methods. Decision trees are used for solving classification, as well as regression problems. When a decision tree is used for classification tasks, it is most commonly referred to as a classification tree, and when it is used for regression tasks, it is called a regression tree. Speaking of the classification problems, the learning scheme is presented with a set of classified examples (training set) from which it is expected to learn a way of classifying unseen examples (testing set). Decision tree has a simple hierarchical structure easy to understand, consisted of nodes and leaves. Each node in the tree involves testing a particular attribute and each leaf of the tree denotes a class. Decision tree classifies instances by sorting them down the tree from the root to some leaf node, which gives a classification that applies to all instances that reach the leaf. The tree complexity is measured by one of the following metrics: the total number of nodes, total number of leaves, tree depth and number of attributes used (Quinlan, 1987; Mitchell, 1997; Witten et al., 2011; Hssina et al., 2014; Rokach and Maimon, 2014).
Šebalj, D., Franjković, J. & Hodak, K. (2017).
Shopping intention prediction using decision trees. Millenium, 2(4), 13-22.
m
4
16
Decision trees are a recursive structure. It means that it is necessary to select an attribute to place at the root node, and then make one branch for each possible value. This splits up the example set into subsets, one for every value of the attribute. That process can be repeated recursively for each branch, but using only those instances that reach the branch. When instances at a node have the same classification, that part of the tree stops developing (Witten et al., 2011). Decision trees have a several algorithms used for creating a tree, and the way finding the attribute that produces the best split in the data is the one of the main differences between them (Vandamme et al., 2007). Several measures are used for defining a splitting criterion. Each decision tree algorithm uses its own measure to select among the attributes at each step while growing the tree.
For creating decision trees, authors used Weka system (version 3.8.0) for training and testing datasets using a variety of machine learning algorithms. The Weka workbench is a collection of state-of-the-art machine learning algorithms and data pre-processing tools. It is developed at the University of Waikato in New Zealand. The workbench includes methods for the main data mining problems: regression, classification, clustering, association rule mining, and attribute selection (Witten et al., 2011).
In order to get the most accurate prediction model, several decision tree classification algorithms were used: J48, REPTree, RandomTree and RandomForest. Those algorithms are explained in detail below.
J4.8 algorithm is Weka's implementation of the famous C4.5 decision tree learner, proposed in 1992, by Ross Quinlan, which uses a divide-and-conquer approach to growing decision trees. The default splitting criterion used by C4.5 is gain ratio, an information-based measure that takes into account different number of test outcomes (Quinlan, 1996; Witten et al., 2011). In order to calculate the GainRatio, it is necessary to measure information gain and entropy. Entropy characterizes the (im)purity of an arbitrary collection of examples. If the target attribute can take on m different values, then the entropy of S relative to this m-wise classification is defined as (Mitchell, 1997):
𝐸𝑛𝑡𝑟𝑜𝑝𝑦(𝑆) = − ∑ 𝑝𝑖𝑙𝑜𝑔2𝑝𝑖 𝑚
𝑖=1
(1)
where S is a given collection and pi is the proportion of S belonging to class i. Now it is possible to define an information gain, the measure of the effectiveness of an attribute in classifying the training data (Mitchell, 1997):
𝐺𝑎𝑖𝑛(𝑆, 𝐴) = 𝐸𝑛𝑡𝑟𝑜𝑝𝑦(𝑆) − ∑ |𝑆|𝑆|𝑣|𝐸𝑛𝑡𝑟𝑜𝑝𝑦(𝑆𝑣)
𝑣∈𝑉𝑎𝑙𝑢𝑒𝑠(𝐴)
(2)
where Values(A) is the set of all possible values for attribute A, and Sv is the subset of S for which attribute A has value v. Gain ratio, as mentioned before, is the default splitting criterion of C4.5 algorithm, defined as follows (Quinlan, 1996):
𝐺𝑎𝑖𝑛𝑅𝑎𝑡𝑖𝑜(𝑆, 𝐴) = 𝐺𝑎𝑖𝑛(𝑆, 𝐴)
𝑆𝑝𝑙𝑖𝑡 𝐼𝑛𝑓𝑜𝑟𝑚𝑎𝑡𝑖𝑜𝑛(𝑆, 𝐴) (3)
REPTree (Reduced Error Pruning Tree) uses the regression tree logic and creates multiple trees in different iterations. After that it selects best one from all generated trees. That will be considered as the representative. In pruning the tree, the measure used is the mean square error on the predictions made by the tree. REPTree is a fast decision tree learner which builds a decision/regression tree using information gain as the splitting criterion, and prunes it using reduced error pruning. It only sorts values for numeric attributes once. Missing values are dealt with using C4.5's method of using fractional instances (Kalmegh, 2015).witt
RandomTree is an algorithm for constructing a tree that considers K random features at each node and performs no pruning (Witten et al., 2011, cited in: Ozer, 2008).
RandomForest is a combination of tree predictors such that each tree depends on the values of a random vector sampled independently and with the same distribution for all trees in the forest (Breiman, 2001). Unlike standard trees, where each node is split using the best split among all variables, in a random forest,
each node is split using the best among a subset of predictors randomly chosen at that node (Breiman, 2001, cited in: Liaw and Wiener, 2002).
Šebalj, D., Franjković, J. & Hodak, K. (2017).
Shopping intention prediction using decision trees. Millenium, 2(4), 13-22.
m
4
17
2.2 Data
In order to collect data about shopping habits, a primary research using highly structured questionnaire was conducted. A population consisted of 171,103 households of two counties in eastern Croatia – Osječko-baranjska and Vukovarsko-srijemska. Target respondents were persons older than 18 years involved in buying groceries for their household (but they are not necessary primary buyers). The research was conducted in February 2017 and 313 questionnaires were collected. After the process of clean-up and elimination of useless and incomplete data the outcome sample consisted of 295 respondents.
The first part of the questionnaire included questions related to the importance of price in making shopping decisions, the perception of respondents’ own knowledge about prices, the perception of the retailer’s slogans and price-image. The second part of the questionnaire referred to the frequency of shopping at the certain retailer. Respondents were asked to choose one retailer where they most often buy and one where they rarest buy, but at least once in a few months, in order to find the main reasons why they buy at this particular retailer, what gives the most impression about the prices and to measure the price dimensions.
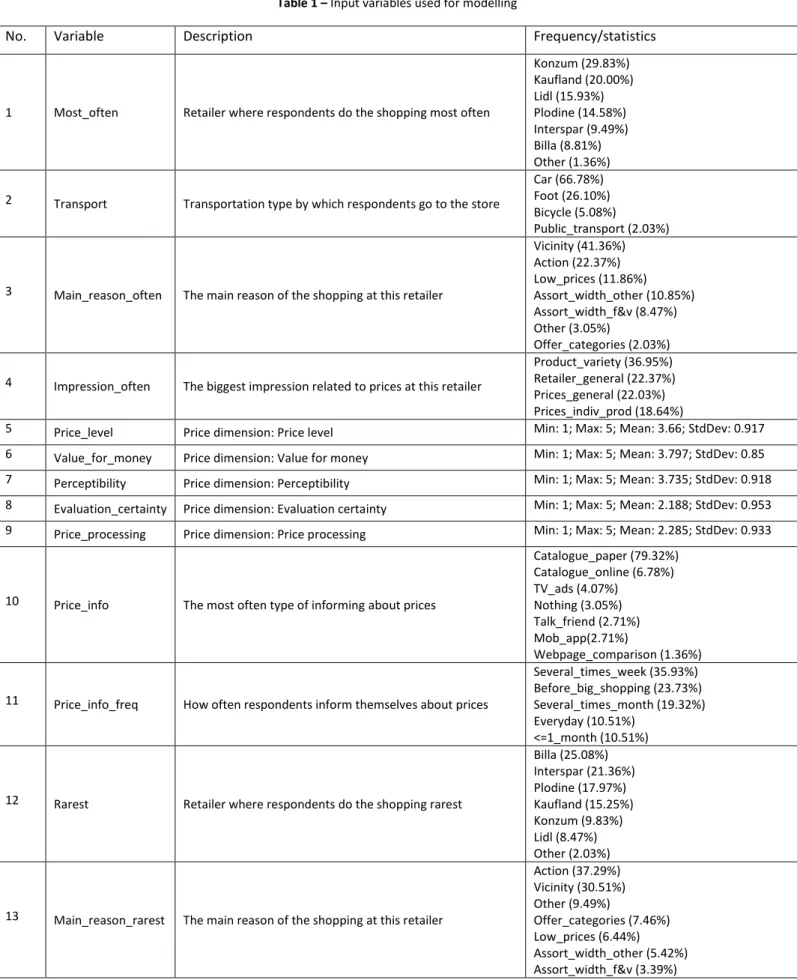
Initially, decision tree model used 29 input variables, but after conducted attribute selection process in Weka, 11 variables were marked as irrelevant for the model. Thus, the final model has 18 input variables as shown in Table 1.
More about the attribute selection process can be found in Section 4.1. Input variable ‘Most_often’ refers to retailer where respondents do the shopping most often. Variable ‘Transport’ shows transportation type by which respondents go to the store. The main reason of the shopping at the certain retailer where respondents most often buy is shown in the variable ‘Main_reason_often’. There are several possible reasons: vicinity, actions and savings on special pricings (action), generally low prices (low_prices), assortment width and quality of the fruits and vegetables (assort_width_f&v), assortment width and quality of the other products (assort_width_other), the best offer of a specific product category (offer_categories) and some other reasons (other). Variable ‘Impression_often’ answers on the question “What leaves the biggest impression related to prices at this retailer where you most often buy?”.
The possible answers are: large variety of products at different prices within the product category (product_variety), retailer in general and its price-image in comparison with the competition (retailer_general), generally prices in the store (prices_general) and prices of individual products (prices_indiv_prod). Variables ‘Rarest’, ‘Main_reason_rarest’ and ‘Impression_rarest’ have the same possible answers as the last three described variables, but these variables are related to the retailer where respondents rarest buy. Variable ‘Price_info’ refers to the type of informing about prices that respondents use most often. There are several groups of price informing types: informing by paper catalogues sent to the households (catalogue_paper), informing by online catalogues (catalogue_online), using mobile apps of retailers (mob_app), informing by TV ads (TV_ads), informing by webpages for price comparison (webpage_comparison), informing by talking with friends, family members and others (talk_friends) and nothing of the stated (nothing). The next variable ‘Price_info_freq’ shows how often respondents inform themselves about prices using some source of information. Possible answers were: everyday, several times a week (several_times_week), just before a big shopping (before_big_shopping), several times a month (several_times_month), once a month or less (<=1_month). The last four variables are demographic ones: age of respondents, their employment and education status and number of children (no children, 1 child, 2 children, 3 children, 4 or more children and not answered).
There are five variables that represent price-image dimensions: ‘Price-level’, ‘Value_for_money’, ‘Perceptibility’, ‘Evaluation_certainty’ and ‘Price_processing’. A model of measurement of the price-image dimensions, as well as shopping intention dimension, is taken from the research conducted by Zielke (2006). According to him, a “Price-level perception” is the perception of prices without taking quality differences into account, “Value for money” is the outcome of a trade-off between sacrifices and utilities derived from product and store attributes, “Price perceptibility” represents the ease with which a customer can find or see products’ prices in the store, “Evaluation certainty” describes how easily customers perceive the price-evaluation process, while “Price procassibility” refers to the ease of price processing. Measuring scales were comprised of 3 to 5 items, depending on the dimension and measured by 5-point Likert scale. For price-image dimensions and shopping intention, a mean of all items is calculated, which represents a value of the variable.
Šebalj, D., Franjković, J. & Hodak, K. (2017).
Shopping intention prediction using decision trees. Millenium, 2(4), 13-22.
m
4
18
Table 1 – Input variables used for modelling
No. Variable Description Frequency/statistics
1 Most_often Retailer where respondents do the shopping most often
Konzum (29.83%) Kaufland (20.00%) Lidl (15.93%) Plodine (14.58%) Interspar (9.49%) Billa (8.81%) Other (1.36%)
2 Transport Transportation type by which respondents go to the store
Car (66.78%) Foot (26.10%) Bicycle (5.08%)
Public_transport (2.03%)
3 Main_reason_often The main reason of the shopping at this retailer
Vicinity (41.36%) Action (22.37%) Low_prices (11.86%) Assort_width_other (10.85%) Assort_width_f&v (8.47%) Other (3.05%) Offer_categories (2.03%) 4 Impression_often The biggest impression related to prices at this retailer
Product_variety (36.95%) Retailer_general (22.37%) Prices_general (22.03%) Prices_indiv_prod (18.64%)
5 Price_level Price dimension: Price level Min: 1; Max: 5; Mean: 3.66; StdDev: 0.917
6 Value_for_money Price dimension: Value for money Min: 1; Max: 5; Mean: 3.797; StdDev: 0.85
7 Perceptibility Price dimension: Perceptibility Min: 1; Max: 5; Mean: 3.735; StdDev: 0.918
8 Evaluation_certainty Price dimension: Evaluation certainty Min: 1; Max: 5; Mean: 2.188; StdDev: 0.953
9 Price_processing Price dimension: Price processing Min: 1; Max: 5; Mean: 2.285; StdDev: 0.933
10 Price_info The most often type of informing about prices
Catalogue_paper (79.32%) Catalogue_online (6.78%) TV_ads (4.07%) Nothing (3.05%) Talk_friend (2.71%) Mob_app(2.71%) Webpage_comparison (1.36%)
11 Price_info_freq How often respondents inform themselves about prices
Several_times_week (35.93%) Before_big_shopping (23.73%) Several_times_month (19.32%) Everyday (10.51%)
<=1_month (10.51%)
12 Rarest Retailer where respondents do the shopping rarest
Billa (25.08%) Interspar (21.36%) Plodine (17.97%) Kaufland (15.25%) Konzum (9.83%) Lidl (8.47%) Other (2.03%)
13 Main_reason_rarest The main reason of the shopping at this retailer
Action (37.29%) Vicinity (30.51%) Other (9.49%) Offer_categories (7.46%) Low_prices (6.44%) Assort_width_other (5.42%) Assort_width_f&v (3.39%)
Šebalj, D., Franjković, J. & Hodak, K. (2017).
Shopping intention prediction using decision trees. Millenium, 2(4), 13-22.
m
4
19
No. Variable Description Frequency/statistics
14 Impression_rarest The biggest impression related to prices at this retailer
Prices_indiv_prod (36.61%) Retailer_general (25.76%) Prices_general (22.37%) Product_variety (15.25%)
15 Age Age of respondent
50-59 (25.42%) 30-39 (25.08%) 40-49 (21.36%)
18-29 (17.29%); >=60 (10.85%)
16 Employment Employment status of respondent
Employed (83.05%) Unemployed (7.80%) Retired (6.10%) Student (3.05%)
17 Education Education status of respondent Faculty (60.00%) Highschool (37.29%)
Elementary (2.71%)
18 Child_no Number of children of respondent
0_children (56.61%) 1_child (22.37%) 2_children (13.56%) 3_children (3.73%) NO (3.39%) 4_more (0.34%)
As the output variable (class variable), shopping intention of respondents was chosen. As mentioned above, a mean of all items of shopping intention was calculated and that given value refers to the respondent’s shopping intention. Variable was expressed as nominal with two classes – NO (shopping intention < 4.0), for the respondents who do not have a shopping intention and YES (shopping intention >=4.0), for the respondents who have a shopping intention. In this way presented output variable puts the aforementioned problem into classification problem.
As evaluation approach, the stratified 10-fold cross-validation was selected. This method splits the data into ten approximately equal partitions. One-tenth of the data is used for testing, and nine-tenth for training. This procedure is repeated ten times so that in the end, every instance has been used exactly once for testing. Finally, the 10 error estimates are averaged to yield an overall error estimate. Since stratification is present, each class is properly represented in both training and test sets (Witten et al., 2011).
As a measure of success of the model, classification rate was used on the testing sample.
3. RESULTS AND DISCUSSION
In order to create a decision tree model, several algorithms were used. Results that these algorithms achieved are given in Table 2.
Table 2 – Decision tree results
Decision tree algorithm MinNumObj* Number of Leaves Size of the tree Correctly Classified Instances Incorrectly Classified Instances J48 2 21 30 246 (83.39%) 49 (16.61%) J48 5 14 22 246 (83.39%) 49 (16.61%) J48 10 6 11 250 (84.75%) 45 (15.25%) RandomForest 250 (84.75%) 45 (15.25%) RandomTree 198 211 (71.53%) 84 (28.47%) REPTree 10 239 (81.02%) 56 (18.98%)
Šebalj, D., Franjković, J. & Hodak, K. (2017).
Shopping intention prediction using decision trees. Millenium, 2(4), 13-22.
m
4
20
From the Table 2 it can be seen that RandomForest, as well as J48 algorithm produced the highest rate of accurate classification of 84.75%. J48 algorithm was tested in three ways, changing the minimum number of instance per leaf parameter which defines the minimum number of respondents that is required i n a leaf. The larger number of instances in a leaf, the smaller size of the tree. Default number of instances in J48 algorithm is 2, but it produced a very large tree . Authors increased that number and it gave us a smaller tree and increased accuracy of cl assification.
Using the Weka Experiment Environment, a statistical significance test of one learning scheme (J48 with at least 10 instances per leaf) versus five others was conducted. Testing showed that there is only a statistically significant difference between J48 algorithm and the RandomTree algorithm, and that J48 algorithm with at least 10 instances per leaf is statistically better than RandomTree on the level of 95% of reliability.
Since there is no statistically significant difference between J48 algorithm with at least 10 instances per leaf and four other algorithms (except RandomTree), it is decided to use that algorithm and build a decision tree. This algorithm (and its earlier versions, like C4.5) is widely and most often used for decision tree models so it is the main reason for choosing this type of algorithm.
Detailed analysis reveal that the tree is equally successful in recognizing respondents who do have a shopping intention (88%), as well as those who do not have a shopping intention (80%).
The result on a test set is often displayed as a two-dimensional confusion matrix with a row and column for each class. Each matrix element shows the number of test examples for which the actual class is the row and the predicted class is the column. Good results correspond to large numbers down the main diagonal and small, ideally zero, off-diagonal elements (Witten et al., 2011). Confusion matrix is presented in Table 3.
Table 3 – Confusion matrix
Predicted Class
YES NO
Actual Class YES 155 21
NO 24 95
From the confusion matrix, it can be seen that from the total of 176 respondents who have a shopping intention, decision tree accurately placed 155 respondents. Regarding the class of respondents who do not have a shopping intention, decision tree placed 95 of them in a correct category, while 24 were placed in class of respondents who do not have a shopping intention.
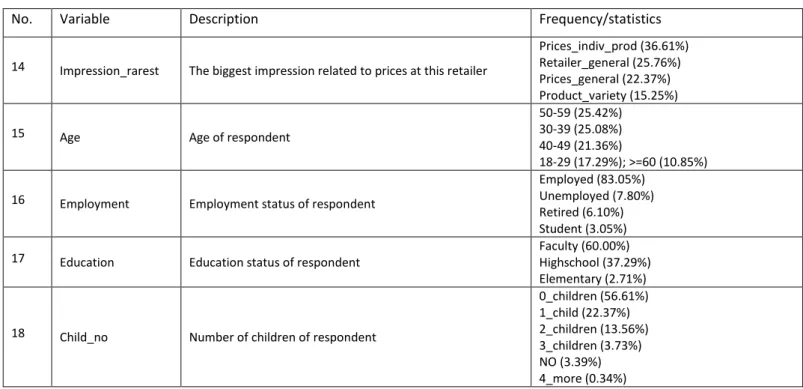
Figure 1 – Decision tree obtained Source: Authors
Figure 2 shows the structure of composed decision tree using J48 algorithm. The tree consists of 5 nodes and 6 leaves. The first splitting node is variable Value_for_money which represents the price-image dimension Value for money. If respondents have a good opinion about retailer regarding value for money, tree continues to split to the next node on the right side – variable Price_level. If the level of prices in the store is lower (the respondents gave more points in a 5-point Likert scale), the respondents are going to shop in this store. Otherwise, the tree continues to split. The next splitting node is variable
Šebalj, D., Franjković, J. & Hodak, K. (2017).
Shopping intention prediction using decision trees. Millenium, 2(4), 13-22.
m
4
21
Evaluation_certainty. The respondents intend to shop if this variable’s value is lower. The same principle also applies to the left side of the tree.
3.1 Evaluation of significance of input variables
In Weka, the process of analysis of input variables’ significance is called attribute selection. It involves searching through all possible combinations of attributes in the data to find which subset of attributes works best for prediction. To do this, two objects must be set up: an attribute evaluator and a search method. The evaluator determines what method is used to assign a worth to each subset of attributes. The search method determines what style of search is performed (Bouckaert et al., 2016). Hall and Holmes (2003) as the referent techniques of attribute selection recommend information gain and Relief, while according to Ganchev et al. (2006) those are information gain and gain ratio (cited in: Oreški, 2014). Therefore, in order to evaluate attributes, authors took 3 methods into consideration: Information gain, Gain ratio and Relief. As a search method, ranker method was used. Since every method gives different attribute selection result, average value of all methods used was taken as a final result of attribute ranking.
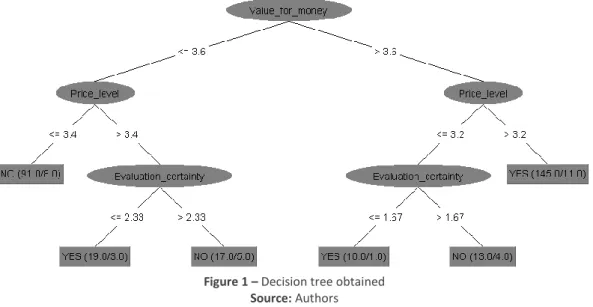
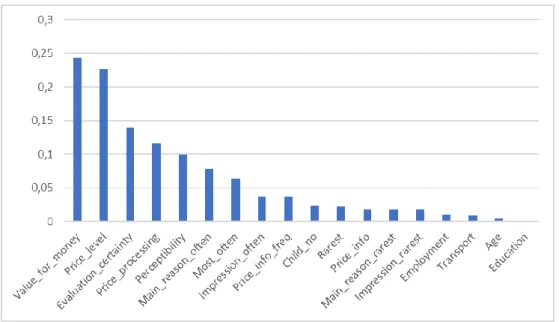
Figure 2 – Graphical representation of input variables’ significance Source: Authors
From the Figure 2 it can be seen that the variable ‘Value_for_money’ affects the output the most. The variable ‘Price_level’ is on the 2nd place, followed by ‘Evaluation_certainty’, ‘Price_processing’, ‘Perceptibility’, ‘Main_reason_often’ and ‘Most_often’. Variables related to demographic information about respondents (‘Education’, ‘Age’, ‘Employment’, Child_no’), as well as those related to the retailer where respondents rarest buy, do not have almost any influence on the shopping intention. Analysis showed that value for money that some retailer offers and price level in the store are the most influential variables for predicting shopping intention. This result is matched with the research conducted by Franjković (2017) who used a regression analysis to measure the impact of price-image dimensions on shopping intention.
4. CONCLUSIONS
In this research, several decision tree models for classification of respondents by shopping intention were compared. The models consisted of 18 input variables, and the output variable was shopping intention. All models, except the one that used RandomTree algorithm, achieved relatively high classification rate (over the 80%). The highest classification accuracy of 84.75% gave J48 and RandomForest algorithms. Since there is no statistically significant difference between those two algorithms, authors decided to choose J48 algorithm and build a decision tree. This algorithm is the most common used algorithm for decision tree models. Created decision tree is equally successful in classifying both classes as well. The value for money and price level in the store were the most significant variables for classification of shopping intention. Variables related to demographic information about respondents and those related to the retailer where respondents rarest buy, do not have almost any influence on the shopping intention. Limitation of this research could be relatively small sample (for this type of data analysis) and unequal representation of respondents regarding employment, education and children number. Future study plans to compare this model with some other data mining techniques, such as neural networks or support vector machines since these techniques achieved very good accuracy in some previous research in this field.
Šebalj, D., Franjković, J. & Hodak, K. (2017).
Shopping intention prediction using decision trees. Millenium, 2(4), 13-22.
m
4
22
REFERENCES
Bouckaert, R. R., Frank, E., Hall, M., Kirkby, R., Reutemann, P., Seewald, A., & Scuse, D. (2016). WEKA Manual for Version 3-8-0. Breiman, L. (2001). Random forests. Machine Learning, 45(1), 5-32. doi: 10.1023/A:1010933404324
Crone, S. F., & Soopramanien, D. (2005). Predicting customer online shopping adoption-an evaluation of data mining and market modelling approaches. DMIN. pp. 215-221.
Franjković, J. (2017). Prices and price image of retailer. Thesis of the postgraduate specialist study. Osijek: Faculty of Economics in Osijek.
Ganchev, T., Zervas, P., Fakotakis, N., & Kokkinakis, G. (2006). Benchmarking Feature Selection Techniques on the Speaker Verification Task. Fifth International Symposium on Communication Systems, Networks And Digital Signal Processing, pp. 314-318.
Hall, M. A., & Holmes, G. (2003). Benchmarking Attribute Selection Techniques for Discrete Class Data Mining. IEEE Transactions on Knowledge and Data Engineering, 15(3), 1437-1447. doi: 10.1109/TKDE.2003.1245283
Hssina, B., Merbouha, A., Ezzikouri, H., & Erritali, M. (2014). A comparative study of decision tree ID3 and C4.5. International Journal of Advanced Computer Science and Applications, 4(2), 13-19.doi: 10.14569/SpecialIssue.2014.040203
Kalmegh, S. (2015). Analysis of WEKA Data Mining Algorithm REPTree, Simple Cart and RandomTree for Classification of Indian News. IJISET - International Journal of Innovative Science, Engineering & Technology, 2(2), 438-446. Retrieved from http://ijiset.com/vol2/v2s2/IJISET_V2_I2_63.pdf
Liaw, A., & Wiener, M. (2002). Classification and regression by randomForest. R news, 2(3), 18-22. Retrieved from https://www.r-project.org/doc/Rnews/Rnews_2002-3.pdf
Mitchell, T. M. (1997). Machine Learning. McGraw-Hill.
Oreški, D. (2014). Evaluation of contrast mining techniques for feature selection in classification. doctoral thesis, Varaždin: Faculty of Organization and Informatics.
Ozer, P. (2008). Data Mining Algorithms for Classification. BSc Thesis Artificial Intelligence, Radboud University Nijmegen. Quinlan, R. J. (1987). Generating Production Rules from Decision Trees. IJCAI, 87, 304-307. Retrieved from
http://citeseerx.ist.psu.edu/viewdoc/download?doi=10.1.1.98.9054&rep=rep1&type=pdf
Quinlan, R. J. (1996). Improved Use of Continuous Attributes in C4.5. Journal of Arti, 4, 77-90. doi: 10.1613/jair.279 Rokach, L., & Maimon, O. (2014). Data Mining with Decision Trees: Theory and Applications. World scientific.
Shi, F., & Ghedira, C. (2016). Intention-based Online Consumer Classification for Recommendation and Personalization. In Hot Topics in Web Systems and Technologies (HotWeb), 2016 Fourth IEEE Workshop on, pp. 36-41.
Suchacka, G., & Stemplewski, S. (2017). Application of Neural Network to Predict Purchases in Online Store: Information Systems Architecture and Technology: Proceedings of 37th International Conference on Information Systems Architecture and Technology–ISAT 2016–Part IV, Springer International Publishing, pp. 221-231.
Vandamme, J.-P., Meskens, N., & Superby, J.-F. (2007). Predicting Academic Performance by Data Mining Methods. Education Economics, 15(4), 405-419. doi: 10.1080/09645290701409939
Vieira, A. (2015). Predicting online user behaviour using deep learning algorithms. arXiv preprint arXiv:1511.06247.
Witten, I. H., Frank, E., & Hall, M. A. (2011). Data Mining: Practical Machine Learning Tools and Techniques. Burlington: Morgan Kaufmann Publishers.
Yulihasri, Islam, A., & Daud, K. A. K. (2011). Factors that Influence Customers’ Buying Intention on Shopping Online. International Journal of Marketing Studies. 3(1), 128-139. doi http://dx.doi.org/10.5539/ijms.v3n1p128
Zhang, M., Chen, G., & Wei, Q. (2015). Discovering Consumers' Purchase Intentions Based on Mobile Search Behaviors. In Andreasen T. et al. (Eds), Flexible Query Answering Systems 2015: Vol. 400. Advances in Intelligent Systems and Computing (pp. 15-28). doi: 10.1007/978-3-319-26154-6_2
Zielke, S. (2010). How price image dimensions influence shopping intentions for different store formats. European Journal of Marketing, 44(6), 748-770. Doi: 10.1108/03090561011032702
Zielke, S. (2006). Measurement of retailers’ price images with a multiple-item scale. Journal of Retailing and Consumer Services. 15(5), 335-347.
Zuo, Y., & Yada, K. (2014). Using bayesian network for purchase behavior prediction from RFID data. In 2014 IEEE International Conference on Systems, Man and Cybernetics (SMC), IEEE, pp. 2262-2267. doi: 10.1109/SMC.2014.6974262