Kinetic Analysis of the Gas-Phase Reactions of Methyl Vinyl Ketone
with the OH Radical in the Presence of NO
xAndré Silva Pimentel*, and Graciela Arbilla
Departamento de Físico-Química, Instituto de Química, Universidade Federal do Rio de Janeiro, Centro de Tecnologia Bloco A Sala 408, Cidade Universitária
--21949-900 Rio de Janeiro -- RJ, Brazil
Received: September 1, 1998
Um mecanismo explícito para a reação do metil-vinil-cetona com radicais OH, numa mistura NOx -- ar, foi simulado resolvendo as equações diferenciais ordinárias usando o método Runge-Kutta-4-semi-implícito. Os resultados simulados são consistentes com os dados experimentais publicados e o modelo explica as principais vias de reação para a oxidação do MVK com radicais OH na presença de NOx -- ar. Usando uma análise dos autovetores e autovalores dos coeficientes de sensibilidade, para todas as espécies químicas envolvidas em diferentes tempos de reação, foi extraída informação cinética do sistema. Este método foi utilizado para reduzir o modelo cinético de forma objetiva. Foi utilizado, também, o método tradicional de análise de velocidade de produção (ROPA) para estudar a importância relativa das reações individuais. Usando a informação da análise de componente principal e da análise de velocidade de produção, foram identificadas as principais reações individuais.
An explicit chemical mechanism for the reaction of methyl vinyl ketone (MVK) with OH radicals in NOx-air systems, was simulated by solving the corresponding ordinary differential equations using Runge-Kutta-4-semi-implicit method. The simulated results are consistent with the published experimental data and the model accounts for all the major pathways by which MVK reacts in NOx-air systems. An eigenvalue-eigenvector analysis is used to extract meaningful kinetic information from linear sensitivity coefficients computed for all species of the chemical mechanism at several time points. This method is used to get an objective condition for constructing a minimal reaction set. Also, a classic method called rate of production analysis (ROPA) was used for the study of the reactions relevance. Using the principal component information as well as the rate of production analysis the main paths of reaction are identified and discussed.
Keywords: principal component analysis, eigenvalue-eigenvector analysis, rate of
pro-duction analysis, methyl vinyl ketone
Introduction
Methyl vinyl ketone is the simplest α,β-unsaturated ketone. It is produced, together with methacrolein, from the gas-phase reactions of isoprene with the OH radical in the presence of oxides of nitrogen (NOx)1-3 and with O34,5. The
emissions of isoprene, which originate primarily from vegetation6-11, may dominate over anthropogenic non-methane organic emissions on regional and global scales12-14. This potential environmental impact makes the inclusion of the isoprene atmospheric chemical reactions into airshed
computer models necessary15,16, which in turn requires a quantitative understanding of the atmospheric chemistry of both methacrolein and methyl vinyl ketone.
In this work, the gas-phase reactions of methyl vinyl ketone (hereafter MVK, CH3COCH=CH2) with OH
radi-cals in NOx-air systems are simulated and an
eigenvalue-eigenvector analysis of the linear sensitivity coefficients, called Principal Component Analysis17, is used to assess the relative importance of the elementary processes.
Article
*e-mail: [email protected]
J. Braz. Chem. Soc., Vol. 9, No. 6, 551-562, 1998. © 1998 Soc. Bras. Química
Reaction rate analysis for complex kinetic systems in-cludes the solution of the kinetic differential equations, the study of the effects of parameter changes on the results and the exploration of important reaction pathways17-23. This information is important to decide which reactions should be included in an atmospheric photochemical mechanism and, also, which reactions should be experimentally stud-ied.
Only one experimental study has been conducted for the MVK reaction with OH radicals24. The authors of this study measured and identified the products of MVK oxida-tion, obtaining directly quantitative yields for glycolalde-hyde (HOCH2CHO), methylglyoxal (CH3COCHO) and
formaldehyde (HCHO). They also discussed and recom-mended a mechanism to represent the MVK + OH chem-istry. Nevertheless, to our knowledge, a sensitivity analysis of the mechanism has not been done up to now.
In this paper the initial conditions for the simulations were those of the laboratory smog chamber experiments of Tuazon and Atkinson 24 in order to compare the calculated and experimental results.
The chemical mechanism
As previously discussed24 MVK reacts essentially with OH radicals by H-atom abstraction, with an overall rate constant of 18.80x10⁻¹² cm3 molecule-1 s-1 at 298 K25.
The present chemical mechanism considers 28 species and 40 reactions and was proposed on the basis of reliable, previous models26,27 and of the known MVK chemistry. Thermal rate constants were either taken from the litera-ture28-31 or estimated by comparison with similar com-pounds32. The photochemical reaction rates were estimated on the basis of the ethyl nitrite photodecomposition experi-mental data24. The chemical mechanism is listed in Table 1.
Methodology
The chemical process can be described by a system of kinetic differential equations,
∂c(t)
∂t = f(k, c(t))
where c(t) is the n-vector of species concentrations with c(t
= 0) = c0 and k is the m-vector of kinetic parameters. Analytical solutions are not available for complex systems and a numerical solution is required. An important question in modeling studies is the effect of parameter change on the solution. In general, an alteration in the kinetic parameters from k0 to k at time t1 causes a change in the solution of the
system at a time t2 (with t2 > t1). The effect of the parameter
change on the solution can be expressed through the first order local concentration sensitivity coefficients defined as
Sij(k0, c0, t1, t2)=∂ ci(t2) ∂ kj
The Sij coefficient is the linear approximation of
con-centration change of species i at the time t2 caused by the
differential change of the parameter of reaction j at time t1
from value kj0 to kj. In this work the parameters are the
photochemical coefficients and the thermal rate constants. Sensitivity coefficients are normalized in order to elimi-nate their dependence on the dimensions of the kinetic model. The effect of a single parameter on a group of concentrations is demonstrated by the overall sensitivities which are the sum of the squares of the normalized sensi-tivities. A better description of parameter-concentration interdependence consists in the identification of the groups of parameters which have joint influence on a group of concentrations. This type of information is given by the principal component analysis of the normalized sensitivity matrix. The eigenvectors of the matrix STS, where S is the
array of sensitivity coefficients, identify parameter groups while the eigenvalues give information about the effective-ness of these parameter groups for the change of species concentrations. A parameter is considered important if it belongs to a large element of an eigenvector corresponding to a large eigenvalue. The methodology of numerical simu-lation, sensitivity and principal component analysis is fully discussed in the literature33-38.
An alternative method for the study of the reactions relevance is the rate of production analysis called ROPA35,39. Although the combination of species reduction
and rate sensitivity analysis36 seems to be a more effective
way for this purpose, the rate of production analysis is a classic method for the identification of important reaction pathways. This methodology requires the calculation of the Pij matrix elements40,41, which show the contribution of
reaction j to the rate of production of species i. The rate of production analysis is rather difficult to interpret in a cor-rect way and must be analyzed together with principal component results.
Results and Discussions
The full mechanism and rate constants are presented in Table 1. The reduced mechanism was obtained after elimi-nation of the non-important reactions (denoted by # in Table 1) on the basis of the principal component analysis described below. The rank of reactions ordered by overall sensitivities and rates is shown in Table 2. We calculated normalized sensitivities for all species at time points 1.9, 6.9, 11.9, 16.8, 21.8, 26.8, 33.8, 40.8 and 49.8 minutes. Eigenvalues of STS and the corresponding eigenvectors are
listed in Table 3.
In the conditions of the modeling, the main source of hydroxyl radicals is the reaction (5) (HO2 + NO → OH +
NO2) which follows the photolysis of the ethyl nitrite
Vol. 9, No. 6, 1998 Kinetic Analysis of the Gas-Phase Reactions of Methyl Vinyl Ketone 553
Table 1. Chemical Mechanism for Gas-Phase Reactions of MVK with the OH Radical in the Presence of NOx.
Reactions Rate Constants at 298 K Units of Molecule, cm3, s
#1) HONO + OH → H2O + NO2 k1= 4.86x10⁻¹²
#2) OH + HNO3 → H2O + NO3 k2= 1.50x10⁻¹³
3) NO + OH → HONO k3a= 1.12x10⁻¹¹
4) OH + NO2 → HNO3 k4a= 1.34x10⁻¹¹
5) HO2 + NO → OH + NO2 k5= 8.28x10⁻¹²
6) NO + O3 → NO2 + O2 k6= 1.81x10⁻¹⁴
7) NO + NO3 → 2 NO2 k7= 2.60x10⁻¹¹
8) NO2 + O3 → NO3 + O2 k8= 3.23x10⁻¹⁷
9) HONO + hν→ OH + NO j9= 1.63x10⁻³
10) NO2 + hν + (O2) → NO + O3 j10= 4.26x10⁻³
11) HCHO + OH + (O2) → HO2 + CO + H2O k11= 9.57x10⁻¹²
12) CH3CHO + OH + (O2) → CH3CO3 + H2O k12= 1.58x10⁻¹¹
13) CH3O + (O2) → HCHO + HO2 k13= 4.59x10⁴
14) CH3O2 + NO → NO2 + CH3O k14= 7.68x10⁻¹²
15) CH3CO3 + NO + (O2) → NO2 + CH3O2 + CO2 k15a= 9.98x10⁻¹²
16) CH3CO3 + NO2 → CH3CO3NO2 k16= 3.63x10⁻¹²
17) CH3CO3NO2 → CH3CO3 + NO2 k17= 1.81x10⁻⁴
18) CH3CH2O + O2 → CH3CHO + HO2 k18= 9.48x10⁻¹⁵
#19) CH3CH2O + NO → CH3CH2ONO k19= 4.40x10⁻¹¹ (k∞)
20) CH3C(O)CH=CH2 + OH + (O2) → 0.28 CH3C(O)CH(OH)CH2O2 + 0.72 CH3C(O)CH(O2)CH2OH
k20b= 1.88x10⁻¹¹
21) CH3C(O)CH(OH)CH2O2 + NO → CH3C(O)CH(OH)CH2O + NO2 k21c= 8.90x10⁻¹²
22) CH3C(O)CH(OH)CH2O → CH3C(O)CHOH + HCHO k22c= 7.00x10⁻³
23) CH3C(O)CHOH + O2 → CH3C(O)CHO + HO2 k23c= 1.59x10⁻¹³
24) CH3C(O)CH(O2)CH2OH + NO → CH3C(O)CH(O)CH2OH + NO2 k24c= 8.90x10⁻¹²
25) CH3C(O)CH(O)CH2OH + (O2) → CH3CO3 + HOCH2CHO k25c= 8.50x10⁴
26) CH3CH2ONO + hν→ CH3CH2O + NO j26c= 1.85x10⁻⁴
#27) 2 OH → H2O2 k27= 1.14x10⁻¹¹
#28) H2O2 + OH → H2O + HO2 k28= 1.70x10⁻¹²
29) HO2 + HO2 → H2O2 + O2 k29= 7.73x10⁻¹²
30) HO2 + NO2 → HO2NO2 k30= 2.33x10⁻¹²
31) HO2NO2 → HO2 + NO2 k31= 1.68x10⁻¹
32) NO2 + NO3 → N2O5 k32= 6.56x10⁻¹³
33) N2O5 → NO2 + NO3 k33= 2.27x10⁻²
#34) CH3O + NO → CH3ONO k34= 2.13x10⁻¹¹
#35) CH3O + NO2 → CH3ONO2 k35= 8.75x10⁻¹²
36) CH3O2 + NO2 → CH3O2NO2 k36= 2.93x10⁻¹²
37) CH3O2NO2 → CH3O2 + NO2 k37= 1.698
38) HCHO + (2 O2) + hν→ 2 HO2 + CO j38= 1.76x10⁻⁵
39) HCHO + hν→ H2 + CO j39= 2.66x10⁻⁵
40) CH3CHO + (2 O2) + hν→ CH3O2 +HO2 +CO j40= 3.53x10⁻⁶
554 Pimentel & Arbilla J. Braz. Chem. Soc.
Table 2. Rank of Reactions by Overall Sensitivity and Rates.
Rank Reaction Overall Sens.* Reaction Rates**
1 26 6.23 x 10² 30 1.26 x 10¹²
2 20 2.15 x 10² 31 1.26 x 10¹²
3 4 1.47 x 10² 10 6.24 x 10¹¹
4 16 9.50 x 101 6 4.91 x 10¹¹
5 15 8.90 x 101 32 4.06 x 10¹¹
6 5 4.04 x 101 33 3.95 x 10¹¹
7 9 3.14 x 101 8 1.24 x 10¹¹
8 10 2.18 x 101 7 1.13 x 10¹¹
9 6 1.85 x 101 36 4.28 x 10¹⁰
10 14 1.79 x 101 37 4.28 x 10¹⁰
11 3 1.75 x 101 5 3.15 x 10¹⁰
12 8 1.37 x 101 26 2.56 x 10¹⁰
13 22 1.32 x 101 18 2.56 x 10¹⁰
14 7 1.24 x 101 16 2.54 x 10¹⁰
15 30 1.12 x 101 20 1.40 x 10¹⁰
16 31 1.09 x 101 25 1.01 x 10¹⁰
17 13 9.59 24 1.01 x 10¹⁰
18 18 9.03 4 9.42 x 10⁹
19 23 9.00 17 9.25 x 10⁹
20 25 9.00 12 6.56 x 10⁹
21 24 9.00 22 4.05 x 10⁹
22 21 9.00 23 4.05 x 10⁹
23 36 8.94 21 3.92 x 10⁹
24 37 8.93 11 1.72 x 10⁹
25 29 8.80 39 9.97 x 10⁸
26 32 6.87 14 7.89 x 10⁸
27 33 4.46 13 7.67 x 10⁸
28 12 1.79 38 6.59 x 10⁸
29 17 1.39 15 4.91 x 10⁸
30 40 1.08 40 3.05 x 10⁸
31 38 1.01 9 2.93 x 10⁸
32 11 5.59 x 10⁻¹ 29 1.05 x 10⁸
33 34 3.11 x 10⁻¹ 3 5.54 x 10⁷
34 35 1.05 x 10⁻¹ 2 3.18 x 10⁷
35 19 9.38 x 10⁻² 35 2.14 x 10⁷
36 1 4.56 x 10⁻² 19 5.11 x 10⁶
37 39 9.28 x 10⁻³ 1 4.17 x 10⁶
38 27 2.17 x 10⁻³ 28 6.43 x 10⁵
39 2 3.80 x 10⁻⁴ 34 3.67 x 10⁵
40 28 1.21 x 10⁻⁴ 27 2.63 x 10²
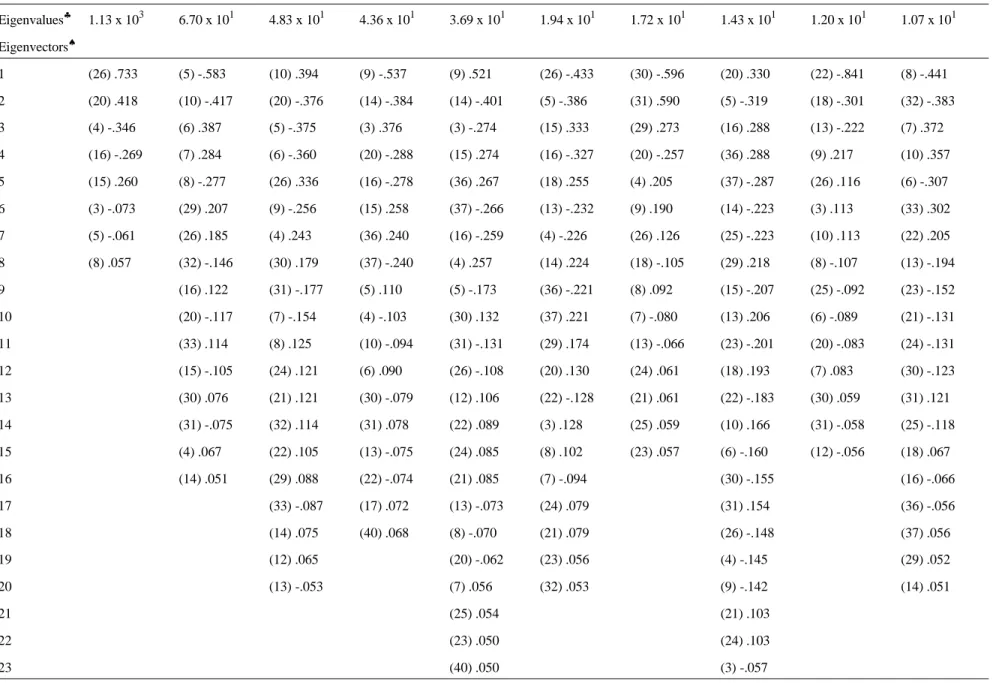
Table 3. Eigenvalues and eigenvectors for the MVK photooxidation mechanism.
Eigenvalues♣ 1.13 x 10³ 6.70 x 101 4.83 x 101 4.36 x 101 3.69 x 101 1.94 x 101 1.72 x 101 1.43 x 101 1.20 x 101 1.07 x 101
Eigenvectors♠
1 (26) .733 (5) -.583 (10) .394 (9) -.537 (9) .521 (26) -.433 (30) -.596 (20) .330 (22) -.841 (8) -.441
2 (20) .418 (10) -.417 (20) -.376 (14) -.384 (14) -.401 (5) -.386 (31) .590 (5) -.319 (18) -.301 (32) -.383
3 (4) -.346 (6) .387 (5) -.375 (3) .376 (3) -.274 (15) .333 (29) .273 (16) .288 (13) -.222 (7) .372
4 (16) -.269 (7) .284 (6) -.360 (20) -.288 (15) .274 (16) -.327 (20) -.257 (36) .288 (9) .217 (10) .357
5 (15) .260 (8) -.277 (26) .336 (16) -.278 (36) .267 (18) .255 (4) .205 (37) -.287 (26) .116 (6) -.307
6 (3) -.073 (29) .207 (9) -.256 (15) .258 (37) -.266 (13) -.232 (9) .190 (14) -.223 (3) .113 (33) .302
7 (5) -.061 (26) .185 (4) .243 (36) .240 (16) -.259 (4) -.226 (26) .126 (25) -.223 (10) .113 (22) .205
8 (8) .057 (32) -.146 (30) .179 (37) -.240 (4) .257 (14) .224 (18) -.105 (29) .218 (8) -.107 (13) -.194
9 (16) .122 (31) -.177 (5) .110 (5) -.173 (36) -.221 (8) .092 (15) -.207 (25) -.092 (23) -.152
10 (20) -.117 (7) -.154 (4) -.103 (30) .132 (37) .221 (7) -.080 (13) .206 (6) -.089 (21) -.131
11 (33) .114 (8) .125 (10) -.094 (31) -.131 (29) .174 (13) -.066 (23) -.201 (20) -.083 (24) -.131
12 (15) -.105 (24) .121 (6) .090 (26) -.108 (20) .130 (24) .061 (18) .193 (7) .083 (30) -.123
13 (30) .076 (21) .121 (30) -.079 (12) .106 (22) -.128 (21) .061 (22) -.183 (30) .059 (31) .121
14 (31) -.075 (32) .114 (31) .078 (22) .089 (3) .128 (25) .059 (10) .166 (31) -.058 (25) -.118
15 (4) .067 (22) .105 (13) -.075 (24) .085 (8) .102 (23) .057 (6) -.160 (12) -.056 (18) .067
16 (14) .051 (29) .088 (22) -.074 (21) .085 (7) -.094 (30) -.155 (16) -.066
17 (33) -.087 (17) .072 (13) -.073 (24) .079 (31) .154 (36) -.056
18 (14) .075 (40) .068 (8) -.070 (21) .079 (26) -.148 (37) .056
19 (12) .065 (20) -.062 (23) .056 (4) -.145 (29) .052
20 (13) -.053 (7) .056 (32) .053 (9) -.142 (14) .051
21 (25) .054 (21) .103
22 (23) .050 (24) .103
23 (40) .050 (3) -.057
V
o
l.
9
, N
o
. 6
, 1
9
9
8
K
in
e
tic
A
n
al
y
si
s o
f t
h
e
G
as
-P
h
a
se
R
ea
c
tio
n
s o
f M
et
h
y
l V
in
y
l K
e
to
n
e
5
5
Eigenvalues♣ 9.00 9.00 8.94 7.79 7.27 6.32 5.70 4.84 4.27 3.95
Eigenvectors♠
1 (23) -.864 (24) .701 (25) -.788 (13) .438 (18) .778 (32) .473 (4) -.495 (15) .557 (14) .610 (16) -.426
2 (25) .375 (21) -.701 (13) -.384 (21) .420 (20) -.294 (33) -.400 (14) .369 (16) .415 (4) .403 (21) -.405
3 (13) -.213 (23) -.116 (22) .235 (24) .420 (25) -.207 (13) .392 (36) .332 (21) -.281 (16) -.321 (24) -.405
4 (32) .115 (32) .213 (32) -.283 (26) .202 (8) -.367 (37) -.331 (24) -.281 (13) .273 (15) -.378
5 (18) -.114 (18) -.207 (18) -.245 (23) -.199 (7) .316 (15) -.319 (13) .252 (36) .267 (8) .245
6 (33) -.098 (33) -.182 (33) .230 (5) .159 (18) -.231 (9) .276 (20) -.247 (37) -.267 (7) -.233
7 (21) .094 (23) -.133 (25) -.219 (22) -.157 (16) -.177 (20) -.254 (9) .238 (15) .160 (13) .232
8 (24) -.094 (6) .101 (23) -.217 (9) .155 (4) -.149 (3) .205 (3) .202 (9) -.138 (5) -.162
9 (22) .055 (10) -.099 (4) -.163 (13) .114 (36) -.142 (22) .197 (12) -.194 (25) -.136 (32) -.153
10 (6) .055 (40) .060 (3) .148 (32) .108 (37) .142 (13) -.164 (17) -.158 (23) -.134 (33) .139
11 (10) -.054 (20) -.129 (36) -.099 (14) -.131 (25) .110 (4) -.154 (22) -.128 (14) -.135
12 (16) -.128 (37) .099 (10) .115 (23) .104 (23) -.085 (20) .114 (29) .111
13 (9) .125 (33) -.097 (26) -.093 (16) -.068 (5) -.079 (40) -.098 (9) .111
14 (36) -.123 (8) -.090 (6) -.091 (21) .065 (14) .075 (8) -.077 (23) -.110
15 (37) .123 (16) -.089 (12) .078 (24) .065 (25) -.071 (7) .070 (17) .110
16 (22) .115 (29) -.086 (3) .061 (12) .058 (8) .070 (12) -.053 (25) -.103
17 (8) .077 (15) -.083 (15) -.058 (32) .057 (7) -.065 (20) -.096
18 (7) -.061 (7) .077 (25) .051 (33) -.051 (6) -.057 (3) .073
19 (15) .061 (12) -.069 (37) -.055 (18) -.067
20 (26) -.054 (24) .053 (36) .055 (26) -.051
21 (21) .053
22 (6) .052
5
5
6
P
im
e
n
te
l &
A
rb
ill
a
J
. B
ra
z.
C
h
em
. S
o
c
Eigenvalues♣ 1.60 1.41 7.45 x 10⁻¹ 5.33 x 10⁻¹ 1.46 x 10⁻¹ 8.79 x 10⁻² 7.41 x 10⁻² 4.73 x 10⁻² 2.08 x 10⁻² 1.85 x 10⁻²
Eigenvectors♠
1 (3) .784 (29) .871 (12) .643 (12) -.628 (11) -.776 (17) .787 (6) .489 (33) .697 (34) .828 (38) -.751
2 (4) .369 (5) .393 (40) -.591 (40) -.590 (38) -.410 (40) -.499 (10) .437 (32) .573 (19) .298 (34) .412
3 (20) .358 (30) .195 (17) -.321 (17) -.364 (12) -.248 (11) -.228 (11) .383 (7) -.270 (11) -.262 (7) .181
4 (9) .240 (31) -.194 (38) -.251 (16) -.166 (6) .176 (38) .148 (7) -.354 (8) -.261 (38) .257 (6) -.179
5 (22) .099 (6) .114 (14) -.143 (34) -.147 (16) .147 (8) -.296 (6) .151 (17) -.199 (39) .177
6 (12) .094 (11) -.096 (13) -.140 (39) -.141 (15) .081 (33) -.254 (10) .113 (39) -.162 (17) .175
7 (26) .077 (22) -.081 (38) .115 (40) .133 (33) -.068 (32) -.211 (34) .059 (12) .094 (10) -.169
8 (15) -.074 (13) -.072 (15) -.103 (7) -.127 (39) -.064 (38) -.176 (27) -.067 (8) .162
9 (25) .074 (25) -.070 (6) -.075 (10) .117 (34) .061 (34) .171 (33) -.063 (11) .160
10 (18) .070 (7) -.069 (11) .068 (17) -.103 (32) -.058 (39) .156 (12) -.130
11 (23) .067 (23) -.064 (22) .057 (8) -.096 (10) .054 (12) -.113 (35) .126
12 (14) -.064 (34) -.062 (25) .055 (32) -.082 (19) .050 (33) .102
13 (16) .062 (15) .057 (7) .054 (33) -.078 (32) .076
14 (29) -.057 (23) .050 (1) .069
V
o
l.
9
, N
o
. 6
, 1
9
9
8
K
in
e
tic
A
n
al
y
si
s o
f t
h
e
G
as
-P
h
a
se
R
ea
c
tio
n
s o
f M
et
h
y
l V
in
y
l K
e
to
n
e
5
5
Eigenvalues♣ 6.96 x 10⁻³ 2.14 x 10⁻³ 1.93 x 10⁻³ 1.32 x 10⁻³ 8.09 x 10⁻⁴ 4.61 x 10⁻⁴ 2.59 x 10⁻⁴ 2.18 x 10⁻⁵ 5.11 x 10⁻⁶ 2.42 x 10⁻⁶
Eigenvectors♠
1 (7) .534 (39) -.588 (39) -.632 (19) .674 (27) -.848 (1) .771 (31) -.673 (2) .993 (28) .996 (37) .706
2 (8) .498 (19) .468 (1) .516 (35) .585 (39) .246 (35) -.590 (30) -.665 (39) .063 (27) -.062 (36) .706
3 (10) .451 (27) -.447 (35) .411 (1) .300 (19) -.244 (39) .166 (27) -.235 (28) -.054
4 (6) .445 (35) -.265 (19) -.371 (34) -.235 (31) .211 (19) .122 (35) .136
5 (33) .134 (38) -.234 (11) .115 (39) .209 (30) .209 (30) -.078 (19) -.124
6 (32) .115 (11) .233 (27) .066 (11) -.055 (35) .149 (31) -.078 (39) .075
7 (27) .106 (1) -.153 (2) .065 (7) .051 (1) .137 (38) .060
8 (39) -.083 (34) -.151 (11) -.101
9 (35) -.080 (17) .057 (38) .076
10 (2) -.078 (7) .057
11 (8) .054
12 (28) -.054
13 (6) .051
14 (10) .051
♣ Each column represents a principal component, that is a group of coupled reactions. The eigenvalues indicate the effectiveness of each group in changing the modeling results.
♠ First entry refers to the rate constant for the reaction listed in Table 1 and second entry lists eigenvector components. The eigenvectors give the relative importance of each reaction in the group.
5
5
8
P
im
e
n
te
l &
A
rb
ill
a
J
. B
ra
z.
C
h
em
. S
o
c
(CH3CH2ONO + hν→ CH3CH2O + NO) and the oxidation
of the CH3CH2O radicals (CH3CH2O + O2→ CH3CHO +
HO2). Reaction (5) accounts for ca. 92% of OH radical
formed and the only significant sources of NO are the photodecomposition of ethyl nitrite (8%) and NO2 (91%),
reactions (26) and (10), respectively. Since we had no data on photolysis light intensities during the experiments, the ethyl nitrite photodecomposition coefficient was estimated from experimental data (Fig. 1) and values, which gave consistent results for other photodecompositions, were used. The photolysis rates were also consistent with the value reported in the literature42 for NO2
photodecomposi-tion under the same experimental condiphotodecomposi-tions. Also, photo-chemical reactions of other species, not including NO2
photodecomposition, are of negligible importance com-pared with other paths. As expected, the set of reactions (Table 1) accounts for the MVK photooxidation in good agreement with experimental data (Fig. 3). As presented in
Figs. 2 and 4, simulated results for the formation of the main products, glycolaldehyde, methylglyoxal and formalde-hyde, show a slight deviation mainly for longer times.
In the simulation conditions, formaldehyde is formed both from acetaldehyde, the initial product of ethyl nitrite photolysis, reaction (26), and by the sequence of reactions initiated by OH radical oxidation of MVK:
CH3C(O)CH=CH2 + OH + (O2) → 0.28 CH3C(O)
CH(OH)CH2O2 + 0.72 CH3C(O)CH(O2)CH2OH
The rate of production analysis shows that 63% of formaldehyde is formed through reaction (13), CH3O +
(O2) → HCHO + HO2 and 37% through the reaction
sequence (20), (21) and (22), which involve the reaction of CH3C(O)CH(OH)CH2O2 with NO. Under the modeling
conditions, the secondary reactions of formaldehyde are of minor importance. As observed experimentally24,42, the formed formaldehyde reacts essentially with OH radicals which are in relatively high concentrations (calculated
Vol. 9, No. 6, 1998 Kinetic Analysis of the Gas-Phase Reactions of Methyl Vinyl Ketone 559
Figure 2. Simulated and experimental data for the main products of the
gas-phase reactions of MVK with the OH radical in the presence of NOx
as a function of reaction time.
Figure 1. Simulated and experimental data for the ethyl nitrite photode-composition as a function of reaction time.
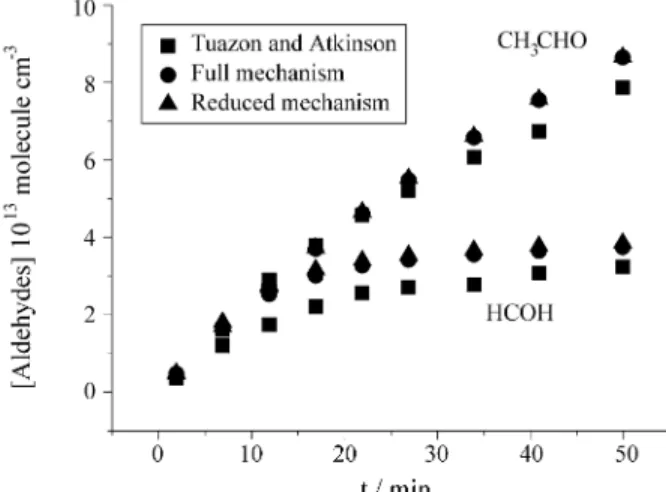
Figure 4. Simulated and experimental data for aldehyde concentrations as a function of reaction time.
values about 0.5-1.0 x 10⁷ molecule cm-3). Nevertheless, the rate of this reaction path is 5.1% of the total formation rate and, in comparison with OH radical reaction (11) (HCHO + OH + (O2) → HO2 + CO + H2O), the
photo-chemical decompositions (39) and (40) (HCHO + (2 O2) +
hν→ 2 HO2 + CO and HCHO + hν→ H2 + CO) are of
non-negligible importance (26%).
In the conditions of this simulation, the formation of acetaldehyde (Fig. 4) and peroxyacetyl nitrate (PAN) (Fig. 5) can be attributed to the photooxidation of ethyl nitrite42. The simulated results are in good agreement with experi-mental data only for peroxyacetyl nitrate. The main dis-crepancy between the experimental results and the model predictions is higher concentrations of calculated acetalde-hyde. The reasons for this discrepancy are not well estab-lished, but may be associated to the large uncertainty in the related kinetic parameters. In comparison with OH radical reaction (CH3CHO + OH + (O2) → CH3CO3 + H2O), the
acetaldehyde photochemical decompositions (CH3CHO +
(2 O2) + hν→ CH3O2 +HO2 +CO) are of non-negligible
importance, as shown by the principal component analysis. The 1st and 2nd principal components in Table 3 show that ethyl nitrite photodecomposition, reaction (26), oxida-tion of MVK, reacoxida-tion (20), PAN chemistry, reacoxida-tions (15) and (16), and OH/NO chemistry, reactions (3), (4) and (5), are strongly coupled and are the most influential reaction sequence in the mechanism. Thus, a small deviation in k20
or j26 should greatly affect the simulation results.
According to the magnitude of the eigenvalues and significant entries (≥ 0.20) of the corresponding eigenvec-tor, the individual reactions may be classified in three groups:
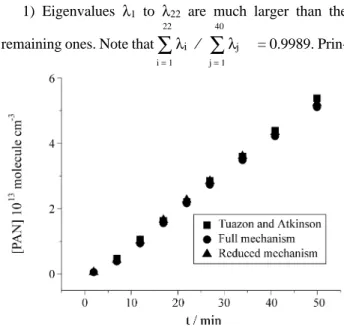
1) Eigenvalues λ1 to λ22 are much larger than the
remaining ones. Note that
∑
i = 1 22
λi ⁄
∑
j = 1 40
λj = 0.9989.
Prin-cipal components Ψ1 to Ψ22 contain steps (3)-(10),
(12)-(16), (18), (20)-(26), (29)-(33), (36) and (37), forming the ‘‘basic’’ part of mechanism. According to Ψ1, the most
influential reaction sequence is formed by (26), (20), (4), (16) and (15). This ‘‘reaction kernel’’ emphasizes that the largest effect is brought about by setting the parameters j26
and k20. Reactions (4), (15) and (16) largely affects the
NO/NO2 ratio and the simulated results. Due to the
cou-pling of the individual reactions, this ratio not only depends on the rate of reactions (20) and (26) but also on all the reactions involving NOx. Since j26 is an estimated
parame-ter, some deviations of the simulated results may be attrib-uted to it. An uncertainty analysis of this parameter shows that a change of 10% in j26 leads to a substantial change of
all product concentrations (6.8% in glycoaldehyde 9.8% in methylglyoxal and 7.3% in formaldehyde). The inclusion of another minor path of reaction, such as the formation of alkylnitrates, might affect the NO/NOx ratios by a
non-neg-ligible amount.
2) According Ψ23 to Ψ27, reactions (11), (12), (17), (38)
and (40), are of ‘‘transitional’’ importance. As it will be shown, in spite of their small contributions they can not be removed from the mechanism.
3) Reactions (1), (2), (19), (27), (28), (34), (35) and (39) contained in Ψ28 to Ψ41 with eigenvalues below 2.52x10⁻²
are unimportant and can be eliminated.
As shown in Table 4, eliminating the last group of reactions causes small changes in concentrations and only the HCHO concentration shows a deviation greater than others (8.8%) because of the elimination of reaction (39). If this reaction is included in the reduced mechanism, this deviation decreases to 2.89%. However, additional elimi-nation of steps (11), (12), (17), (38) and (40) (i.e. reactions of ‘‘transitional’’ importance) leads to large deviations (Ta-ble 4). That is, no further reduction of the mechanism is possible since all concentration changes should be small.
The rank of reactions by overall sensitivity (Table 2) suggests that reaction 39 may be eliminated. However, this
Figure 5. Simulated and experimental data for the peroxyacetyl nitrate (PAN) concentrations as a function of reaction time.
Table 4. Comparison of concentration deviations from full mechanism, eliminating of steps (1), (2), (19), (27), (28), (34), (35) and (39) (column A) and also steps (11), (12), (17), (38) and (40) (column B).
Deviations (%)
Compounds A B
MVK -0.87 -5.20
Ethyl Nitrite -0.26 -0.26
Glycolaldehyde 1.58 9.49
Methylglyoxal 1.61 9.27
Formaldehyde 8.80 29.27
Acetaldehyde 0.14 17.90
PAN 2.51 -14.19
elimination leads to large deviations (e.g. at t = 49.9 min the deviation for HCHO is 8.8%). The rate reaction rank (Table 2) gives a different rank of reactions and is not an effective way of reducing a mechanism. Individual rates do not consider the interactions between reactions and may lead to incorrect conclusions about the relevance of indi-vidual reactions. Consequently, as previously shown the rate of production analysis is a good method for the explo-ration of the reaction pathways.
Conclusions
The mechanism of Table 1 is quite successful in repro-ducing chamber data for the oxidation of MVK by OH radicals. The rate of production analysis gives useful infor-mation in determining the main reaction pathways.
Rate of production results in combination with principal component analysis show that reaction are strongly cou-pled and confirm that the most influential reactions paths are the ethyl nitrite photolysis, the MVK oxidation and the chemistry of NOx, PAN and OH radical. On the basis of the
calculated eigenvalues, the mechanism can be reduced to 33 reactions. No further reduction is possible since all concentration changes should be small. Certainly, the con-clusions taken from the eigenvalue-eigenvector analysis are only valid for the rather narrow range of conditions of the smog chamber experiments. However, the information seems useful for identifying a minimal reaction set and for assessing the relationships and dependencies among the parameters.
Since reactions (21) - (25) form the basic part of the mechanism, the estimation of their rate constants may lead to a considerable uncertainty in the simulated results. Thus, further experiments with this system, in order to study those reaction paths, would be important for the improvement of atmospheric photochemical mechanisms.
Acknowledgements
The authors gratefully acknowledge CAPES and FAPERJ for partial financial support, NCE/UFRJ for com-puting facilities on the SP2 supercomputer, and Prof. T. Turányi (Central Research Institute for Chemistry, Buda-pest, Hungary) for a free copy of the KINAL package.
Note
All calculations were performed using the KINAL package43.
References
1. Arnts, R.R.; Gay Jr., B.W. In Photochemistry of some
naturally emitted hydrocarbons, EPA-600 3-79-081,
September, 1979.
2. Gu, C.L.; Rynard, C.M.; Hendry, D.G.; Mill, T.
Envi-ron. Sci. Technol. 1985, 19, 151.
3. Tuazon, E.C.; Atkinson, R. Int. J. Chem. Kinet. 1990,
22, 1221.
4. Kamens, R.M.; Gery, M.W.; Jeffries, H.E.; Jackson, M.; Cole, E.I. Int. J. Chem. Kinet. 1982, 14, 955. 5. Niki, H.; Maker, P.D.; Savage, C.M.; Breitenbach,
L.P. Environ. Sci. Technol. 1983, 17, 312A.
6. Rasmussen, R.A. Environ. Sci. Technol. 1970, 4, 667. 7. Rasmussen, R.A. J. Air Pollut. Control Assoc. 1972,
22, 537.
8. Tingey, D.T.; Manning, M.; Grothaus, L.C.; Burns, W.F. Physiol. Plants 1979, 47, 112.
9. Zimmerman, P.R. In Determination of emission rates
of hydrocarbons from indigenous species of vegeta-tion in the Tampa/St. Petersburg FL, area,
EPA-904/9-77-028, 1979.
10. Isidorov, V.A.; Zenkevich, I.G.; Ioffe, B.V. Atmos.
Environ. 1985, 19, 1.
11. Lamb, B.; Westberg, H.; Allwine, G.; Quarles, T. J.
Geophys. Res. 1985, 90, 2380.
12. Zimmerman, P.R.; Chatfield, R.B.; Fishman, J.; Crutzen, P.J.; Hanst, P.L.; Geophys. Res. Lett. 1978,
5, 679.
13. Lamb, B.; Guenther, A.; Gay, D.; Westberg, H. Atmos.
Environ. 1987, 21, 1695.
14. Zimmerman, P.R.; Greenberg, J.P.; Westberg, C.E. J.
Geophys. Res. 1988, 93, 1047.
15. Lloyd, A.C.; Atkinson, R.; Lurmann, F.W.; Nitta, B.
Atmos. Environ. 1983, 17, 1931.
16. Killus, J.P.; Whitten, G.Z. Environ. Sci. Technol.
1984, 18, 142.
17. Vajda, S.; Valko, P.; Turányi, T. Int. J. Chem. Kinet.
1985, 17, 55.
18. Dickinson, R.P.; Gelinas, R.J. J. Comp. Phys. 1976,
21, 123.
19. Hwang, J.T.; Dougherty, E.P.; Rabitz, S.; Rabitz, H.
J. Chem. Phys. 1978, 69, 5180.
20. Dougherty, E.P.; Hwang, J.T.; Rabitz, H. J. Chem.
Phys. 1979, 71, 1794.
21. Edelson, D.; Allara, L. Int. J. Chem. Kinet. 1980, 12, 605.
22. Turányi, T.; Bérces, T.; Vajda, S. Int. J. Chem. Kinet.
1989, 21, 83.
23. Turányi, T. J. Math. Chem. 1990, 5, 203.
24. Tuazon, E.C.; Atkinson, R. Int. J. Chem. Kinet. 1989,
21, 1141.
25. Atkinson, R. Atmos. Environ. 1990, 24A, 1.
26. Pimentel, A.S.; Arbilla, G. Química Nova 1997, 20, 252.
27. Carter, W.P.L. Atmos. Environ. 1990, 24A, 481. 28. Atkinson, R. J. Phys. Chem. Ref. Data 1989,
Mono-graph n. 1, 1.
29. Atkinson, R. J. Phys. Chem. Ref. Data 1994, Mono-graph n. 2, 1.
30. Atkinson, R.; Baulch, D.L.; Cox, R.A.; Hampson Jr., R.F.; Kerr, J.A.; Troe, J. J. Phys. Chem. Ref. Data
1992, 21, 1125.
31. Atkinson, R.; Baulch, D.L.; Cox, R.A.; Hampson Jr., R.F.; Kerr, J.A.; Troe, J.; J. Phys. Chem. Ref. Data
1989, 18, 881.
32. Atkinson, R. Int. J. Chem. Kinet. 1997, 29, 99. 33. Steinfeld, J.I.; Francisco, J.S.; Hase, W.L. In
Chemi-cal Kinetics and Dynamics, Prentice-Hall, Engle
wood Cliffs, NJ, 1989.
34. Pilling, M.J.; In Modern Gas Kinetics, Pilling, M.J.; Smith, I.W.M., eds., Blackwell, Oxford, 1987. 35. Hirst, D.M. In A Computational Approach to
Chem-istry, Blackwell Scientific Publications, Oxford,
1990.
36. Turányi, T. J. Math. Chem. 1990, 5, 203.
37. Turányi, T.; Bérces, T.; Vajda, S. Int. J. Chem. Kinet.
1989, 21, 83.
38. Vajda, S.; Valko, P.; Turányi, T. Int. J. Chem. Kinet.
1985, 17, 55.
39. Gelinas, R.J. Science Applications, Inc., Preprint No AI/PL/C279, 1979.
40. Kee, R.J.; Grear, J.F.; Smooke, M.D.; Miller, J.A. Sandia National Labs., SAND 85-8240, 1985. 41. Gardiner, Jr., W.C. J. Phys. Chem. 1977, 81, 2367. 42. Carter, W.P.L.; Tuazon, E.C.; Ashmann, S.M.; In
Inves-tigation of the Atmospheric Chemistry of Methyl tert-bu-tyl ether (MTBE), prepared for the Auto/Oil Air Quality
Improvement Research Program, January, 1991. 43. Turányi, T. Comp. Chem. 1990, 14, 253-254.