https://doi.org/10.1038/s41430-017-0082-x
ARTICLE
Dairy products and total calcium intake at 13 years of age and its
association with obesity at 21 years of age
Tiago Marabujo1●Elisabete Ramos1,2●Carla Lopes1,2
Received: 2 August 2016 / Revised: 5 August 2017 / Accepted: 15 December 2017 / Published online: 25 January 2018 © Macmillan Publishers Limited, part of Springer Nature 2018
Abstract
Background/objectives Dairy products and specifically calcium have been suggested to play a role in obesity development but more longitudinal evidence is still needed. The objective of this study was to assess the association between dairy products and total calcium intake at age 13 and body mass index at age 21.
Subjects/methods This longitudinal study included 2159 individuals from the Epidemiological Health Investigation of Teenagers cohort (EPITeen), Porto, Portugal, evaluated at ages 13 and 21. Assessment consisted of anthropometrics measurements and structured questionnaires namely a semi-quantitative food frequency questionnaire to appraise food consumption in the past 12 months. Linear regression models were run in 941 individuals with complete information of confounders: gender, follow-up period, parents’ education, physical activity, energy, and total calcium intake.
Results Negative association was found on total calcium intake at age 13 with BMI at age 21 (model 0:β = −0.059 (95% CI:−0.113, −0.004) and model 1: −0.057 (95% CI: −0.113, −0.002)), however, no statistically significant association was found when adjusting for energy intake (model 2:β = −0.031 (95% CI: −0.110, 0.047). There were no associations between milk, yogurt, and cheese consumption at age 13 and BMI at age 21 when adjusting for confounders.
Conclusions This study did not support an independent effect of dairy products or total calcium intake in adolescence on later early adulthood adiposity.
Introduction
Worldwide obesity is one of the most prevalent evitable disease in the world, increasing to more than double in three decades [1]. The prevalence of overweight and obesity in children and adolescents is increasing at worrying rates, both in developed and developing countries [2, 3]. Since these entities are preponderant risk factors for cardiovas-cular disease, metabolic syndrome, and type 2 diabetes mellitus [4,5] efforts should be made to reduce this trend. Among the multiple modifiable risk factors, the role of calcium in the obesity pathophysiology needs to be clarified
[2,6] and its importance in fat accumulation in children and adolescents remains to be definitely established [7–9].
One of the most cited mechanisms is the impact of intracellular calcium in lipid metabolism inside the adipo-cytes [10]. In fact, the decrease in intracellular calcium induced by the decrease of parathyroid hormone (PTH) and 1,25(OH)2D3 [11] promotes a decrease in lipogenesis and
an increase in lipolysis and fat oxidation [7]. Furthermore, 1,25(OH)2D3also has a role in the size of fat storage inside
adipocytes [12] and in their differentiation and proliferation [13]. Other plausible mechanisms were also proposed for the possible beneficial effect of calcium in adiposity. The decrease of fat absorption enhanced by calcium binding to bile acids and by forming insoluble fatty acid soaps [14] leads to an increase of fecal fat excretion which eventually will diminish the energy intake. Another explanation is that nutrients from dairy products can also be related to body fat regulation. For instance, conjugated linoleic acid and pro-teins influence fat accumulation and regulation of appetite, respectively [7].
Some review studies support the hypothesis that dairy consumption is inversely associated with the development * Carla Lopes
carlal@med.up.pt
1 Department of Public Health and Forensic Sciences, and Medical
Education, Faculty of Medicine, University of Porto, Porto, Portugal
2 EPIUnit, Institute of Public Health (ISPUP), University of Porto,
Porto, Portugal
123456789
of childhood obesity [5,7,8,15,16]. Observational studies have been showing results of a negative relationship between dairy consumption and body mass index (BMI) [17–22], body fat mass [23,24], abdominal circumference [21, 25–27] and skin folds [21,26] both cross-sectionally [21, 25–27] and longitudinally [17–20, 22–24], however none of these studies evaluated calcium intake effect. Additionally meta-analysis of observational studies [15,16] and randomized controlled trials [16, 28, 29], in children and adolescents, showed discrepant results. Although ben-eficial influence of calcium intake in long-time obesity is supported mostly by cross-sectional studies there is the need to confirm this effect with more longitudinal and experi-mental studies.
The aim of this study was to evaluate the association of total calcium intake and dairy consumption at 13 years of age and BMI at 21 years of age.
Subjects and methods
Participants
The participants in this study are part of the Epidemiolo-gical Health Investigation of Teenagers cohort (EPITeen), Porto, Portugal [30], which started in the academic year 2003/2004 and was carried out in public and private schools in Porto, Portugal. These individuals were born in 1990 and were evaluated at ages 13, 17, and 21. In this study, only measurements from ages 13 and 21 were used because dietary assessment was not conducted at age 17.
At the beginning of the cohort, 2159 of 2942 eligible adolescents (73.4%) agreed to participate in the study. For the data analysis, 986 participants with complete informa-tion for weight, height and milk, yogurt, and cheese intake, in both moments of evaluation, were included.
Therefore, outliers were excluded (n = 45) when meeting the following criteria: missing answer to 57 or more items of food; total energy intake more than 3 times the inter-quartile range over the third inter-quartile or under the first quartile; intake of fruit or vegetables more than more than 1.5 times the interquartile range over the third quartile or under thefirst quartile. After exclusions, sample ended with 941 participants for statistical analysis.
Data collection
Data collection was assessed by questionnaire including sociodemographic variables (age, gender, parents’ educa-tion, aggregate monthly income, and social class), medical history (diagnosis of diabetes, asthma, and eating dis-orders), and behavioural aspects (smoking status, alcohol drinking, physical activity, and food intake including
calcium supplementation). Dietary assessment was per-formed by using a semi-quantitative food frequency ques-tionnaire (FFQ) relative to consumption of 86 food items in the previous 12 months, with frequency varying from never to 6 or more per day. The questionnaire was validated to adult population [31] and adapted for adolescents [32]. Total calcium intake was evaluated multiplying the fre-quency by the correspondent pre-determined food mean portion sizes and using the software“Food Processor Plus” version 7 (ESHA Research, Salem, OR, USA) adapted for Portuguese foods, as previously described [31].
Physical activity at age 13 was defined as extracurricular physical activities with at least 20 min of duration and at age 21 it was adapted to adult life pattern, i.e., physical exercise at free time from most of the time sitting to most of the time active. Anthropometry was performed by trained health professionals and applying standardized procedures. Weight and height were measured with the participants wearing light clothing and no shoes. Weight was measured in kilograms with decimal approximation through digital scale (Tanita TBF-300, Tanita Corporation of America, Inc., Illinois, USA) and height was measured in meters with decimal approximation through portable stadiometer (seca 213, seca gmbh & co., Hamburg, Deutschland).
At age 13, participants were classified according to the Centers for Disease Control and Prevention, USA, with underweight/normal-weight if BMI was below the 85th percentile, overweight if BMI was at or above the 85th percentile, and as obese if the BMI was at or above the 95th percentile [33]. At age 21, WHO classification for adults [34] was used: underweight, <18.5 kg/m2; normal-weight, ≥18.5 and <25 kg/m2; overweight, ≥25 and <30 kg/m2;
obese, ≥30 kg/m2.
Statistical analysis
All statistical procedures were performed in the software “Statistical Package for the Social Sciences” (SPSS) v23.0 (IBM Corporation, New York, NY, USA). The exposures categorical variables that were frequency of milk con-sumption (sum of skim, semi-skimmed, and full fat milks), yogurt, cheese, and dairy products consumption (total sum of milks, yogurt, and cheese) were converted to continuous variables by multiplying the frequency of each dairy pro-duct by the specified mean portion size (244 g for a cup of milk, 125 g for one yogurt and 30 g for a slice of cheese). Exposures were categorized into three groups of frequency of consumption or tertiles for compare purposes and also converted to continuous variables for estimation of asso-ciation with BMI. The obtained values were taken per 100 g of eaten food and in the case of calcium per 100 mg ingested.
Underweight and normal-weight BMI categories at age 21 were combined for comparison with categories at age 13. Parents’ years of education, corresponding to the maximum complete years of both parents at age 13, was grouped according to usually Portuguese study cycles.
Data were described according to gender and groups were compared using chi-square test for categorical vari-ables, t-test and ANOVA for continuous variables. Sig-nificance level was settled to ≤0.05. Linear regression
models were performed to estimate the association between the various baseline exposures and BMI at 21 years of age. Concerning the possible existence of different confounders three models were defined. Model 0 was crude model; Model 1 was adjusted for gender, follow-up period, parents maximum education level, and extracurricular physical activities with at least 20 min of duration at age 13; Model 2 was model 1 plus adjustment for free time physical activity and energy intake at age 21; Model 3 was model 2 plus Table 1 Participants’ characteristics at 13 and 21 years of age by gender
13 years old 21 years old
Girls (n = 501) Boys (n = 440) Girls (n = 501) Boys (n = 440)
n (%) p-value2 n (%) p-value2 BMI (kg/m2) Underweight/Normal weight 390 (77.8) 327 (74.3) 407 (81.2) 311 (70.7) Overweight 73 (14.6) 69 (15.7) 67 (13.4) 107 (24.3) Obese 38 (7.6) 44 (10.0) 0.343 27 (5.4) 22 (5.0) <0.001
Parents education maximum level
1–4th grade 44 (9) 44 (10.3) – – 5–6th grade 52 (10.7) 32 (7.5) – – 7–9th grade 85 (17.5) 69 (16.1) – – 10–11th grade 72 (14.8) 46 (10.7) – – 12th grade 82 (16.8) 90 (21) – – College 152 (31.2) 147 (34.3) 0.116 – –
Extracurricular physical activity1
Never 114 (23.1) 42 (9.8) – –
Less than once a week 62 (12.6) 28 (6.5) – –
Once a week 69 (14) 42 (9.8) – –
2 to 3 times a week 177 (35.8) 142 (33.1) – –
4 to 6 times a week 33 (6.7) 76 (17.7) – –
Almost all days of the week 39 (7.9) 99 (23.1) <0.001 – – Free time physical activity
Most time sitting – – 149 (29.7) 150 (34.2)
Most time standing and/or walking (not running)
– – 262 (52.3) 189 (43.1)
Most time very active – – 90 (18.0) 100 (22.8) 0.016
Intake per day Mean (SD) p value3 Mean (SD) p value3
Energy (MJ/kcal) 10.1 (3.0) / 2421.8 (708.7) 10.3 (2.8) / 2455.3 (683.7) 0.462 8.6 (2.4) / 2046.6 (576.5) 10.1 (3.3) / 2515.3 (777.4) <0.001 Milk (g) 393.5 (290.1) 419.5 (281.7) 0.164 292.9 (221.8) 292.8 (223.8) 0.999 Yogurt (g) 104.1 (95.6) 101.5 (95.3) 0.674 101.9 (86.8) 96.1 (94.1) 0.325 Cheese (g) 16.1 (20.8) 15 (17.8) 0.361 15.2 (15.0) 18.5 (19.0) 0.004 Dairy products (g) 513.7 (314.4) 535.9 (311.7) 0.277 410 (234.4) 407.4 (253.8) 0.87 Calcium (mg) 1129.7 (447.3) 1144.9 (446.6) 0.604 966.9 (350.6) 1106.6 (489.2) <0.001
1Extracurricular physical activities with at least 20 min of duration 2Tested with chi-square test
adjustment for total calcium intake at age 21. Possible confounders such as alcohol intake, smoking, self-reported diabetes, asthma and eating disorders, calcium supplements, monthly household income, and social class were tested and did not influence the final models.
Ethical considerations
Conditions for appropriate confidentiality and data protec-tion were guaranteed in all procedures. Both the participants and their parents have been informed about the purpose and study design through oral and written information and written informed consents were also obtained from both parts. The development of EpiTeen cohort had ethical approval from the Ethics Committee for Health of the Hospital de São João/Faculty of Medicine of Porto University.
Results
Descriptive characteristics of the sample at 13 and 21 years of age, by gender, are shown in Table1. At age 13, 7.6% of girls and 10.0% of boys were obese while at age 21 these prevalences were 5.4 and 5.0%, respectively. Over 30% of individuals have at least one parent with higher education and more than 50% with at least 10 years of education. Boys have significantly higher physical activity than girls in both moments. At age 13, no significant differences were observed between boys and girls regarding the intake of energy or calcium and consumption of dairy products. At age 21, boys consumed significantly more energy, cheese and calcium than girls.
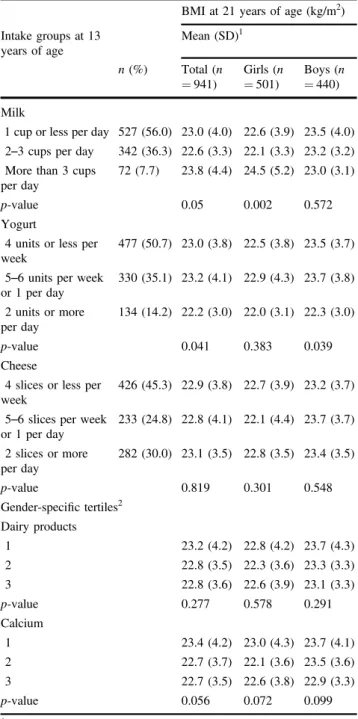
Table2shows the BMI mean at age 21 of the sample by groups of milk, yogurt, cheese, dairy products, and total calcium intake at age 13. Considering the total sample and regarding categories of milk, yogurt, cheese, total dairy products, and total calcium intake, significant differences of BMI mean values were observed only in yogurt. Significant differences were observed in the BMI mean values according to category of milk in girls (p = 0.002) and according to category of yogurt in boys (p = 0.039). The higher mean values of BMI were found in the highest category of milk and the lower were found in the highest category of yogurt.
Associations from linear regression between milk, yogurt, cheese, and dairy products (per 100 g) and calcium (per 100 mg) intake at age 13 and BMI at age 21 are shown in Table 3. Negative associations were found for all expo-sures, however, statistical significant associations were only found for total calcium intake in crude model and in model 1 (model 0:β = −0.059 (95% CI: −0.113, −0.004); model 1: β = −0.057 (95% CI: −0.113, −0.002)). After further adjustment for physical activity, energy and total calcium intake at age 21 the effect did not remained statistically significant. The energy intake at age 21 was the variable that showed more influence in the final model. The analysis was also performed according to gender and similar results were found.
Table 2 Mean of body mass index at 21 years of age according to groups of dairy products and calcium intakes by gender
BMI at 21 years of age (kg/m2)
Intake groups at 13 years of age Mean (SD)1 n (%) Total (n = 941) Girls (n = 501) Boys (n = 440) Milk
1 cup or less per day 527 (56.0) 23.0 (4.0) 22.6 (3.9) 23.5 (4.0) 2–3 cups per day 342 (36.3) 22.6 (3.3) 22.1 (3.3) 23.2 (3.2) More than 3 cups
per day
72 (7.7) 23.8 (4.4) 24.5 (5.2) 23.0 (3.1)
p-value 0.05 0.002 0.572
Yogurt
4 units or less per week
477 (50.7) 23.0 (3.8) 22.5 (3.8) 23.5 (3.7)
5–6 units per week or 1 per day 330 (35.1) 23.2 (4.1) 22.9 (4.3) 23.7 (3.8) 2 units or more per day 134 (14.2) 22.2 (3.0) 22.0 (3.1) 22.3 (3.0) p-value 0.041 0.383 0.039 Cheese
4 slices or less per week
426 (45.3) 22.9 (3.8) 22.7 (3.9) 23.2 (3.7)
5–6 slices per week or 1 per day 233 (24.8) 22.8 (4.1) 22.1 (4.4) 23.7 (3.7) 2 slices or more per day 282 (30.0) 23.1 (3.5) 22.8 (3.5) 23.4 (3.5) p-value 0.819 0.301 0.548 Gender-specific tertiles2 Dairy products 1 23.2 (4.2) 22.8 (4.2) 23.7 (4.3) 2 22.8 (3.5) 22.3 (3.6) 23.3 (3.3) 3 22.8 (3.6) 22.6 (3.9) 23.1 (3.3) p-value 0.277 0.578 0.291 Calcium 1 23.4 (4.2) 23.0 (4.3) 23.7 (4.1) 2 22.7 (3.7) 22.1 (3.6) 23.5 (3.6) 3 22.7 (3.5) 22.6 (3.8) 22.9 (3.3) p-value 0.056 0.072 0.099
1Tested with ANOVA test
2Girls: Tertile 1< 319.0 g; Tertile 2 ≥ 319.0 g and <665.6 g; Tertile
3≥ 665.6 g. Boys: Tertile 1 < 321.1 g; Tertile 2 ≥ 321.1 g and <676.4 g; Tertile 3≥ 676.4 g
3Girls: Tertile 1< 889.7 mg; Tertile 2 ≥ 899.7 and <1283.6 mg; Tertile
3≥ 1283.6 mg Boys: Tertile 1 < 923.7 mg; Tertile 2 ≥ 923.7 mg and <1280.4 mg; Tertile 3 ≥ 1280.4 mg
Mean difference of total calcium intake according to changes in BMI categories between age 13 and 21, by gender, was also analysed (data not shown) and no statis-tical significant differences were found between categories.
Discussion
The main result of this study was the lack of association between the dairy products or total calcium intake at age 13 and later BMI at age 21. Although a tendency for negative association between total calcium intake and adiposity was observed, the association did not remained statistically significant after adjustment for energy intake. These results are consistent with Berkey et al. [35] which results showed that milk intake in individuals aged between 9 and 14 years old was negatively and significantly associated with BMI 3 years later. However, this effect was lost when adjusted for energy intake. Other longitudinal studies conducted in adolescents showed no association between the consump-tion of milk [20, 36, 37] or dairy products [38] and BMI with adjustment for energy intake [34,36] and for calories from fat [20]. Also a meta-analysis of randomized con-trolled trials in adults [39] concluded that the consumption of dairy products is not associated with weight change or fat mass when the intervention is not energy restricted or when the time of intervention is long.
The decrease in the amount of daily ingested calcium between ages 13 and 21 found in the present study was consistent with the pronounced decline in milk consumption considering that this is an important source of calcium in the diet practiced in Western countries. This reduction in milk consumption was also observed in a study conducted in the Framingham cohort [20] revealing the replacement of milk for soft drinks through adolescence thereby increasing energy intake. Thus, the amount of energy consumed seems to have a fundamental role in BMI and, if it is reduced, it can enhance the possible benefit of dairy consumption,
especially low-fat dairy. Besides energy, other dairy com-ponents could have an effect on adiposity. Longitudinal studies in English [22] and North American adolescents [40] showed that milk consumption in individuals between ages 10 and 15 was negatively associated with BMI, both with adjustment for energy intake [22] or unadjusted [40]. Other cross-sectional studies [27, 41, 42] and a meta-analysis [16] also showed negative association but some attention must be given especially on cross-sectional studies since reverse causality could be present.
The inconsistency between studies could also be explained by several factors such as the different meth-odologies used. For example, to estimate body fat of the individuals, the standard method would be to measure objectively fat percentage or fat mass [43], but using BMI, despite being also suitable [43], it is more inaccurate because it corresponds to the total body mass/m2. However, from studies conducted in adolescents using body fat as outcome, only one cross-sectional study [44] and one longitudinal study [20] showed negative association. Moreover, cross-sectional [28, 40], longitudinal [38, 45] and randomized controlled trials studies [46, 47] failed to establish any relationship between milk or dairy consump-tion and fat percentage or fat mass. Another methodological difference was the dietary data collection method in which researchers used either the semi-quantitative FFQ or the 3-day dietary record. Although data from diaries is more accurate, the FFQ is one of the most used alternatives in large population studies and it was considered a valid method for the purpose of group comparisons [31]. The questionnaire used in the present study showed to be valid for nutritional assessment in the Portuguese adult popula-tion [31] and in pregnant women [48]. To minimize the relative imprecision, a larger sample size is possibly needed to achieve the adequate statistical power. We also decided to exclude extreme outliers based on energy intake and on fruit and vegetables intake, since these food items could reflect any misreporting beyond the energy intake, namely Table 3 Association (β) between dairy products and calcium intake at 13 years of age and body mass index at 21 years of age
Intake per day at 13 years of age1 BMI at 21 years of age (kg/m2)
β (95% CI)2
Model 0 Model 1 Model 2 Model 3
Milk −0.015 (−0.099, 0.070) −0.021 (−0.107, 0.066) −0.005 (−0.091, 0.081) −0.018 (−0.106, 0.069) Yogurt −0.247 (−0.501, 0.008) −0.247 (−0.504, 0.011) −0.208 (−0.462, 0.046) −0.226 (−0.481, 0.029) Cheese −0.638 (−1.889, 0.613) −0.392 (−1.658, 0.875) −0.228 (−1.480, 1.024) −0.291 (−1.544, 0.962) Dairy products −0.043 (−0.119, 0.033) −0.044 (−0.122, 0.033) −0.033 (−0.109, 0.043) −0.044 (−0.122, 0.033) Calcium −0.059 (−0.113, −0.004) −0.057 (−0.113, −0.002) −0.037 (−0.092, 0.019) −0.045 (−0.101, 0.011)
1Milk, yogurt, cheese and dairy products are taken per 100 g and calcium is taken per 100 mg
2Model 0: crude model; Model 1: adjusted for follow-up period, parents maximum education level and physical activity at age 13; Model 2: model
for food items that could be sources of calcium intake. The regression models with and without outliers were performed and the estimates were similar. The use of this FFQ allows the estimation of ingested calcium from a large number of different foods and at same time the estimation of energy intake, used as a main possible confounder.
Yet, other strengths and limitations of this study deserve discussion. The longitudinal study design reduces the effect of reverse causality. Additionally, the availability of a considerable number of possible confounders used in the final models was an advantage. However, we could not exclude the possibility of residual confounders by other unmeasured variables.
Some limitations are also present in this study. There was no evaluation for pubertal growth stage, seric concentra-tions of 1,25(OH)2D3and PTH, and calcium retention [49],
that are important factors in calcium metabolism and utili-zation during adolescence [7]. The fact that only two follow-up evaluations being considered in the current study may difficult the analysis of a tracking effect. The possible confounding by BMI at age 13 was not taken into account in this study since it could be considered an intermediate step in the causal chain. The possible beneficial effect of calcium can be attenuated by the theory that most adoles-cents stays in the same BMI category in the future adult-hood [50]. The fact that more than 60% of adolescents in this study at age 13 above the 85th percentile were con-sidered overweight or obese at age 21 supports that theory (data not shown). Another factor that may also be involved is the increasing globalization of nourishment which leads to that food exposures are increasingly similar among individuals, which results in the difficulty in finding asso-ciations with relevant magnitude.
In this longitudinal study, no statistically significant relation was found between dairy products or total calcium intake at age 13 and BMI at age 21. The results of this study, associated with other studies developed on this topic, suggest no effect or modest beneficial effect of calcium, not independent of energy intake. More longitudinal and interventional studies in adolescents assessing total calcium intake and adjusting for energy intake are needed to eluci-date this possible effect.
Acknowledgements This study was funded by FEDER through the Operational Programme Competitiveness and Internationalization and national funding from the Foundation for Science and Technology— FCT (Portuguese Ministry of Science, Technology and Higher Edu-cation) (POCI-01-0145-FEDER-016829), under the project MetHyOS (Ref. FCT PTDC/DTP-EPI/6506/2014) and the Unidade de Investi-gação em Epidemiologia—Instituto de Saúde Pública da Universidade do Porto (EPIUnit) (POCI-01-0145-FEDER-006862; Ref. UID/DTP/ 04750/2013). Also this study was developed with the support of the research teams of the Department of Public Health and Forensic Sci-ences, and Medical Education, Faculty of Medicine of Porto
University; the EPIUnit—Public Health Institute of Porto University; and the EPITeen Cohort Study.
Compliance with ethical standards
Conflict of interest The authors declare that they have no conflict of interest.
References
1. World Health Organization (WHO). Media centre: Obesity and overweight. Fact sheet N°311. 2015.
2. de Onis M, Blossner M, Borghi E. Global prevalence and trends of overweight and obesity among preschool children. Am J Clin Nutr. 2010;92:1257–64.
3. Ng M, Fleming T, Robinson M, Thomson B, Graetz N, Margono C, et al. Global, regional, and national prevalence of overweight and obesity in children and adults during 1980–2013: a systematic analysis for the Global Burden of Disease Study 2013. Lancet. 2014;384:766–81.
4. Guh DP, Zhang W, Bansback N, Amarsi Z, Birmingham CL, Anis AH. The incidence of co-morbidities related to obesity and overweight: a systematic review and meta-analysis. BMC Public Health. 2009;9:88.
5. Astrup A. Yogurt and dairy product consumption to prevent cardiometabolic diseases: epidemiologic and experimental studies. Am J Clin Nutr. 2014;99:1235S–1242S.
6. Tremblay A, Gilbert JA. Human obesity: is insufficient calcium/ dairy intake part of the problem? J Am Coll Nutr. 2011;30:449S–453S.
7. Dougkas A, Reynolds CK, Givens ID, Elwood PC, Minihane AM. Associations between dairy consumption and body weight: a review of the evidence and underlying mechanisms. Nutr Res Rev. 2011;24:72–95.
8. Dror DK, Allen LH. Dairy product intake in children and ado-lescents in developed countries: trends, nutritional contribution, and a review of association with health outcomes. Nutr Rev. 2014;72:68–81.
9. Louie JC, Flood VM, Hector DJ, Rangan AM, Gill TP. Dairy consumption and overweight and obesity: a systematic review of prospective cohort studies. Obes Rev. 2011;12:e582–592. 10. Vaskonen T. Dietary minerals and modification of cardiovascular
risk factors. J Nutr Biochem. 2003;14:492–506.
11. Zemel MB. Mechanisms of dairy modulation of adiposity. J Nutr. 2003;133:252S–256S.
12. Morris KL, Zemel MB. 1,25-dihydroxyvitamin D3 modulation of adipocyte glucocorticoid function. Obes Res. 2005;13:670–7. 13. Sun X, Morris KL, Zemel MB. Role of calcitriol and cortisol
on human adipocyte proliferation and oxidative and inflammatory stress: a microarray study. J Nutr Nutr. 2008;1:30–48.
14. Jacobsen R, Lorenzen JK, Toubro S, Krog-Mikkelsen I, Astrup A. Effect of short-term high dietary calcium intake on 24-h energy expenditure, fat oxidation, and fecal fat excretion. Int J Obes. 2005;29:292–301.
15. Lu L, Xun P, Wan Y, He K, Cai W. Long-term association between dairy consumption and risk of childhood obesity: a sys-tematic review and meta-analysis of prospective cohort studies. Eur J Clin Nutr. 2016;70:414–23.
16. Dror DK. Dairy consumption and pre-school, school-age and adolescent obesity in developed countries: a systematic review and meta-analysis. Obes Rev. 2014;15:516–27.
17. Moreira P, Padez C, Mourao I, Rosado V. Dietary calcium and body mass index in Portuguese children. Eur J Clin Nutr. 2005;59:861–7.
18. Dixon LB, Pellizzon MA, Jawad AF, Tershakovec AM. Calcium and dairy intake and measures of obesity in hyper and normo-cholesterolemic children. Obes Res. 2005;13:1727–38.
19. Skinner JD, Bounds W, Carruth BR, Ziegler P. Longitudinal calcium intake is negatively related to children’s body fat indexes. J Am Diet Assoc. 2001;103:1626–31.
20. Hasnain SR, Singer MR, Bradlee ML, Moore LL. Beverage intake in early childhood and change in body fat from preschool to adolescence. Child Obes. 2014;10:42–49.
21. Keast DR, Gallant KM, Albertson AM, Gugger CK, Holschuh NM. Associations between yogurt, dairy, calcium, and vitamin D intake and obesity among U.S. children aged 8–18 years: NHANES, 2005–2008. Nutrients. 2015;7:1577–93.
22. Bigornia SJ, LaValley MP, Moore LL, Northstone K, Emmett P, Ness AR, et al. Dairy intakes at age 10 years do not adversely affect risk of excess adiposity at 13 years. J Nutr. 2014;144:1081–90.
23. Carruth BR, Skinner JD. The role of dietary calcium and other nutrients in moderating body fat in preschool children. Int J Obes Relat Metab Disord. 2001;25:559–66.
24. Moore LL, Bradlee ML, Gao D, Singer MR. Low dairy intake in early childhood predicts excess body fat gain. Obesity. 2006;14:1010–8.
25. Lee HJ, Cho JI, Lee HS, Kim CI, Cho E. Intakes of dairy products and calcium and obesity in korean adults: korean national health and nutrition examination surveys (KNHANES) 2007–2009. PLoS ONE. 2014;9:e99085.
26. Bel-Serrat S, Mouratidou T, Jimenez-Pavon D, Huybrechts I, Cuenca-Garcia M, Mistura L, et al. Is dairy consumption asso-ciated with low cardiovascular disease risk in European adoles-cents? Results from the HELENA Study. Pediatr Obes. 2014;9:401–10.
27. Abreu S, Santos R, Moreira C, Santos PC, Vale S, Soares-Miranda L, et al. Relationship of milk intake and physical activity to abdominal obesity among adolescents. Pediatr Obes. 2014;9:71–80.
28. Christensen R, Lorenzen JK, Svith CR, Bartels EM, Melanson EL, Saris WH, et al. Effect of calcium from dairy and dietary supplements on faecal fat excretion: a meta-analysis of rando-mized controlled trials. Obes Rev. 2009;10:475–86.
29. Gonzalez JT, Rumbold PLS, Stevenson EJ. Effect of calcium intake on fat oxidation in adults: a meta-analysis of randomized, controlled trials. Obes Rev. 2012;13:848–57.
30. Ramos E, Barros H. Family and school determinants of over-weight in 13-year-old Portuguese adolescents. Acta Pædiatrica. 2007;96:281–6.
31. Lopes C, Aro A, Azevedo A, Ramos E, Barros H. Intake and adipose tissue composition of fatty acids and risk of myocardial infarction in a male Portuguese community sample. J Am Diet Assoc. 2007;107:276–86.
32. Araújo J, Severo M, Lopes C, Ramos E. Food sources of nutrients among 13-year-old Portuguese adolescents. Public Health Nutr. 2011;14:1970–8.
33. Kuczmarski RJ, Ogden CL, Guo SS, Grummer-Strawn LM, Fle-gal KM, Mei Z, et al. 2000 CDC growth charts for the United States: methods and development. Vital Health Stat. 2002;11:1–190.
34. Clinical guidelines on the identification, evaluation, and treatment of overweight and obesity in adults: executive summary. Expert panel on the identification, evaluation, and treatment of over-weight in adults. Am J Clin Nutr. 1998;68:899–917.
35. Berkey CS, Rockett HR, Willett WC, Colditz GA. Milk, dairy fat, dietary calcium, and weight gain: a longitudinal study of adoles-cents. Arch Pediatr Adolesc Med. 2005;159:543–50.
36. Striegel-Moore RH, Thompson D, Affenito SG, Franko DL, Obarzanek E, Barton BA, et al. Correlates of beverage intake in adolescent girls: the national heart, lung, and blood institute growth and health study. J Pediatr. 2006;148:183–7.
37. Lin SL, Tarrant M, Hui LL, Kwok MK, Lam TH, Leung GM, et al. The role of dairy products and milk in adolescent obesity: evidence from Hong Kong’s “Children of 1997” birth cohort. PLoS ONE. 2012;7:e52575.
38. Phillips SM, Bandini LG, Cyr H, Colclough-Douglas S, Naumova E, Must A. Dairy food consumption and body weight and fatness studied longitudinally over the adolescent period. Int J Obes Relat Metab Disord. 2003;27:1106–13.
39. Chen M, Pan A, Malik VS, Hu FB. Effects of dairy intake on body weight and fat: a meta-analysis of randomized controlled trials. Am J Clin Nutr. 2012;96:735–47.
40. Vanselow MS, Pereira MA, Neumark-Sztainer D, Raatz SK. Adolescent beverage habits and changes in weight over time: findings from Project EAT. Am J Clin Nutr. 2009;90:1489–95. 41. Moore LL, Singer MR, Qureshi MM, Bradlee ML. Dairy intake
and anthropometric measures of body fat among children and adolescents in NHANES. J Am Coll Nutr. 2008;27:702–10. 42. Murphy MM, Douglass JS, Johnson RK, Spence LA. Drinking
flavored or plain milk is positively associated with nutrient intake and is not associated with adverse effects on weight status in US children and adolescents. J Am Diet Assoc. 2008;108:631–9. 43. Boeke CE, Oken E, Kleinman KP, Rifas-Shiman SL, Taveras EM,
Gillman MW. Correlations among adiposity measures in school-aged children. BMC Pediatr. 2013;13:99.
44. Noel SE, Ness AR, Northstone K, Emmett P, Newby PK. Asso-ciations between flavored milk consumption and changes in weight and body composition over time: differences among nor-mal and overweight children. Eur J Clin Nutr. 2013;67:295–300. 45. Noel SE, Ness AR, Northstone K, Emmett P, Newby PK. Milk intakes are not associated with percent body fat in children from ages 10–13 years. J Nutr. 2011;141:2035–41.
46. Merrilees MJ, Smart EJ, Gilchrist NL, Frampton C, Turner JG, Hooke E, et al. Effects of diary food supplements on bone mineral density in teenage girls. Eur J Nutr. 2000;39:256–62.
47. Cadogan J, Eastell R, Jones N, Barker ME. Milk intake and bone mineral acquisition in adolescent girls: randomised, controlled intervention trial. BMJ. 1997;315:1255–60.
48. Pinto E, Severo M, Correia S, dos Santos Silva I, Lopes C, Barros H. Validity and reproducibility of a semi-quantitative food fre-quency questionnaire for use among Portuguese pregnant women. Matern Child Nutr. 2010;6:105–19.
49. Zhu K, Greenfield H, Zhang Q, Du X, Ma G, Foo LH, et al. Growth and bone mineral accretion during puberty in Chinese girls: a 5-year longitudinal study. J Bone Miner Res. 2008;23:167–72.
50. Power C, Lake JK, Cole TJ. Measurement and long-term health risks of child and adolescent fatness. Int J Obes Relat Metab Disord. 1997;21:507–26.