Contents of students lunchboxes in private schools of São Paulo, Brazil
Composição de lancheiras de alunos de escolas particulares de São PauloComposición de las iambreras de alumnos de escuelas privadas de São Paulo, Brasil
Tatiana Tenorio Matuk1, Paula Cristina S. Stancari2, Milena Baptista Bueno3, Eliana Menegon Zaccarelli4
Instituição: Universidade Paulista (Unip), São Paulo, SP, Brasil
1Especialista em Nutrição Clínica pelo Grupo de Nutrição Humana (Ganep); Orientadora de Estágio de Alimentação Escolar do Curso de Nutrição da Unip, São Paulo, SP, Brasil
2Especialista em Saúde da Família pela Faculdade Santa Marcelina; Nutricionista do Núcleo de Apoio à Saúde da Família, São Paulo, SP, Brasil
3Doutora em Saúde Pública pela Faculdade de Saúde Pública da Universidade de São Paulo (FSP-USP); Professora Titular do Curso de Nutrição da USP, São Paulo, SP, Brasil
4Mestre em Nutrição pela FSP-USP; Supervisora de Estágio de Nutrição em Saúde Pública do Curso Nutrição da Unip, São Paulo, SP, Brasil
ABStrACt
Objective: To evaluate the composition of lunchboxes of
children attending second to ifth grades of private schools in São Paulo, Brazil.
Methods: This cross-sectional study was performed
in five units of a private school, located in different regions of the metropolitan area of São Paulo, Brazil. Every lunchbox was checked for three non-consecutive days in the year 2008. All children from second to fifth grades of these units (n=501) were studied and catego-rized according to the presence or absence of each food group in the lunchboxes on at least one of the three days of observation.
Results: Among the children studied, 82% brought
cereals, 67% artiicial juices and other beverages, 65% milk and dairy foods, 51% cake, biscuits and cereal bars with ill-ing and/or icill-ing and 35% sausages in at least one day. The frequency of students who brought fruit and natural juices was 33%, and vegetables 4%. Girls more often took fruits and vegetables to school (p<0.05). Older students more often did not carry lunchboxes to the school, compared to younger ones, during the three days of observation (11 and 4% respectively; p<0,05).
Conclusions: The composition of the school lunchboxes,
despite some positive aspects, was inadequate. Lunchboxes presented over-processed foods, usually with a high con-tent of sugar, fat and sodium, and absence of fruits and vegetables.
Key-words: school feeding; child; food habits.
reSumo
Objetivo: Avaliar qualitativamente a composição das
lancheiras de crianças do segundo ao quinto ano do ensino fundamental de escolas privadas de São Paulo.
Métodos: O delineamento do estudo foi transversal e a coleta
de dados foi realizada em cinco unidades de uma rede particular de ensino, localizadas em regiões distintas da Grande São Paulo. A observação dos lanches ocorreu em três dias não consecutivos do ano de 2008 para cada criança. A amostra foi constituída pela totalidade de crianças do segundo ao quinto ano do ensino fundamental (n=501). Os alunos foram categorizados segundo a presença ou não de cada um dos grupos de alimentos nas lan-cheiras em pelo menos um dos três dias de observação.
Resultados: Dentre as crianças estudadas, 82% trouxeram
cereais; 67% sucos artiiciais e outras bebidas; 65% leite e alimentos lácteos; 51% bolo, bolacha e barra de cereais reche-ados e/ou com cobertura e 35% embutidos, em pelo menos uma dia de coleta. A frequência de frutas e sucos naturais foi de 33%, e de verduras e legumes foi de 4%. Meninas levaram para a escola com mais frequência frutas e hortaliças (p<0,05). Alunos maiores deixaram de levar lanche à escola mais frequentemente do que os menores nos três dias de observação (11 e 4%, respectivamente; p<0,05).
Conclusões: A composição das lancheiras dos escolares, apesar
de alguns aspectos positivos, mostrou-se inadequada. Houve ex-cesso de alimentos industrializados, geralmente ricos em açúcares, gorduras e sódio e baixa presença de frutas, verduras e legumes.
Palavras-chave: alimentação escolar; criança; hábitos
alimentares.
Endereço para correspondência: Tatiana Tenorio Matuk
Rua Redentore Gonfiantini, 80 – Vila São Francisco CEP 05351-020 – São Paulo/SP
E-mail: tatmatuk@uol.com.br
Conflito de interesse: nada a declarar
reSumeN
Objetivo: Evaluar cualitativamente la composición de
las iambreras de niños del segundo al quinto año de la Primaria de escuelas privadas de la región metropolitana de São Paulo (Brasil).
Métodos: La delineación del estudio fue transversal y la
recolección de datos fue realizada en cinco unidades de una red privada de enseñanza, ubicadas en regiones distintas de la región metropolitana de São Paulo. La observación de las meriendas fue realizada por tres días no consecutivos del año de 2008 para cada niño. La muestra fue constituida por la totalidad de niños del segundo al quinto año de la Primaria (n=501). Los alumnos fueron categorizados según presencia o ausencia de cada uno de los grupos de alimentos en las iambreras en como mínimo uno de los tres días de observación.
Resultados: Entre los niños estudiados, 82% trajeron
cereales, 67% jugos artiiciales y otras bebidas, 65% leche y alimentos lácteos, 51% bizcocho, galletas y barras de cereales rellenas y/o con cobertura y 35% embutidos en por lo menos un día de recolección. La frecuencia de frutas y jugos naturales fue de 33% y de verduras y legumbres fue de 4%. Niñas llevaron para la escuela con más frecuencia frutas y hortalizas (p<0,05). Alumnos mayores dejaron de llevar merienda a la escuela más frecuentemente que los menores en los tres días de observación (11% y 4% respec-tivamente y p<0,05).
Conclusiones: La composición de las iambreras de los
escolares, a pesar de algunos aspectos positivos, se mostró inadecuada. Hubo exceso de alimentos industrializados, ge-neralmente ricos en azúcares, grasas y sodio y baja presencia de frutas, verduras y legumbres.
Palabras clave: alimentación escolar; niño; hábitos
alimentares.
Introduction
Similarly to other developing countries, Brazil is undergoing a period of nutritional transition primarily caused by changes in the lifestyle and eating habits of its population(1). While malnutrition rates decline, there are increasing overweight rates. It is possible to find malnutrition, overweight, nutrient deiciency, and non-transmissible chronic diseases in the same community or even in the same household(2).
Studies have shown that the prevalence of overweight in children ranges from 10.8% to 33.8% in different regions of Brazil. An important aspect about the prevalence of excess body fat in childhood is related to the occurrence of early adverse health effects. Another relevant point is the association between childhood obesity and its persistence into adulthood(3).
Children’s eating patterns have been changing. The increased number of types of foods typical of the postmodern society has brought great advantages because it facilitates transportation, storage, preparation, and enrichment of foods with nutrients. On the other hand, attractive advertisements, packaging, and labels encourage excessive consumption of foods rich in sugars, sodium, fats, and low in iber, vitamins, and minerals(4).
The family is the irst institution that inluences the eating habits of individuals. Parents are responsible for purchasing and preparing food at home; thus, their eating habits are passed on to their children(5).
During child development, parents are seen as examples to be followed and imitated. Thus, nutritionally adequate choices will be incorporated into children’s future behaviors if their parents’ diet is consistent with the diet they advocate(4,6). There is an interaction between eating habits acquired within the family and those learned in school, and they can inluence one another(7).
The school is considered an important space for the development of health, self-esteem, behaviors, and skills for the life of students, being a place conducive to the development of healthy eating habits(8). Children spend much time at school and when there is no distribution of food at school, they eat snacks they bring from home or purchase at the school cafeteria(7). The analysis of these snacks is essential to the planning of strategies aiming to improve the nutritional quality of such foods. The objective of the present study was to evaluate the foods students bring from home. The participants were second to ifth graders from private schools located in the metropolitan region of São Paulo, Brazil.
method
was approved by the board of management of each school. Students’ parents or guardians were informed about the purpose of the study and received information on the topic. This study was approved by the Research Ethics Committee of Universidade Paulista (Unip).
For data collection, we used a form containing the following information about the students: date of birth, gender, and grade. Previously trained senior undergraduate students of nutrition from a private university completed a detailed dietary record of the food brought from home on three different days, including description of the food, quantity, and brand. The researchers illed out the form before the class break, in the classroom, after asking students to expose their snacks on their desk.
Our sample (n=501) consisted of all students from the second to the ifth grades of primary school, between seven and 13 years old, both genders, attending school in the morning, and enrolled at ive schools belonging to a chain of private schools.
Foods were grouped based on the products listed as recommended or not recommended by the current legislation on school meals – the Interministerial Decree No. 1010(9) and the Resolution No. 38 of the National Education Development Fund (FNDE)(10) – particularly regarding the content of certain nutrients (calcium, ibers, sugars, fats, and sodium). Thus, the foods were divided into 13 groups: milk and dairy products (yogurt, chocolate milk, cheese, processed cheese spread, and fermented milk); fruits and natural juices (coconut water and 100% natural juices); vegetables; soft drinks; artiicial fruit juices and other beverages (teas, energy drinks, beverages containing soy, isotonic drinks, and hypotonic drinks); cereals (breads, cookies without illing or icing, toasts, cakes without illing or icing, breakfast cereal – corn lakes, granola, oat, corn lakes with chocolate – and cereal bars with no icing or illing); roasted snacks (pie, cheese bread, croissant); snacks and fried foods (industrialized snacks, potato chips, popcorn and fried snacks such as deep-fried chicken croquette, rissoles, deep-deep-fried pastries), cold cuts and sausages (sausage, pork, ham, turkey breast); oils and fats (pâté, mayonnaise, margarine, butter, olive oil); sweets (chocolate, candy, gum, lollipops, sugar, and cream – condensed milk, hazelnut cream, jelly, honey, milk-based dessert with chocolate – and other sweets – peanut candy, coconut candy, chocolate fudge candy, beijinho (Brazilian candy made of grated coconut), sweetened peanut, sweet pies, jelly; biscuits/cereal bars and/or cakes with illing and/or with icing (wafers, cookies, honey cookies, cake roll,
Brazilian doughnut, brownie, panettone, industrialized cakes); other foods (tuna, nuts, ketchup, baked corn, egg, olives, rice cakes).
For statistical analysis, all students were classified according to presence or absence of each one of the groups of foods in their lunchboxes on at least one of the three days of observation. The analysis was performed using Stata version 10.0. The chi-square test of proportions was used to assess differences between gender and grade. Signiicance level was set at p<0.05.
results
Of all students participating in the present study (n=501), 44 (9%) reported that they would not eat during the class break or they would buy food at the school cafeteria on all observation days. Most students who did not take snacks to school on any of the observation days belonged to the oldest age group (Chart 1).
Of the 457 students who took their lunchboxes to school at least on one observation day, 241 (53%) took snacks from home on the three observation days, 172 (38%) took snacks on two observation days, and 44 (10%) did it on one observation day. We could not evaluate the consumption of foods at school on one of the observation days for the whole sample because of the following factors: impossibility of identifying the type of juice included in the lunchbox (natural or artiicial) when the juice was not in its original recipient, birthday party (students did not take their lunchboxes on that day), absences, purchase of food from the school cafeteria, or no consumption of food. It is noteworthy that those children who had one or two observation days excluded from the study participated in
Graph 1 - Proportion of primary school students who did not take their lunchboxes to school on any of the observation days according to age group.
0 2 4 6 8 10 12
Youngest
Age group
%
Graph 3 - Proportion of primary school students from private schools according to the food groups found in their lunchbox and gender.
%
0 10 20 30 40 50
Fruits and natural juices
Girls
Boys
*
*
Vegetables
*p<0.05.
Graph 2 - Proportion of primary school students from private schools according to the foods found in their lunch boxes.
0 10 20 30 40 50 60 70 80 90
%
Cer eals
Artif icia
l juic es a
nd o ther
bev erag
es
Milk and
dai ry p
rodu cts
Bisc uits
/cer eal b
ars and
cake s w
ith fi lling
and/ or w
ith ic ing
Col d cu
ts a nd s
ausa ges
Frui ts a
nd n atur
al ju ices
Oils and
fats Sw
eets
Snac ks a
nd fr ied
food s
Soft drin
ks
Roa sted
sna cks
Vege tabl
es
Oth er fo
ods
the sample with the data of the observed snack. No child refused to participate or was absent from school on the three days of study.
Most students included in the final sample (n=457 children) were male (52%). The group consisting of younger children included 2nd and 3rd graders, totaling 185 individuals or 41% of the sample. The group including older participants included 4th and 5th graders from primary school, totaling 272 individuals (59%).
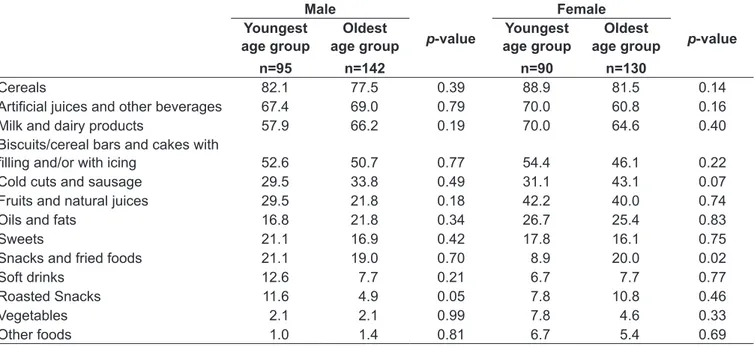
Chart 2 shows the proportion of students who included certain food groups in their lunchboxes on at least one day of data collection. Among the children investigated, 82% had cereals, 67% had artiicial juices and other beverages, and 65% had milk and dairy products. We found a high proportion of the groups “Cake, biscuits, and cereal bars with illing and/or icing,” and “Cold cuts and sausages” and a small presence of the group “Vegetables”.
Girls took more healthy foods such as fruits and natural juices, and vegetables, compared to boys (Chart 3). Table 1 shows that the group of older girls took fried snacks to school more often than the younger ones (p<0.05).
Discussion
The objective of the present study was to evaluate the foods that students usually take to school. With that purpose, we analyzed a sample of schoolchildren aged seven to 13 years attending private schools belonging to a chain of private schools of São Paulo during three non-consecutive days. The assessment of the usual consumption is a major challenge because people do not eat the same food every day. If the variation in the intake of certain foods is not taken into consideration, this can lead to underestimation or overestimation of the usual intake(11). The measurement error of the usual consumption was reduced after evaluating the snacks brought from home by more than 90% of the population during two or three days.
The results of this study revealed positive aspects, such as the frequency of cereals, milk and dairy foods, as well as negative aspects related to the proportion of children who took artiicial juices and other beverages, cakes, biscuits and cereal bars with illing and/or icing to school. The Interministerial Decree No. 1010(9), which established guidelines for the Promotion of Healthy Eating in Schools, provides that sweets, sandwich cookies, soft drinks, artiicial juices, fried foods, fried snacks, and cold cuts and sausages are unhealthy foods. This document recommends the consumption of sandwiches without mayonnaise, fruits, natural juices, soy-based juices, vegetables, yogurt and dairy drinks, among others. Resolution No. 38 of FNDE(10),
which provides about school meals offered to primary school students within the National Program of School Nutrition (PNAE), stimulates the inclusion of fruits and vegetables in school meals. In addition, the resolution prohibits the supply of soft drinks and artiicial juices and restricts the supply of sweets, cold cuts and sausages, and foods high in sodium and saturated fat.
Cereals and milk and dairy foods were among the three groups most frequently found in the lunchboxes (82% and 65%, respectively). On the other hand, fruits and natural juices ranked sixth among all groups (33%). Recent studies have also found a predominance of cereals in students’ lunchboxes(12,13). One of these studies involving third and fourth graders from a private school of the Federal District, Brazil, showed 28% of the cereal group, 25% of the fruit and natural juice group, and 5% of the dairy product group(12). An Australian study with children aged between ive and 12 years found that the group of breads was the most frequent (80%), whereas fruits were present in 68% of the lunchboxes, yogurt in 7%, and milk in only 3%(13).
We found a high frequency of foods not recommended by the Decree No. 1010(9) and the Resolution No. 38(10). The group “Artiicial juices and other beverages” was one of the most frequently found in the lunch boxes (67%). The groups “Cake, biscuits and cereal bars with illing and/or icing” (51%), “Cold cuts and sausages” (35%), and “Oils and fats” (23%) were also present in large amounts. A study involving preschool students from a private school of Araraquara, state
male
p-value
Female
p-value Youngest
age group
n=95
oldest age group
n=142
Youngest age group
n=90
oldest age group
n=130
Cereals 82.1 77.5 0.39 88.9 81.5 0.14
Artiicial juices and other beverages 67.4 69.0 0.79 70.0 60.8 0.16
Milk and dairy products 57.9 66.2 0.19 70.0 64.6 0.40 Biscuits/cereal bars and cakes with
illing and/or with icing 52.6 50.7 0.77 54.4 46.1 0.22
Cold cuts and sausage 29.5 33.8 0.49 31.1 43.1 0.07
Fruits and natural juices 29.5 21.8 0.18 42.2 40.0 0.74
Oils and fats 16.8 21.8 0.34 26.7 25.4 0.83
Sweets 21.1 16.9 0.42 17.8 16.1 0.75
Snacks and fried foods 21.1 19.0 0.70 8.9 20.0 0.02
Soft drinks 12.6 7.7 0.21 6.7 7.7 0.77
Roasted Snacks 11.6 4.9 0.05 7.8 10.8 0.46
Vegetables 2.1 2.1 0.99 7.8 4.6 0.33
Other foods 1.0 1.4 0.81 6.7 5.4 0.69
of São Paulo, demonstrated that sandwich cookies were the most common food (33%) in the students’ lunchboxes(7).
Children have an innate taste preference for sweetness and seem predisposed to foods with high caloric density, which provide greater satiety and are usually tasteful. Therefore, children choose foods high in carbohydrates, sugars, fats, and salt, rather than fruits and vegetables(14). Such habits seem to persist in adolescence. A study involving adolescents from public schools of Piracicaba, state of São Paulo, found a high intake of sweets: 78% of the sample exceeded the maximum amount recommended according to the Dietary Guidelines for Americans, with a mean daily consumption of 230mL of soft drinks and 550mL of sweetened beverages(15).
In addition, children and adolescents are inluenced by television advertisements and by the position of packages in the supermarket. A study has analyzed the lineup of the three major broadcast television networks in Brazil for seven months. Of the 1,395 food ads, 58% of the foods belonged to the group of oils, sugars and sweets. The second largest group was represented by breads, cereals, rice, and pasta (21%), followed by the group of milk, cheese, and yogurt (12%). There were no advertisements of fruits and vegetables(16).
In terms of gender, there was a higher proportion of girls who had healthy food in their lunchboxes: fruits, natural juices, and vegetables. A study on the daily consumption of fruits and vegetables involving schoolchildren from Guatemala also has shown that girls consumed a larger amount of these foods(17). In England, a study on the food consumption of children aged seven years used a three-day food diary to show that girls consumed more fruit and vegetables and boys ate more breakfast cereals(18). Studies conducted with Brazilian adults have shown higher daily consumption of fruits and vegetables among women(19,20). On the other hand, U.S. children and adolescents have not shown signiicant differences between genders regarding the daily consumption of fruits and vegetables(21). Further studies should be conducted to investigate the causes of the increased consumption of fruits and vegetables among girls.
As students get older, they buy food from the school cafeteria more often: 4% of the youngest students and 10% of the oldest ones reported they purchased food at the cafeteria and/or did not take snacks to school during the three days of
study. In comparison with the data from the present study, one third of children aged 9 to 10 years from a private school in the Federal District ate snacks from the cafeteria(12).
Some limitations of our study should be mentioned. Because the present study was based on the observation of the contents of students’ lunchboxes, the results may not relect the actual consumption. For example, some students may have consumed only their preferred items. The analysis of the lunchboxes was performed before the class break; thus, the students who reported buying food in the cafeteria were only expressing their intent, without actually observing this practice. Another relevant aspect was the impossibility of quantifying the amount of sugar added to fruit juices stored in recipients brought from home. Finally, no socioeconomic data was collected from the sample. However, it is possible to assume that this was a homogeneous population (upper middle and upper classes) because the children were enrolled at expensive private schools of São Paulo.
The National Program of School Nutrition is aimed at promoting health in public schools(22); however, according to the Decree 1010(9), private schools should also promote nutrition education programs. Options of quick and healthy foods could be suggested to be added to the school snacks, reducing the frequency of biscuits, stuffed cakes, and soft drinks. As children’s parents or guardians are responsible for choosing what their children will have for a snack, it is crucial that they are involved in nutritional education activities. It is noteworthy that the effort to change eating habits and make school meals more appropriate must be continuous and involve not only parents and guardians but also the whole school community (children, teachers, school staff, among others).
references
1. Triches RM, Giugliani ER. Obesidade, práticas alimentares e conhecimentos de nutrição em escolares. Rev Saude Publica 2005;39:541-7.
2. Coutinho JG, Gentil PC, Toral N. Malnutrition and obesity in Brazil: dealing with the problem through a uniied nutritional agenda. Cad Saude Publica 2008;24 (Suppl 2):S332-40.
3. Sociedade Brasileira de Pediatria - Departamento de Nutrologia. Obesidade na infância e adolescência. Manual de Orientação. São Paulo: SBP/Departamento de Nutrologia; 2008.
4. Pontes TE, Costa TF, Marum AB, Brasil AL, Taddei JA. Nutritional guidance for children and adolescents and the new consumption patterns: advertising, packaging and labeling. Rev Paul Pediatr 2009;27:99-105.
5. Gambardella AM, Frutuoso MF, Franch C. Prática alimentar de adolescentes. Rev Nutr 1999;12:55-63.
6. Rossi A, Moreira EA, Rauen MS. Determinants of eating behavior: a review focusing on the family. Rev Nutr 2008;21:739-48.
7. Campos JA, Zuanon AC. School lunch and health promotion. Cienc Odontol Bras 2004;7:67-71.
8. Brasil - Ministério da Saúde. Secretaria de Atenção à Saúde. Departamento de Atenção Básica [homepage on the Internet]. Manual operacional para proissionais de saúde e educação: promoção da alimentação saudável nas escolas (Série A. Normas e Manuais Técnicos) [cited 2008 Nov 24]. Brasília: Ministério da Saúde, 2008. Available from: http://bvsms.saude.gov.br/bvs/ publicacoes/manual_operacional_proissionais_saude_educacao.pdf 9. Brasil - Ministério da Saúde. Promoção da Alimentação Saudável nas Escolas
de educação infantil, fundamental e nível médio das redes públicas e privadas, em âmbito nacional. Portaria Interministerial 1010. Brasília: Ministério da Saúde, 2006.
10. Brasil - Ministério da Educação. Resolução/CD/FNDE nº 38. Dispõe sobre o atendimento da alimentação escolar aos alunos da educação básica no Programa Nacional de Alimentação Escolar - PNAE. Brasília: Ministério da Educação, 2009.
11. Fisberg RM, Slater B, Marchioni DM, Martini LA. Inquéritos alimentares: métodos e bases cientíicas. São Paulo: Manole; 2005.
12. Mesquita JH, Pinto PC, Sarmento CT. Peril qualitativo dos lanches escolares
consumidos em instituição de ensino particular do Distrito Federal – Brasil. Universitas: Cienc Saude 2006;4:49-62.
13. Sanigorski AM, Bell AC, Kremer PJ, Swinburn BA. Lunchbox contents of Australian school children: room for improvement. Eur J Clin Nutr 2005;59:1310-6.
14. Quaioti TC, Almeida SS. Psychobiological determinants of food behavior: an emphasis on environmental factors contributing to obesity. Psicol USP 2006;17:193-211.
15. Carmo MB, Toral N, Silva MV, Slater B. Consumption of sweets, soft drinks and sugar-added beverages among adolescents from public schools in Piracicaba, Sao Paulo. Rev Bras Epidemiol 2006;9:121-30.
16. Almeida SS, Nascimento PC, Quaioti TC. Amount and quality of food advertisement on Brazilian television. Rev Saude Publica 2002;36:353-5. 17. Montenegro-Bethancourt G, Doak CM, Solomons N. Fruit and vegetable intake
of schoolchildren in Quetzaltenango, Guatemala. Rev Panam Salud Publica 2009;25:146-56.
18. Glynn, L, Emmett P, Rogers I; ALSPAC Study Team. Food and nutrient intakes of a population sample of 7-year-old children in the south-west of England in 1999/2000 – what difference does gender make? J Hum Nutr Diet 2005; 18:7-19.
19. Jaime PC, Monteiro CA. Fruit and vegetable intake by Brazilian adults, 2003. Cad Saude Publica 2005;21:19-24.
20. Figueiredo IC, Jaime PC, Monteiro CA. Factors associated with fruit and vegetable intake among adults of the city of São Paulo, Southeastern Brazil. Rev Saude Publica 2008;42:777-85.
21. Field AE, Gillman MW, Rosner B, Rockett HR, Colditz GA. Association between fruit and vegetable intake and change in body mass index among a large sample of children and adolescents in the United States. Int J Obes Relat Metab Disord 2003;27:821-6.