Rita Bobone de Lucena
Advisor: Susana Frazão Pinheiro
Universal Health Coverage: a useful endeavor?
An analysis on the progress of coverage in the
CPLP countries
Dissertation submitted in Partial fulfillment of the requirements for the degree of Master of Science in Management at Católica‐Lisbon School of Business and Economics
ii
Abstract:
Title: Universal Health Coverage: a useful endeavor? An analysis on the progress of
coverage in the CPLP countries
Author: Rita Bobone de Lucena
Long has healthcare been at the center of socio-economical and political priorities. Providing accessible care to all is undeniably one of the most basic needs all populations must have access to. In the light of this, the World Health Organization developed the concept of Universal Health Coverage promoting access to health interventions at affordable costs.
Although the concept is still recent, major efforts are being made in this area, with countries sharing their experiences and investing deeply on innovative ways to improve their healthcare.
The purpose of this dissertation is to provide an overview on the evolution of Universal Health Coverage in a group of countries, to understand what efforts are still to be done, and what major setbacks are countries facing. The CPLP was chosen for its heterogeneous composition, enabling an interesting data comparison and illustrating well the global diversity in health provision. Therefore, a major focus is given on what is universal coverage, how to measure and monitor it, as well as what are the main obstacles on its way. To support these literary findings, data on the countries was collected and analyzed with different indicators picturing the current expenses in healthcare and evolution of population growth and availability of resources. Finally, to understand the correlation between indicators, a statistical measure was made proving repeatedly how countries are improving in their pursuit of universal coverage but how there is still room for improvement.
iii
Table of Contents
Introduction: ... 6
Literature Review: ... 8
An overview on global health: ... 8
What is Universal Coverage? ... 9
Monitoring progress: ... 11
Measuring UHC: ... 12
Obstacles to UHC: ... 14
Initiatives and choice of interventions... 15
UHC planning ... 16
Strategies to overcome inequalities: ... 17
Health care systems functions: ... 19
Analysis: ... 21
Methodology:... 21
Choice of countries and overview of each system: ... 21
Angola ... 22 Brazil ... 23 Cape Verde ... 25 Guinea-Bissau ... 26 Mozambique ... 28 Portugal ... 30
Sao Tome and Principe ... 31
Timor-Leste ... 33
Data comparison: trends and evolutions, major disparities ... 34
Health expenditures: ... 35
Population: ... 38
Resources: ... 41
Correlations: ... 43
Discussion: ... 48
Limitations and future research: ... 49
Conclusion:... 51
References: ... 53
Appendixes: ... 55
Appendix 1: Angola ... 55
Appendix 2: Brazil ... 57
iv
Appendix 4: Guinea-Bissau ... 61
Appendix 5: Mozambique ... 63
Appendix 6: Portugal ... 65
Appendix 7: Sao Tome and Principe... 67
v
List of Tables and Figures
Table 1- Angola Key Facts ... 22
Table 2- Brazil Key Facts ... 24
Table 3- Cape Verde Key Facts ... 25
Table 4- Guinea-Bissau Key Facts ... 27
Table 5- Mozambique Key Facts ... 28
Table 6- Portugal Key Facts ... 30
Table 7- Sao Tome and Principe Key Facts ... 31
Table 8- Timor-Leste Key Facts ... 33
Table 9- Total Health expenditure as a % of GDP ... 35
Table 10- Health expenditure per capita ... 36
Table 11- Health expenditure per capita: detail ... 37
Table 12-Out-of-pocket expenditures ... 37
Table 13- Private health expenditure ... 38
Table 14- CPLP Population ... 39
Table 15- Life expectancy ... 39
Table 16- Under-five deaths ... 40
Table 17- Number of physicians ... 41
Table 18- Number of midwives ... 41
Table 19- Number of hospital beds ... 42
Table 20- Sanitation facilities ... 42
Table 21- Clean water source ... 43
Figure 1- Angola's sources of funding ... 23
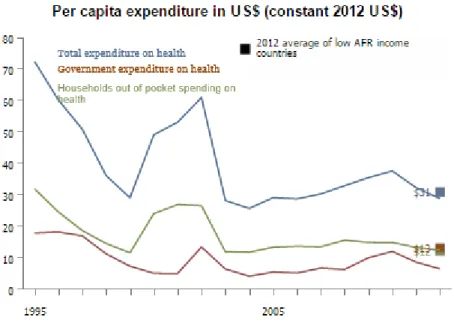
Figure 2- Angola's per capita expenditure ... 23
Figure 3- Brazil's sources of funding ... 24
Figure 4- Brazil's per capita expenditure ... 25
Figure 5- Cape Verde's sources of funding ... 26
Figure 6- Cape Verde's per capita expenditures ... 26
Figure 7- Guinea-Bissau's sources of funding ... 27
Figure 8- Guinea-Bissau's per capita expenditures ... 28
Figure 9- Mozambique's sources of funding ... 29
Figure 10- Mozambique's per capita expenditures ... 29
Figure 11- Portugal's sources of funding... 30
Figure 12- Portugal's per cpaita expenditures ... 31
Figure 13- Sao Tome and Principe's sources of funding ... 32
Figure 14- Sao Tome and Principe's per capita expenditures ... 32
Figure 15- Timor-Leste's sources of funding ... 33
6
Introduction:
“Healthcare systems must contribute to equity and social justice” (WHO, 2008)
Defending global access to healthcare seems a logical concept, one that is probably innate in every human being based on our sense of justice and human dignity. But if in the past this idea has faced many obstacles, it is still today far from the desirable goal and in many communities healthcare is still a privileged right reserved to a privileged few (Lancet, 2012).
It was in this context, and taking advantage of the arrival of the new millennium, that the Millennium Development Goals were designed. But, while many of them were related with health (such as ending hunger, improving child and maternal care and combating a series of widespread diseases), they were not sufficient to ensure progress in this area. A more practical and cross-sector approach was needed.
To face this issue, which was gaining greater proportions with the world’s population growth and with the rising demand for higher standards in health services, a new concept was designed to meet this challenge: universal health coverage (UHC). Defined in the 58th session of the World Health Assembly in 2005, it promotes “access to key promotive, preventive, curative and rehabilitative health interventions for all at an affordable cost” (Latko et al.; 2011). Therefore, UHC must implicate both healthcare and its financing system, to improve access and reduce the number of people suffering financial catastrophe due to heath care expenditures. In fact, in 2011 it is estimated that more than 60 million people were pushed below the poverty line in India, because of the costs incurred in health services (Lancet, 2012). And apart from those who purchased the service and were pushed below poverty, there are those others who don’t even seek care because of the costs involved. This is why the financing method of the healthcare systems must be improved in most countries, and pool funding systems must be developed so to spread the financial risk across the population and prevent direct payments as the major source of healthcare funding, since it is the major barrier preventing access to services (Evan & Etienne, 2010). Furthermore, healthcare systems should be built around incentives to ensure the best use of funds, and guarantee efficiency and the equitable use of resources (Evan & Etienne, 2010).
7 In order to understand the current state of the situation, and where the overall progress of UHC is, it seemed interesting to develop a dissertation focusing on the progress made in the past years. However, time and resources were limited, so the study had to be narrowed down to a few countries that could provide a reliable picture of the different phases of development of UHC across the globe. Many researchers have published papers on restricted economic areas such as the European Union (EU) or the Organization for Economic Cooperation and Development (OECD), while others prefer to analyze the situation in developing or poorer countries. But since the situation both in developed and under-developed countries is of interest, and to gain a better insight of the evolution of UHC, the choice of countries had to contemplate both cases. So, it ended up being the Comunidade de Países de Língua Portuguesa (CPLP) – Community of Portuguese-Speaking Countries – as it appeared to be a reasonable choice, since besides sharing a common tongue and historical bonds, these countries are from different geographical regions and are at different stages of economic development. The main Research Question is “Assessing how Universal Healthcare Coverage is progressing in the CPLP countries”. In order to do this, an analysis of indicators was made. Collected in the World Bank and the World Health Organization database, the indicators were chosen to represent the current state of the countries health-financing situation, the population evolution and availability of resources. To better understand the path these countries have been going through, the data was collected in a time period of ten years: from 2003 to 2012 (the last year with information available for all countries and for almost all indicators). Having a decade of information would help achieve the key goal to observe what are the main trends happening in these countries and to identify the main contrasts between them. All information will then be discussed to draw out conclusions.
This dissertation is therefore divided in five different chapters, the present one being the introductory. The second chapter presents a literature review, where the concept of Universal Health Coverage and the underlying obstacles and necessities will be further explained. The third chapter will explore the data collected, and will provide insights on the progress of universal coverage among the countries of the CPLP. The results obtained will be discussed in the fourth chapter, where the limitations of this analysis and future needed research will also be highlighted. The fifth and last chapter will conclude this dissertation.
8
Literature Review:
An overview on global health:
According to McKinsey Healthcare, the healthcare industry is now the world’s largest with a value and cost three times greater than the banking sector. The alarming growth of the world’s population, expected to reach 9.6 billion in 2050 (The Economist, 2014), is one of the main factors giving the healthcare industry an increasing significance. The improvement of life conditions coupled with the current average life expectancy of 70 years (WHO, 2012) is forcing several improvements in health provision.
However, there are still marked inequalities across the globe concerning healthcare access: while in some countries almost 100% of births are attended by professional healthcare workers, in other countries this rate is below 10% (WHO, 2010). Similarly, if routine vaccinations were available to all children below the age of 5, 16 million lives would be saved (WHO, 2010).
Despite these disparities, the expenses on healthcare have been growing steadily in the past decade: in 2011 countries spent on average 9.1% of their GDP on health, comparing to 8.2% in 2000 (WHO, 2014). Nevertheless there is still a large gap between the minimum and maximum spent: 1.7% to 17.7% of GDP, in 2011 (WHO, 2014).
Although the situation varies from country to country, health care systems end up evolving under constant pressures and different interests. The challenge is to make the promotion and protection of people’s health compatible with the need to incentivize the economic growth of the community (Sousa 2009; WHO, 2010). In the last decades, health policies have changed course and focus many times, and it appears that these constant political changes are too much to be followed by the system that ends up growing at its own pace (Sousa, 2009).
Against common thinking, health challenges are present not only in under-developed countries. Even though scientific, technological, social and economic evolution of the last decades contributed to solve many health issues, populations from developed countries are confronted today with new and more complex problems related to other health necessities: longer life expectancy and the growing incidence of chronic diseases. Similarly, the inversion of the age pyramid brought new challenges these countries were not prepared to embrace. They are determining new health needs such as continuous personalized care and more varied infrastructures (Sousa, 2009; WHO, 2013).
9 Nevertheless, poverty has an enormous impact on a population’s health outcomes. It prevents not only the access to care, but also affects a number of other important health characteristics such as nutritional adequacy (including the accessibility and quality of drinking water). But other aspects of daily life are also of great importance for the health status of a population: existence, or lack thereof, of appropriate shelter with adequate sanitation, safety of the environment, higher probability of exposure to toxic substances, lack of literacy and schooling which will limit knowledge about healthy behaviors, and the effect of low social status over stress and psychosocial wellbeing (Sachs, 2012).
It was in view of this situation that the concept of universal coverage was established and started to be pursued by many countries and organizations.
What is Universal Coverage?
Universal Coverage (UC), or Universal Health Coverage (UHC) is a concept defining that all people should receive quality health services meeting their needs, without exposing them to financial hardship or poverty in paying for them (WHO, 2013).
Both components of UHC are inter-related and should benefit the entire population: the good quality of essential health services that must be available according to need, and the protection from financial hardship (WHO, 2014).
UHC has to be a dynamic concept, adaptable to each country differently. As quality is improved through new technologies; cures and medical products come at higher costs although they are of better quality. This ambivalence is a struggle even for rich countries where it is hard to maintain the high level of standards previously established, both of service and broad population coverage, and keep low out-of-pocket payments (WHO, 2013).
Universal Coverage also incorporates principles of equality in access, quality and financial protection. It is also a multi-sector issue as it involves both social and financial dimensions as well as health dimensions. It appears logic that achieving UHC would contribute to a healthier workforce and therefore increases in labor and productivity and economic growth. Additionally, Universal Health Coverage improves education outcomes, since healthier children do better at school (Basch, 2010). At the social level UHC guarantees equal access to the same quality and range of health services for everyone (WHO, 2013).
10 Taking this into account, each country or organization working to achieve Universal Coverage must center themselves around three critical dimensions:
Population: who is covered? Does the system include all people who need health services? (WHO, 2013)
Services: which services are covered and at what quality? Which services are going to be the primary focus of UC: non-communicable diseases, or injuries? Shouldn’t the implementation of UC embrace not only treatment but also prevention, promotion, rehabilitation, and palliative services? It is also important to consider that UHC requires access to medicine and some health technologies, motivated health workers in sufficient numbers, health infrastructures covering evenly a given geographical area and information systems allowing informed decision-making both for patients and health professionals (WHO, 2013).
Cost: how much of the cost of an intervention is covered? If the service’s entire cost is an out-of-pocket payment, it will prevent the poor from using the services, and for many treatments even the rich will suffer financially after a long period of disease. So, how to implement pool funds such as taxes or insurance contributions? What actions are necessary in order to spread the financial risk across the population and allow cross subsidy from rich to poor, from healthy to ill, and increase access services and financial protection? (WHO, 2013)
Because these three characteristics are specific to each country, there can’t be universal rules of implementation and validation for Universal Coverage (WHO, 2013). What works for one country does not apply for another, and what might be possible to implement in a richer country is simply an unreachable task in a poorer country.
Although countries are at different stages of development, vary in terms of range and distribution of health services and in the availability of health workers, have different economic and social development and so have different needs for external support; some transversal actions can be pursued by all countries that wish to attain Universal Health Coverage. The first step is to review where they are in terms of UHC and how their health system is currently working. Then they must develop or revise strategies for an appropriate financing: creating a multi-stakeholder process involving all key players (all ministries, sub national governments, private sector, civil society, etc). And finally, they must implement their new policies and strategies, and keep a regular monitoring and evaluation of progress, to revise and strengthen strategies (WHO, 2012).
11 Monitoring progress:
As the search for Universal Coverage spreads across the globe, there is an increase in the demand for expertise evidence and measures of progress to make data comparable between countries and to draw conclusions about the worldwide state of health coverage (WHO, 2014). Furthermore, monitoring progress is a complementary and critical action to achieve desirable health outcome goals such as: ending preventable deaths, promoting healthy life habits, reducing poverty and protecting household incomes (WHO, 2014).
Although it cannot be considered as substitute to other health goals, monitoring UHC should be a primary concern to understand the overall progress in health performance. It is an effort made mainly around two components: level of coverage of health services and level financial protection with focus on equity. It would also require regular assessment of inputs such as: financing, health workforce and medicines; and outputs such as: service provision, coverage of interventions, health impacts and the social determinants of health. Monitoring can be made at two different levels: country level and global level (WHO, 2014).
Country monitoring is very specific and should reflect the country’s unique epidemiological and demographic profile, health system, level of economic development and the population’s demands and expectations. This kind of tracking is important because countries have different focuses: emerging economies might focus on how to expand essential services to remote areas, while high income countries will focus on modifying the range of available health services for their growing elderly population. However, the domains to be monitored are the same (quality of services and financial protection) and are relevant to all countries (WHO, 2014).
Global monitoring is valuable for standardizing measures so that they are comparable across borders and over time. Furthermore, if countries were to adopt a common monitoring with internationally standardized indicators, it would be much easier to draw periodic comparisons allowing countries to learn from one another. Nevertheless, global monitoring is not a substitute for country monitoring especially because priorities for will differ among countries (WHO, 2014).
As stated before, some principles of monitoring are standard for all countries. For example, measuring progress on both measures (quality of services and financial protection) should be taken simultaneously, and should comprise the full spectrum of essential health interventions: promotion, prevention, treatment, rehabilitation and
12 palliatives; and their associated costs. Similarly, all countries should monitor benefits for their entire population throughout life course, for all ages, genders and sub-groups (healthy as well sick). It is also important to capture all levels of the health system: from widespread interventions (tobacco prevention) to interventions for specific groups (obstetric care). As for financial protection tracking, they should follow all levels of the health system, as costs incurred may vary widely (WHO, 2014).
Additionally, to facilitate the analysis, measures should be disaggregated by socioeconomic and demographic strata in order to allow assessment of the equitable distribution of services and financial protection coverage (WHO, 2014).
Measuring UHC:
Measuring the coverage of essential health care services is more complex. There has to be a large set of indicators classified differently according to the type of intervention, target population, risk factors, and do on. So, indicators are organized into two main broad categories set to cover the spectrum of interventions: prevention (promotion and prevention) and treatment (treatment, rehabilitation, palliation) (WHO, 2014).
Each indicator is chosen according to three factors (WHO, 2014):
Relevance: does it measure a health condition that is a priority? Is the intervention cost effective? Is the service or condition addressed as a potentially major health care expenditure?
Quality: do the indicators represent effective or quality adjusted coverage? Could complementary indicators be used to capture information on the quality of service?
Availability: are the indicators measured regularly, reliably, and comparably with existing instruments?
For preventive care, there are already a number of well-established indicators of interventions promoting health or preventing illness (vaccination rate) and other indicators that monitor interventions to prevent non-communicable diseases (non-use of tobacco) (WHO, 2014).
On the other hand, treatment indicators are relatively few, reflecting the difficulty in determining what are the needs and conditions affecting only a fraction of the population, which often require facility based care (surgery). Even in high income countries, where there is extensive data, there are few indicators in use: illnesses that
13 require long term hospitalization and treatment are often associated with higher financial risks, and are the ones peoples avoid the most. For some conditions like diabetes, where clinical tests are used, household surveys could help determine the size of the population in need and also the number treated and serve as future indicators (WHO, 2014).
Keeping in mind that UHC is a commitment to equity, there are still risks that poorer segments of the population could be left behind. So it’s critical to have measures disaggregated by a range of socioeconomic and demographic “stratifiers”: household income, expenditure or wealth, place of residence and gender. To measure the coverage of financial protection two common indicators are used: incidence of “catastrophic” health expenditures - number of households that incur payments higher than their resources - and the incidence of impoverishment due to out of pocket payments – degree to which health spending causes extreme hardship by pushing families below the poverty line(WHO, 2014).
However, the impoverishment indicator does not measure the number of families that are pushed even further into poverty, which have to be captured by adding the number of non-poor families impoverished by health expenditures to the number of already poor families who incur out-of-pocket payments. The total is the number of households that are pushed into poverty or deeper into poverty. (WHO, 2014).
Targets for assessing country progress towards UHC should also have a specific time bound limit. This means identifying from the available data sufficiently ambitious, yet achievable, improvements in equitable coverage of essential health services and financial protection. The ultimate goal is 100% coverage, but it’s practical to set targets based on empirical baseline data and past trends in the whole population and among the poorest, taking into account issues in measuring need and effective coverage. Different targets will be set accordingly: for vaccination higher targets are achievable, for other conditions such as hypertension or HIV it’s not accurate to set 100% targets, so a given country should set at least 80% coverage of essential health services. For financial protection, a target that is both ambitious and achievable gives 100% protection from catastrophic hardship and impoverishment health payments (WHO, 2014).
14 Together, these measures can provide a snapshot of a given health system performance with respect to coverage of some essential health services and financial protection, for the population as a whole and for critical equity groups. Using the targets and indicators, countries can identify their coverage gaps and determine how far and fast they should improve the performance of their health systems to achieve progress towards UHC. This common framework for monitoring UHC is designed to facilitate comparison of progress among countries (WHO, 2014).
Naturally, each country is expected to contribute with further measurements of service coverage and further equity stratifying measures in order to adapt UHC monitoring to its own context. However, it is important to remind that UHC monitoring is not a substitute for other measures of performance (e.g. health worker density and distribution). Instead, it should be seen as a major part of a monitoring framework in which inputs and outputs are linked to health outcomes.
The indicators make a valuable contribution to assess a health system’s performance and achievement of desired health outcomes, though further investment is required to develop new evaluating methods and indicators. Furthermore, betting in strategies like data collection - through household surveys with standardized questions and from facilities on services provided - to assess coverage of services and financial protection is an important asset to have that also brings good value for money (WHO, 2014).
Obstacles to UHC:
Obstacles to UHC rise in many different sectors. From technological to leadership problems the absence of guidance and of clear instructions can affect the goal of Universal Coverage in countries of all income level (WHO, 2013).
In terms of leadership the main necessity would be for governments to have a clear vision of the entire health system and come up with broader strategies to address both social, health and gender inequalities. The main issues found in any country range from unsuitable control of quality in health facilities to incoherent architecture of the healthcare systems. Nevertheless, other problems such as lack of transparency and poor accounting systems are often great obstacles preventing the establishment of universal coverage measures. Improving this area with regulations and medicine policies are also to be considered in every country (WHO, 2013).
15 Financing has a very strong impact on the quantity and quality of health services available. A healthcare system whose financing is based on out-of-pocket payments is not only preventing people from seeking care but also provoking financial hardship in a large slice of the population (Evans & Etienne, 2010). However, it is also important to highlight other measures contributing to a system’s inefficiency and inequalities. One of these is the payment and working conditions of health care workers which can be a perverse incentive contributing to an unclear accountability. Reviewing other money applications could also be of assistance in using better a country’s health budget: allocating resources to low-cost interventions with higher impact (primary level preventive care) instead of privileging high-cost and low-value investments (such as hospital funding) (WHO, 2013).
The quality and adequacy of health services as well as the management of human resources are also an important obstacle to universal health coverage. In many countries the shortage and irregularity of supplies affects treatments, and often the continuity of treatment is disregarded because of limited resources (Evans & Etienne, 2010). Similarly the quantity of health caregivers has to be appropriate in order to have a functioning system assuring coverage to all in need. However, what is usually found is a lack of available professionals in rural areas, and the existing ones are often inadequately trained with their skills lacking updating, suffering also from low motivation due to poor working conditions (WHO, 2013). Finally, there is need for better health infrastructures: renovating buildings and improving the even geographic distribution of health centers are actions all countries need to take (WHO, 2013).
The increasing need of having valid evidence and information to give better care is another important obstruction rising in every country. Preventive actions could be taken at national level if data from the population was correctly aggregated and managed. On another level, the lack of sufficient resources such as technology and medicines makes several treatments and interventions unaffordable for the poorest (WHO, 2013).
Initiatives and choice of interventions
External support should be given and available to all countries who which to seek guidance in their path to UHC. The range of help given should go from assistance in assessing the current heath financing system: understanding how it is operating and what are the available options that could accelerate implementation of changes enabling
16 universal coverage (WHO, 2012). It is also important to understand what are the desirable changes and the ones politically and economically feasible. Obviously there are different interests at play; therefore dialogue must be privileged across all relevant partners so the best synergies between the health planning process and health financing strategies can be found (WHO, 2012).
Supporting and encouraging continuous monitoring and feedback is fundamental, but innovation and learn-by-doing approaches should also be at the center of external support. Each country has to have an autonomous evaluation, monitoring and innovation system. In this way, countries can benefit from other’s experiences and different areas of the health care system can be improved. It is also a valuable strategy to understand the financial options available, and see in what ways more money can be raised, how to reduce risk, improve transparency and accountability to have more efficiency and reduce inequalities (WHO, 2012).
Organizations like WHO or existing partnerships like the European Union can also play an important role in giving support global or regional level respectively. They can be useful platforms for exchanging information and obtaining advice or help (Lancet, 2012; WHO, 2012).
This would make the process of achieving universal coverage easier for any country who wishes to start moving in that direction. Guidelines would be prepared and would lead the analysis needed. Experience sharing would be much easier across countries of different income-level countries in different regions, as well as getting in touch with innovative methods (Lancet 2012; WHO, 2012).
This kind of sharing is a great tool for countries needing support in doing a financial analysis, tracking expenses or reorganizing their resources. Innovative ideas and dialogue across professional would be available as well as across relevant political institutions (WHO, 2012).
UHC planning
Planning coverage must be a task performed at country level. Elaborating a plan assessing which diseases causes more burdens on the population is a very specific issue to each nation. Therefore, establishing options to deliver care and prioritize interventions is something particular to each country’s situation. This kind of planning
17 will allow a better overview of the population’s needs and will highlight inequalities so they can be tackled (Victora et al., 2004).
A consideration about the levels of coverage a country is able to offer is also important. Several interventions might achieve medium coverage, but few are the ones who actually have high coverage. In order to choose effectively the set of interventions the benefits and the scale at which they can be performed must be considered. Furthermore, attention has to be given to the duality of pursuing short-term universal coverage and the long-term goal of strengthening the health system (Victora et al., 2004).
Unfortunately, the time-frames of governments and donor organizations are rarely longer than five years. And when in charge, they usually prioritize short-term high impact coverage actions rather than preferring a long-term approach benefitting the quality of planning, implementation and integration of efforts. Learning from the past is crucial and the constant governmental and staff turnover do not contribute to keep track of institutional memory (Victora et al., 2004).
Strategies to overcome inequalities:
Health care systems should be regarded as key players in diminishing inequalities, because there are many linkages of poverty with poor health. Of course, other elements such as the lack of proper housing, safe drinking-water and sanitation are not directly related to the health system but are also greatly responsible for poor health conditions (Sachs, 2012; WHO, 2013). Still, the health sector is particularly important because a large portion of the diseases burdening poor households result from a limited category of diseases. They are known as group I diseases integrated by communicable diseases and nutritional deficiencies. They should be the main focus of universal coverage interventions because there are powerful low-cost measures that can be taken to prevent, treat, or cure the disease. Consequently, much of these diseases could be tamed at fairly low-cost, relieving poorer households of this burden (Sachs, 2012).
In 2012, Sachs proposed a minimum basic package of health needs, probably costing around US$50–60 per person, prioritizing effective low-cost interventions. It would cover with high effectiveness mostly group I diseases - diarrhea, pneumonia, vaccinations, malaria control, malnutrition, perinatal deaths, and maternal deaths (related to pregnancy and childbirth) - but also in some of group II (non-communicable) and group III (trauma).
18 Still, this proposition brings out two main concerns: health financing and the organization of health-care delivery. In fact, in low-income countries many families lack cash at many points of the year, so ending service fees might be the only solution to allow all citizens access to healthcare (Sachs, 2012). Even the smallest of sums, usually put in place to prevent wasteful use of resources, can block the poorest from accessing the most basic forms of health care.
To fight against these inequalities, there are many economies of scale and scope available to ensure a broader coverage of health interventions. It was already used to fight Malaria, when distribution of free bed-nets started and the number of deaths fell dramatically (Sachs, 2012).
In these lowest-resourced countries, the greatest need is to strengthen the public sector. Usually, these countries have very large out-of-pocket sums, forcing those who can afford care to go to private institutions and leaving the poor out of even the most basic treatments (Sachs, 2012).
However, simply pouring money into the public health care system is not enough. There is need for appropriate and sustainable measures, using resources efficiently and adequately. Roughly 5% of expenses in healthcare could be saved if there was less inappropriate use of medicine and equipment (Lancet, 2012; WHO, 2013), and similarly, it is known that 20 to 40% of all resources are wasted because of inefficiencies of the systems: length of hospital stay, patients wrongly admitted, medical mistakes, corruption and fraud are some of the common causes of this waste (Lancet, 2012; WHO, 2013). Measures of critical assessment, using technologies properly, and motivating health workers, improving hospital performance especially in accountability and transparency issues are some of the actions a country can implement to pursue UHC (WHO, 2013).
Another important strategy lies in raising awareness about inequalities in wealth, education, income, and other important factors determining who accesses the services, since they are also obstacles to UHC. Partnerships between ministries (health, education, financing) to overcome these barriers are a possible complementary strategy (WHO, 2013).
Investing in research is essential, because no development will be achieved without it. But, it is a difficult area for research, because problem formulation is difficult and evaluative studies are scare, and some approaches are often not applicable. Still, as the
19 literature grows in this area, new opportunities to refine and develop rigorous methods arise (Bravata et al., 2005).
Health care systems functions:
Providing health is defined by any set of activities whose primary intent is to improve or maintain health (Murray et al., 2000). The healthcare system is responsible for making the resources and workers available but is also in charge of financing, regulating and providing care (Murray et al., 2000).
As mentioned before, health systems can largely influence macroeconomic production. Therefore, some methods of financing such as employment-based insurance may delay a country’s economic performance (Murray et al., 2000; WHO, 2013).
There are three main goals for a health system: health, responsiveness and fairness in financial contribution:
Health: the central goal, which is to improve the health of the population. The loss of this objective would lead people to choose not to have them. The system must worry with the average level of population health and with health distribution inequalities within the population (Murray et al., 2000).
Responsiveness: enhancing the responsiveness of the health system, to legitimate expectations of the population. Not only in actions of respect (for the dignity, autonomy and confidentiality of the patient), reflecting the interaction of the population with the system, but also in dimensions reflecting the patient as a consumer deserving satisfaction (having the possibility to choose which institution and which doctor to have) (Murray et al., 2000).
Fairness in financial contribution: financial risk pooling is a very important measure to prevent that no family becomes become impoverished, or pay an excessive share of their income in obtaining needed health care. Therefore, those who have less should pay less (Murray et al., 2000).
The concept of efficiency and performance, in economics, is defined by producing a given output at the lowest possible cost, or to attain the maximum producing quantity with a fixed budget. Therefore, measuring the performance of the health system is very hard to measure, because it’s relative to so many different factors. It is also difficult to compare countries among each other, since they have very different circumstances and
20 have different resources available. Performance should also be evaluated in a longer time frame, and regarding all three goals of the system (Murray et al., 2000).
21
Analysis:
Methodology:
This research in the dissertation was developed with quantitative measures. The goal was to search and analyze the development of Universal Health Coverage in the CPLP countries, and for this purpose, a set of indicators was chosen. Collected in the World Bank and in the World Health Organization websites, the indicators were categorized into three main groups who would help understand the current state of health expenditures, population evolution and resource analysis for these countries.
Choice of countries and overview of each system:
The CPLP (Comunidade de Países de Língua Portuguesa) is a community for Portuguese speaking countries. After some years of designing the project, it was finally founded in 1996 with the goal of joining together the countries who shared not only a language but also an historical heritage and a common view in democratic and development values (CPLP, 2015).
This organization takes action mainly in priority sectors such as Education, Healthcare and the Environment; mobilizing internal and external help and resources, creating new and maintaining current mechanisms. More and more the resources available come from Governments but also from other large organizations such as the United Nations and the World Health Organization (CPLP, 2015).
The current nine members are Angola, Brazil, Cape Verde, Guinea-Bissau, Guinea- Equatorial, Mozambique, Portugal, Sao Tome and Principe and Timor-Leste.
To analyze Universal Healthcare Coverage in the CPLP countries would give a varied overview on how UHC is developing worldwide. This group of countries represents a geographical variety of realities, but also an economical and social diversity, which will bring a pretty accurate picture of the different problems UC faces around the world. Therefore, the needs of one of the poorer countries compared to another will not be limited to economic necessities, but also to other geographic and climatic constraints. The analysis was made in eight of the nine members, because of the very recent adhesion of Guinea-Equatorial (2013) who just yet started to benefit from the Community.
22 Angola
Angola is classified as an upper-middle income country of the African region and although the country has been registering enormous growth in the past years, many inequalities are still to be resolved. Their GDP per capita is slightly below other African countries of the same class, and so is their life expectancy and maternal mortality rate (WHO, 2012). Furthermore, Angola also still has a large percentage of its population with no access to sanitation and clear water sources (WHO, 2012).
Table 1- Angola Key Facts
Key facts (2012)
Population 20.820.525
GDP (in $US) GDP per capita (in $US)
115 billion 5,482 Spent in Healthcare:
% of GDP In $US Per capita (in $US)
3,474 4 billion
190
Life expectancy 52
Maternal mortality rate (per 100,000 live births)
610 Number of under 5 deaths (per 100,000
live births)
172,6 % of population with access to:
Improved sanitation facilities Water source
60,13 54,28
Sources: World Bank, WHO
Funding of healthcare in Angola happens essentially through domestic funding, with external resources representing only 2% of the total. However, only 3.5% of the GDP is allocated to healthcare. Additionally, when purchasing a health service, 27% of its cost is paid through out-of-pocket expenditures, meaning that individuals must have a large amount of cash available to access healthcare (WHO, 2012)
23 Figure 1- Angola's sources of funding
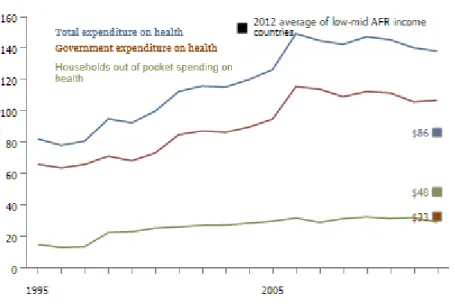
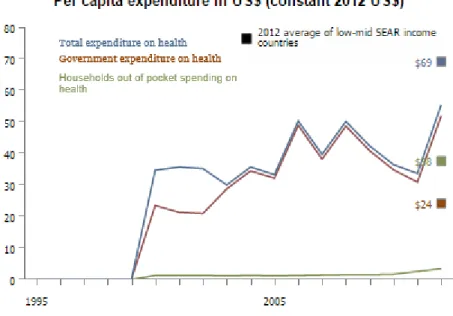
Sources: World Bank, WHO Comparisons with the other countries of the same category demonstrate how meager Angola’s investments in healthcare are. Government expenditure is far below the average of $247 per capita of other upper-middle income countries of Africa. Household spending per capita are below the average as well, meaning that the families resources are often allocated to other goods than healthcare (WHO, 2012).
Figure 2- Angola's per capita expenditure
Sources: World Bank, WHO
Brazil
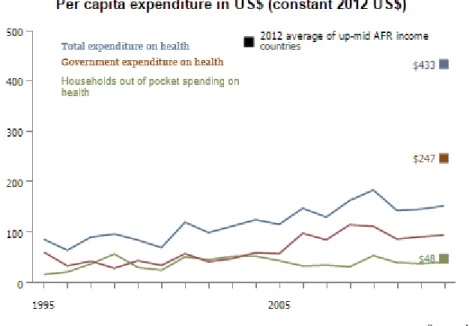
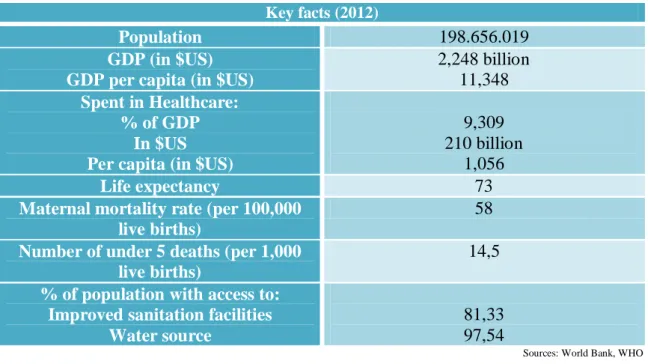
Brazil is considered an upper-middle income country of the American Region. Albeit having a higher GDP per capita than the average countries of the category and a lower maternal mortality rate, Brazil still has a lower life expectancy than others and a hig h rate of under-five deaths. On the other hand, it matter to point out the large coverage of the population’s access to water and sanitation facilities (WHO, 2012)
24 Table 2- Brazil Key Facts
Key facts (2012)
Population 198.656.019
GDP (in $US) GDP per capita (in $US)
2,248 billion 11,348 Spent in Healthcare:
% of GDP In $US Per capita (in $US)
9,309 210 billion
1,056
Life expectancy 73
Maternal mortality rate (per 100,000 live births)
58 Number of under 5 deaths (per 1,000
live births)
14,5 % of population with access to:
Improved sanitation facilities Water source
81,33 97,54
Sources: World Bank, WHO
Figure 3- Brazil's sources of funding
Sources: World Bank, WHO
Brazil funds 100% of its healthcare, but still forces the population to incur a large percentage (31%) of out-of-pockets payments, creating therefore a barrier for those with less money.
But a constant progress in this sector is being made, and the trend seems to be to keep increasing expenses in healthcare. Brazilians households’ expenses on health services have been growing and are higher than other upper-middle income American countries. The same goes for government expenditure per capita, which has been steadily increasing for the past decades (WHO, 2012)
25 Figure 4- Brazil's per capita expenditure
Sources: World Bank, WHO
Cape Verde
Cape Verde stands in the low-middle income group of African countries. With a small amount of the GDP spent in healthcare, the country still presents and impressively low maternal mortality rate and under-five deaths. As for water and sanitation facilities access, although the current number are not shocking there is still progress to be achieved (WHO, 2012)
Table 3- Cape Verde Key Facts
Key facts (2012)
Population 494.401
GDP (in $US) GDP per capita (in $US)
1 billion 3,700 Spent in Healthcare:
% of GDP In $US Per capita (in $US)
3,896 71 million
144
Life expectancy 71
Maternal mortality rate (per 100,000 live births)
94 Number of under 5 deaths (per 1,000
live births)
26,7 % of population with access to:
Improved sanitation facilities Water source
64,94 89,29
26 Figure 5- Cape Verde's sources of funding
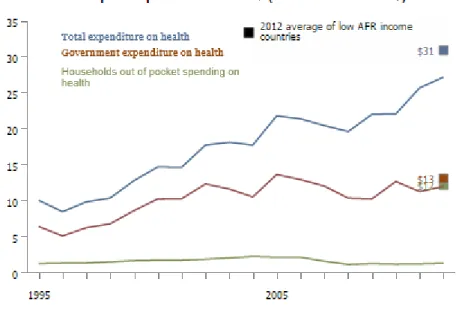
Sources: World Bank, WHO Provenience of funding is largely domestic, but a good slice (28%) of financial support is still depending on foreign contributions. Stressing that out-of-pocket expenditures only account for 22% of the costs is essential, as it is one of the lowest rates of all CPLP countries.
Like other countries, the tendency for the past years is for the amount invested in health care to grow. In this case, only households spending per capita are below the average even if an increase is being registered (WHO, 2012)
Figure 6- Cape Verde's per capita expenditures
Sources: World Bank, WHO
Guinea-Bissau
Guinea-Bissau is among the low-income countries of Africa. With a large population and a low GDP, the country only spends $30 dollars per capita in healthcare. Additionally, the life expectancy is very low, and few have access to sanitation facilities.
27 Table 4- Guinea-Bissau Key Facts
Key facts (2012)
Population 1.663.558
GDP (in $US) GDP per capita (in $US)
0.96 billion 507 Spent in Healthcare:
% of GDP In $US Per capita (in $US)
5,865 50 million
30
Life expectancy 49
Maternal mortality rate (per 100,000 live births)
1000 Number of under 5 deaths (per 1,000
live births)
127,9 % of population with access to:
Improved sanitation facilities Water source
19,67 73,64
Sources: World Bank, WHO
Extensive funding comes from outside the country, and the state’s participation in health costs id very low: 23%, limiting the population access to health services. 43% of costs have to be paid by households, and in a country with a low GDP per capita is creates an obstacle to extensive population coverage.
Figure 7- Guinea-Bissau's sources of funding
Sources: World Bank, WHO
Contrary to most of the other CPLP countries, the expenses in the health sector have been going up and down. Although Guinea-Bissau is not far from the average of other low income countries in Africa, there has been a recent decrease resulting especially in very low expenses of households in health.
28 Figure 8- Guinea-Bissau's per capita expenditures
Sources: World Bank, WHO
Mozambique
Mozambique is a low income African country, and faces similar issues as Guinea-Bissau. Not only a very low amount is spent per capita in health services, but the population has also very scarce access to clean water and sanitation facilities. Furthermore, under-five deaths are very high, as well as maternal mortality, and life expectancy is also extremely low.
Table 5- Mozambique Key Facts
Key facts (2012)
Population 25.203.395
GDP (in $US) GDP per capita (in $US)
14 billion 579 Spent in Healthcare:
% of GDP In $US Per capita (in $US)
6,423 937 million
37
Life expectancy 49
Maternal mortality rate (per 100,000 live births)
550 Number of under 5 deaths (per 1,000
live births)
90,6 % of population with access to:
Improved sanitation facilities Water source
21,01 49,24
29 As such, financial is given essentially from external sources, and probably these foreign entities also cover the 51% of healthcare costs. Therefore, the Mozambican population faces only 5% of out-of-pocket expenditures, less than Cape Verde (however Cape Verde relies majorly on domestic funding).
Figure 9- Mozambique's sources of funding
Sources: World Bank, WHO
Even if the situation can be compared in several indicators with Guinea-Bissau, the investing trend is more promising, with two out of three curves showing growing tendencies. Household expenses in health are contrary to the other variables. To explain this, we can hypothesize that apart from having to allocate resources to other essential goods; the reliance in traditional methods is still very strong in Mozambique and can be an explanation for this low rate.
Figure 10- Mozambique's per capita expenditures
30 Portugal
Portugal is a high income European country, but despite the stable situation in several indicators, other areas of the healthcare sector have been suffering with the recent financial crisis. However, the high rates of access to basic sanitation and clean water is to be highlighted, as well as the very low maternal mortality and under-five death rates. Table 6- Portugal Key Facts
Key facts (2012)
Population 10.514.844
GDP (in $US) GDP per capita (in $US)
218 billion 20,160 Spent in Healthcare:
% of GDP In $US Per capita (in $US)
9,448 20 billion
1,095
Life expectancy 79
Maternal mortality rate (per 100,000 live births)
7 Number of under 5 deaths (per 1,000
live births)
3,8 % of population with access to:
Improved sanitation facilities Water source
100 99,84
Sources: World Bank, WHO
Figure 11- Portugal's sources of funding
Sources: World Bank, WHO
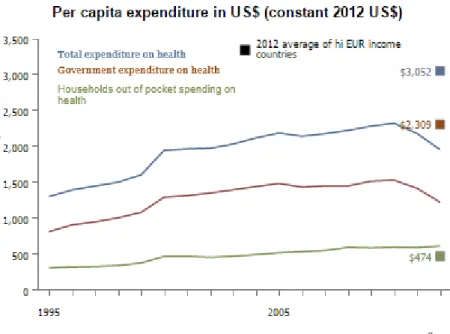
Funding happens exclusively from domestic resources, but the population still has to incur 32% of out-of-pocket costs for health services. As opposed to other CPLP countries the growth in healthcare expenditure has been increasing slowly, actually registering a decrease after the 2008 financial crisis. When compared to the average of other high income European countries, Portugal stands below in government expenditure, and slightly above in household spending.
31 Figure 12- Portugal's per cpaita expenditures
Sources: World Bank, WHO
Sao Tome and Principe
Sao Tome is a low-middle income African country, and already the difference is noted in its health situation. By spending $109 per capita, Sao Tome is able to have a better life expectancy than other CPLP countries and ensure 97% of its population a clean water source. However, efforts have to be made to provide widely sanitation facilities. Its small population might be an explanation for null maternal mortality and under-five death rates.
Table 7- Sao Tome and Principe Key Facts
Key facts (2012)
Population 188.098
GDP (in $US) GDP per capita (in $US)
0.26 billion 1,386 Spent in Healthcare:
% of GDP In $US Per capita (in $US)
7,879 21 million
109
Life expectancy 68
Maternal mortality rate (per 100,000 live births)
0 Number of under 5 deaths (per 1,000
live births)
52,8 % of population with access to:
Improved sanitation facilities Water source
34,41 97
32 Sources: World Bank, WHO
Despite its better situation, Sao Tome and Principe still relies heavily on external funding, and its population pays the largest out-of-pocket payments from all CPLP countries. More than half of the cost has to be spent by households, with the government paying only 32% of the expense.
Figure 13- Sao Tome and Principe's sources of funding
Sources: World Bank, WHO
There have been several peaks in the per capita expense of Sao Tome, but mainly 2003 and 2008 total expenses per capita plummeted, are slowly recovering. It is also to be noted that from 2005 on household expenses surpass government expense per capita. Nevertheless, Sao Tome lies above the average of the other countries of the same category.
Figure 14- Sao Tome and Principe's per capita expenditures
33 Timor-Leste
Timor-Leste is a low-middle income of the South East Asian Region. Being a recent country, Timor still has to work on several issues such as assuring clean water and access to sanitation facilities to its whole population. Maternal and under-five mortality are pretty high, and measures must be taken to reduce them.
Table 8- Timor-Leste Key Facts
Key facts (2012)
Population 1.210.233
GDP (in $US) GDP per capita (in $US)
1,27 billion 1,160 Spent in Healthcare:
% of GDP In $US Per capita (in $US)
4,289 76 million
68
Life expectancy 67
Maternal mortality rate (per 100,000 live births)
370 Number of under 5 deaths (per 1,000
live births)
56,8 % of population with access to:
Improved sanitation facilities Water source
38,93 70,49
Sources: World Bank, WHO
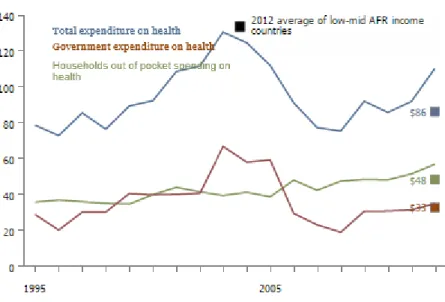
Timor-Leste’s healthcare rests mainly in foreign financial support, but the government assures 94% of the cost of any health service. Households only face 6% of out-of-pocket payments.
Figure 15- Timor-Leste's sources of funding
Sources: World Bank, WHO Household’s per capita expenditure has been rising very slowly and are far below the average; while the government’s disbursements, rising faster but not steadily, still lie above the average.
34 Figure 16- Timor-Leste per capita expenditures
Sources: World Bank, WHO
Data comparison: trends and evolutions, major disparities
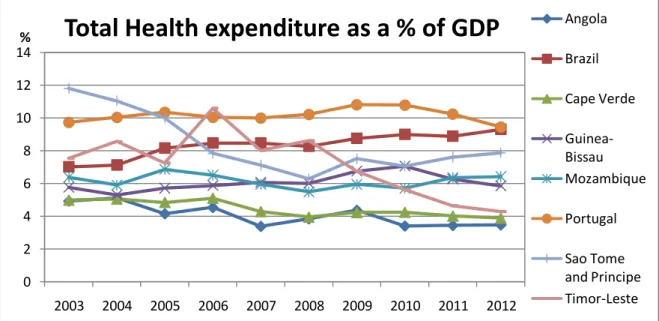
Although it might not reflect the situation in 2015, for purposes of comparison, all data analyzed relates to 2012 since is the latest year with cross-sector information given for all countries. In that year, the situation still appeared very unequal across the CPLP members: Portugal with a GDP of $218 billion spends 9.5% of it in healthcare assigning $1095 per capita, while Brazil with a $2248 billion GDP allocates 9.31% to health services and spends $1056 per capita. In fact, the total expenditure in Healthcare, as a percentage of GDP, is dispersed from 3% to 9.5%. Additionally the weight of private expenditure is very different from country to country; the extremes are Cape Verde with 22% and Guinea-Bissau with 77% (WHO, 2012; World Bank, 2012).
As for other more specific indicators such as Life Expectancy the eight countries are widely spread over more than 30 years. A Mozambican can expect to live 49.8 years on average while a Portuguese expects 80.3 years of life. In Portugal 100% of the population has access to sanitation facilities and drinkable water sources while in Mozambique only 21% have access to sanitation facilities and 49% to water sources (WHO, 2012; World Bank, 2012).
Conscious of these inequalities, the purpose is to understand what underlying factors are causing such disparities among countries. Although several reasons can be thought of – natural catastrophes, political instability, etc… - the main focus will be to look into several health or health related indicators and financing information of the eight
35 different healthcare systems, in order to compare them and look for their central issues. However, other reasons might be taken into account to explain the data.
Also, in order to understand the conditions and the real situation of each country it is not possible to make a static analysis of only one year 2012. Therefore all indicators will be analyzed in the recent years, to show a more truthful view of the progression and development of these nations.
Health expenditures:
As % of GDP:
The % of GDP invested in Health shows the weight health expenses have as a part of the country’s Gross Domestic Product. Total expenditure in health incorporates both public and private expenses and includes a number of health services such as: prevention and treatment, emergencies, family planning and nutrition activities; but excludes water and sanitation provision (World Bank, 2012). Although all countries spend less than 10% of their GDP in health, Angola, Cape Verde and Timor redirect less than 5% of their national budget to Healthcare.
Table 9- Total Health expenditure as a % of GDP
Sources: graphic drawn based on information from the World Bank and WHO
Per capita:
The expenditure per capita is one of the indicators where the most remarkable differences are. Although all countries appear to have increased their expenditure in
0 2 4 6 8 10 12 14 2003 2004 2005 2006 2007 2008 2009 2010 2011 2012
%
Total Health expenditure as a % of GDP
Angola Brazil Cape Verde Guinea-Bissau Mozambique Portugal Sao Tome and Principe Timor-Leste
36 healthcare per capita in the past years, the disparity in amounts invested is striking. There is a large gap between the countries spending more than $1000K – Brazil and Portugal – and all the others situated below the line of $200K of expenses per capita (World Bank, 2012).
Table 10- Health expenditure per capita
Sources: graphic drawn based on information from the World Bank and WHO
This second table shows with more detail the evolution in the expenditure per capita for the six countries with lower investment. Again, the expenditure tends to increase in every country; however, there are still three countries with health expenditure equal or below $50K: Guinea-Bissau with $30K, Mozambique with $37K and Timor with $50K; which, as seen previously, are countries that have more than 50% of foreign funding for health services. 0 500 1000 1500 2000 2500 2003 2004 2005 2006 2007 2008 2009 2010 2011 2012 in K $ U S
Health expenditure per capita
AngolaBrazil Cape Verde Guinea-Bissau Mozambique Portugal Sao Tome and Principe Timor-Leste
37 Table 11- Health expenditure per capita: detail
Sources: graphic drawn based on information from the World Bank and WHO
Out-of-pocket expenditures:
Out-of-pocket expenditure (OOP) is what a person has to pay to receive treatment apart from the amount that is covered by insurance and tax. So, a high percentage of out- of-pocket expenditure means that apart from insurance and tax payments, one still has to have liquidity to benefit from healthcare. Having 51.5% of OOP expenditure like Sao Tome and Principe is very demanding for the population, restricting a large part of accessing the System and having their needs taken care of (World Bank, 2012).
Table 12-Out-of-pocket expenditures
Sources: graphic drawn based on information from the World Bank and WHO
0 20 40 60 80 100 120 140 160 180 200 2003 2004 2005 2006 2007 2008 2009 2010 2011 2012 in K $U S
Health expenditure per capita
Angola Cape Verde Guinea-Bissau Mozambique Sao Tome and Principe Timor-Leste 0 10 20 30 40 50 60 70 2003 2004 2005 2006 2007 2008 2009 2010 2011 2012 %
Out-of-pocket Health Expenditure as a % of
total expenditure on health
AngolaBrazil Cabo Verde Guinea-Bissau Mozambique Portugal Sao Tome and Principe Timor-Leste
38
Private expenditure:
Private healthcare expenditure gives us an idea of how the majority of the population is covered, and in which sector efforts are being made to provide better healthcare. Guinea-Bissau leads with 77% of private expenditure, suggesting little government implication in the Healthcare area, but in a country where funding from abroad represents 66% of Healthcare, it would be expected to have a private health sector with an important representation.
Table 13- Private health expenditure
Sources: graphic drawn based on information from the World Bank and WHO
Population:
The dimension of a country’s population can be determinant to the capacity of achieving sufficient health coverage. In the past decade, the CPLP population registered growth, but coming especially from the countries who are in developing stage. Angola’s population grew in 5 million -35%- representing the largest growth in all countries, and Timor-Leste passed the one million people barrier, increasing its population in 30%. Sao Tome and Principe, Mozambique and Guinea-Bissau saw their populations growing in 28%, 27% and 22% respectively, which in Mozambique and Guinea is possibly due to the beginning of the stabilizing situation after years of political instability. Nonetheless, Brazilian, Cape Verdean and Portuguese population registered very small growth comparing to the other countries, with 9%, 6% and 1% increase in population since 2003. 0 10 20 30 40 50 60 70 80 90 2003 2004 2005 2006 2007 2008 2009 2010 2011 2012 %
Private Health Expenditure
(% of total health expenditure) Angola Brazil Cape Verde Guinea-Bissau Mozambique Portugal Sao Tome and Principe Timor-Leste39 Table 14- CPLP Population
Sources: graphic drawn based on information from the World Bank and WHO
Life expectancy:
Life expectancy is a growing indicator in all countries. While some face the ageing of the population and the inversion of the age pyramid– which will require a new set of health needs and the emergence of new diseases – other countries are facing population boost as an indicator of better, or improving, life conditions that eliminate more and more the possibility of premature death.
Table 15- Life expectancy
Sources: graphic drawn based on information from the World Bank and WHO
15 .4 21 .0 75 18 1. 75 2. 95 1 46 6. 93 9 1. 36 0. 55 9 19 .8 73 .4 60 10 .4 58 .8 21 14 7. 45 5 93 3. 36 9 20 .8 20 .5 25 198. 65 6. 01 9 49 4. 40 1 1. 66 3. 55 8 25 .2 03 .3 95 10 .5 14 .8 44 18 8. 09 8 1. 21 0. 23 3 0 50.000.000 100.000.000 150.000.000 200.000.000
CPLP population in 2012
2003 2012 40 45 50 55 60 65 70 75 80 85 2003 2004 2005 2006 2007 2008 2009 2010 2011 2012Years
Life expectancy at birth, years
Angola Brazil Cabo Verde Guinea-Bissau Mozambique Portugal Sao Tome and Principe Timor-Leste
40
Under-five deaths:
Witnessing a declining trend in the number of deaths in little infancy shows how far living conditions are improving. But still, there are major disparities across countries of the CPLP. Three countries are below 30 deaths per 1000 live births, the minimum being in Portugal with 3.8 deaths, and the other five still facing a significant number of deceased children.
Table 16- Under-five deaths
Sources: graphic drawn based on information from the World Bank and WHO
0 50 100 150 200 250 2005 2006 2007 2008 2009 2010 2011 2012 2013
Number of under 5 deaths (per 1000 live
births)
Angola Brazil Cape Verde Guinea-Bissau Mozambique Portugal Sao Tome and Principe Timor-Leste41 Resources:
Physicians:
The number of physicians per 1.000 people is below 1 in 5 countries, and the number of nurses and midwives is below 1 in 3 countries showing how few resources they have available to cater the needs of growing populations.
Table 17- Number of physicians
Data from: Physicians
per 1,000 people
Data from: Physicians
per 1,000 people Angola 2004 0,08 2009 0,166 Brazil 2006 1,694 2010 1,764 Cape Verde 2004 0,49 2010 0,295 Guinea-Bissau 2004 0,12 2010 0,045 Mozambique 2004 0,03 2012 0,04 Portugal 2005 3,44 2010 3,868
Sao Tome and Principe
2004 0,491 2004 0,491
Timor-Leste N/A No data N/A No data
Sources: graphic drawn based on information from the World Bank and WHO
Nurses and midwives:
Table 18- Number of midwives
Data from: Nurses and
Midwives per 1,000 people
Data from: Nurses and
Midwives per 1,000 people Angola 2004 1,35 2009 1,66 Brazil 2003 3,84 2010 6,419 Cape Verde 2004 0,87 2010 0,453 Guinea-Bissau 2004 0,7 2010 0,551 Mozambique 2004 0,32 2012 0,412 Portugal 2005 4,59 2010 5,331
Sao Tome and Principe
2004 1,867 2004 1,867
Timor-Leste 2004 2,189 2011 1,112