i
Uncertainty, generalization, and
neural representation of relevant
variables for decision making
Hugo L. Fernandes
Dissertation presented to obtain the
Ph.D degree in Biology | Computational Biology
Instituto de Tecnologia Química e Biológica | Universidade Nova de Lisboa
Research work coordinated by:
Oeiras,
iii
Apoio Financeiro/Financial Support
Apoio financeiro da FCT e do FSE no âmbito do Quadro Comunitário de Apoio, bolsa de doutoramento n° SFRH/BD/33525/2008.
Financial support for this thesis was provided by FCT and FSE through the Quadro Comunitário de Apoio, doctoral fellowship n° SFRH/BD/33525/2008.
v
List of Publications Included in the Thesis
This thesis is based on the following publications:
Chapter 2:
Fernandes HL, Stevenson IH, Körding KP (2012)
Generalization of stochastic visuomotor rotations. PLoS ONE
Chapter 3:
Fernandes HL, Stevenson IH, Körding KP (under review) The generalization of prior uncertainty during reaching.
Chapter 4:
Acuna DE*, Berniker M*, Fernandes HL*, Körding KP (in preparation) Prior beliefs and decision-making under uncertainty
*contributed equally
Chapter 5:
Fernandes HL, Phillips AN, Stevenson IH, Segraves MA, Körding KP (2013) Saliency and saccade encoding in the frontal eye field during natural scene search. Cerebral Cortex
vii
List of Publications not Included in the Thesis
Cherian A, Fernandes HL, Miller LE (2013)
Primary motor cortical discharge during force field adaptation reflects muscle-like dynamics. Journal of Neurophysiology
Vilares I, Howard JD, Fernandes HL, Gottfried J and Körding K (2012)
Prior and likelihood uncertainty are differentially represented in the human brain. Current Biology
Avraham G, Nisky I, Fernandes HL, Acuna DE, Körding KP, Feldman AG,
Loeb GE, Karniel A (2011)
Towards Perceiving Robots as Humans – Three handshake models face the Turing-like Handshake Test. IEEE Transactions on Haptics
Fernandes HL*, Albert MV*, Körding KP (* contributed equally) (2011)
Measuring generalization of visuomotor perturbations in wrist movements using mobile phones. PLoS ONE
Fernandes HL, Körding KP (2010)
In praise of “false” models and rich data. Journal of Motor Behavior
Stevenson IH, Fernandes HL, Vilares I, Wei K, and Körding KP (2009)
Bayesian integration and non-linear feedback control in a full-body motor task. PLoS Computational Biology
ix
Summary
Decision making is a ubiquitous theme in computational neuroscience. Here we present novel data and modeling approaches that relate to how the brain makes decisions. In the first part of this dissertation we use psychophysics to look into how the brain itself does statistics; in the second part we use statistical analysis tools to investigate the neural representation of relevant variables for decision making.
Innumerous studies have suggested that people take previously accumulated information (prior distribution) as well and new information (the likelihood) into account when making a decision. Here we start by asking where do prior distributions come from; since we are rarely in the exact same situation twice, how is the prior, used in a particular decision, generalized from previous similar experiences? Using a movement experiment we found differences between the generalization of the mean and variance of the prior distribution.
We continue by asking how the brain makes a decision when choosing between two alternatives in a two-alternative-forced-choice (2AFC) task. The 2AFC paradigm is often assumed to measure sensory (likelihood) uncertainty independently of prior uncertainty. Here we test this assumption by looking into the algorithms the brain might use when choosing between the two alternatives in a 2AFC task. Specifically, after combining the prior and likelihood into a posterior distribution, is the decision based on the maximum of the posterior (the MAP hypothesis) or do humans sample from the posterior distribution (the sampling/matching hypothesis)? We show that in investigating this question we simultaneously test whether the 2AFC paradigm can be used to measure sensory uncertainty independently of prior uncertainty. Our experimental results favor the MAP hypothesis and hence the validity of the assumption.
x
Finally, we use probabilistic models to investigate whether neurons in the frontal eye field (FEF) represent bottom-up saliency when monkeys are searching a natural scene. Understanding what the brain represents/does ultimately involves understanding how it represents the kind of stimuli it has evolved to represent. Here we use natural scenes and an objective definition of bottom-up saliency that has been shown to predict saccade choices of both humans and monkeys during free-viewing of natural scenes. We found that although saliency appears to be used in deciding where to look next and predicts neural activity of FEF neurons, its predictive power is explained away if we take into account other saccade related covariates.
This thesis provides important insights into several aspects of decision making. At a higher level it provides data for constraining models of generalization of uncertainty; it tests theories that relate to which kind of decision-making algorithms the brain implements; and finally it looks into neural representation of natural stimuli that are relevant for decision making.
xi
Resumo
A tomada de decisão é um tema omnipresente em neurociência computacional. Aqui apresentamos novas abordagens e resultados relacionados com a forma como o cérebro toma decisões .
Começamos por fazer perguntas relacionadas com o modo como o próprio cérebro faz estatística. Especificamente, perguntamos de onde vêm as probabilidades a priori - as distribuições de probabilidade sobre o que esperamos que aconteça. Uma vez que raramente nos encontramos na mesma exacta situação duas vezes, como é que estas distribuições, utilizadas numa decisão particular, são generalizadas a partir de experiências semelhantes anteriores? Usando uma experiência de movimento encontramos diferenças de abrangência e simetria entre a generalização da média e variância da distribuição de probabilidade a priori.
De seguida perguntamos como é que o cérebro toma uma decisão a partir da distribuição de probabilidade a posteriori quando tem de escolher entre duas alternativas no paradigma two alternative forced choice (2AFC). Usa o máximo da distribuição ou amostra da distribuição? Mostramos que ao investigar esta questão estamos simultaneamente a testar a hipótese comumente usada, mas não testada sobre este paradigma: que pode ser usado para medir a incerteza sensorial independentemente de incerteza das expectativas, i.e. independentemente da incerteza na distribuição a priori.
Finalmente, usamos modelos probabilísticos para investigar as representações de variáveis relevantes para a tomada de decisão. Especificamente, perguntamos se o frontal-eye-field (FEF) de macacos representa a saliência de imagens quando os macacos estão à procura de um objecto em imagens naturais. Mostramos que, embora a saliência pareca ser usada para decidir para onde olhar e prevê a actividade de
xii
neurónios no FEF, o seu poder preditivo desaparece (ou é explicado) se tomarmos em consideração variáveis relacionadas com o movimento dos olhos.
xiii
Contents
Apoio Financeiro/Financial Support ... iii
List of Publications Included in the Thesis ...v
List of Publications not Included in the Thesis ... vii
Summary ... ix
Resumo ... xi
Contents ... xiii
1. General Introduction ... 1
1.1 Bayes theorem, priors, likelihood and posterior ... 1
1.2 Generalization, where priors come from ... 2
1.3 How are decisions made? ... 3
1.4 Two-alternative forced choice paradigm and the just-noticeable difference ... 4
1.5 Deciding where to look next... 5
1.6 Marr’s levels in this dissertation ... 6
2. Generalization of Stochastic Visuomotor Rotations ... 9
2.1 Summary ... 9
2.2 Introduction ... 10
2.3 Results ... 13
2.4 Discussion ... 22
2.5 Materials and Methods ... 26
3. The Generalization of Prior Uncertainty During Reaching ... 33
3.1 Summary ... 33
3.2 Introduction ... 34
3.3 Materials and Methods ... 35
3.4 Results ... 51
xiv
4. Prior Beliefs and Decision-Making Under Uncertainty ... 69
4.1 Summary ... 69
4.2 Introduction ... 70
4.3 Results ... 72
4.4 Discussion ... 87
4.5 Materials and Methods ... 89
4.6 Supplemental Information ... 99
5. Saliency and Saccade Encoding in the Frontal Eye Field During Natural Scene ... 105
5.1 Summary ... 105
5.2 Introduction ... 106
5.3 Materials and Methods ... 110
5.4 Results ... 126
5.5 Discussion ... 142
5.6 Supplemental Information ... 146
6. Final Discussion ... 153
6.1 Generalization and uncertainty ... 153
6.2 Decision-making theories ... 155
6.3 Neural representation of relevant variables ... 157
6.4 Concluding Remarks ... 157
1
1.
General Introduction
Understanding decision making in various contexts is fundamental to understanding human behavior. This thesis presents several studies that examine decision making from many different points of view using a variety of research tools.
In Chapters 2-4, we use human psychophysics, i.e., behavioral experiments designed for the quantitative study of the perceptual system. We use some of these experiments to characterize the generalization of prior expectations/subjective beliefs and to investigate which algorithms the nervous system uses for making a decision. In Chapter 5, we analyze neural recordings to understand the representation of relevant neural variables for eye-movement decision making. The experiments presented here cover a wide range of decisions including motor decisions about where to reach (Chapters 2 and 3), sensory discrimination decisions when confronted with two choices (Chapter 4), and attention-related oculomotor decisions about where to look next (Chapter 5).
1.1
Bayes theorem, priors, likelihood and posterior
Innumerous studies have suggested that, when making a decision, humans take previous accumulated information (their expectations, or the prior distribution) as well as new information (the likelihood) into account (for a review see Vilares and Kording, 2011). Both of these pieces of information have an associated mean and variance (denoted by uncertainty). This perspective/modeling approach/description is called Bayesian and owes its name to the Bayes theorem:
2
p(s|r)p(r) p(r|s)=
p(s)
When we try to infer what is out there in the world, we are interested is in having an accurate measure of what the current reality is given the new information arriving to our senses (p(r|s), the posterior). Bayes theorem tells us how we can obtain it, i.e., how to combine the new piece of sensory information (p(s|r), the likelihood) with our prior expectations over reality (the prior, p(r)).
1.2
Generalization, where priors come from
Where do priors come from? As we are never in the exact same situation twice, it is useful to generalize about subjective beliefs acquired in one situation to be applicable to different but similar situations (Shepard, 1987). In Chapters 2 and 3 we address the question of how priors generalize and, in particular, how prior variance/uncertainty generalizes. Several neural representation theories have been proposed on how the brain might represent/approximate the prior and the likelihood (Deneve, 2008; Fiser et al., 2010a; Hinton and Sejnowski, 1983a; Hoyer and Hyvärinen, 2003; Ma et al., 2006; Ma, 2010; Sahani and Dayan, 2003; Soltani and Wang, 2009; Wu et al., 2003; Zemel et al., 1998). These theories propose diverse, but not always mutually exclusive, ways in which uncertainty could be represented by populations of neurons. Some propose that it is represented in the width of the tuning curves, others in the amplitude of the tuning curves, in the firing rate, in the strength of the synapses, in the timing of the firing, etc. To our knowledge however, none of theories about the neural representation of uncertainty has been extended to incorporate generalization, nor is there data on how the variance of the prior distribution generalizes; generalization studies typically neglect variability.
3 Our aim was thus to characterize how the prior generalizes, and specifically to understand how this generalization depends on uncertainty. Namely, we wanted to understand: 1. how the generalization of the mean of the prior is affected by different degrees of uncertainty; and 2. how the variance/uncertainty of the prior itself generalizes. For that, we used a previously established generalization paradigm (Krakauer et al., 2000), which consists on a visuomotor rotation during a center-out reaching task, and extended it to include uncertainty/variability (Körding and Wolpert, 2004).
We found that manipulating the uncertainty level (the variance) of the prior does not affect how the mean of the prior generalizes (Chapter 2). We find differences in breadth between the generalization of mean and variance (uncertainty) and an unexpected asymmetry in the generalization of uncertainty (Chapter 3). Using a gradient-descent model we find that this asymmetry is consistent with the use of different similarity reference frames between the generalization of mean and variance/uncertainty. The results from Chapter 2 and 3 characterize differences and similarities between the generalization patterns of mean and uncertainty of prior expectations, and constrain future extensions of theories of prior representation to include effects of learning and generalization.
1.3
How are decisions made?
Although we know that Bayesian decisions involve a combination of prior and likelihood information, there exist several mathematical strategies by which an inference/decision could be computed. In Bayesian decision-theory, after arriving to the posterior distribution, the ultimate decision still depends on the cost/reward of each of the possible choices. If everything (prior and likelihood) is assumed to be Gaussian, and under reasonable
4
choices of cost function (e.g. the mean squared error), the ideal choice is to weight the mean of prior and the mean of the likelihood by their relative precisions (the reciprocal of the variances). This choice corresponds to choosing the maximum of the posterior distribution (MAP). Do Humans use this strategy when deciding between two choices?
In Chapter 4 we investigate which strategy humans use when deciding between two possible choices. Specifically we ask whether the final decision is based on the maximum of the posterior distribution (the MAP hypothesis), or do humans instead sample from the posterior distribution (the sampling and matching hypothesis) (Vul et al., 2009; Vulkan, 2000; Wozny et al., 2010). To investigate this we use the two-alternative forced choice paradigm (2AFC), a discrimination task that is one of the most used paradigms in psychophysics.
1.4
Two-alternative forced choice paradigm and the
just-noticeable difference
In a 2AFC task, subjects are presented with two alternatives and forced to choose between them. For example, subjects may be asked to decide which of two tones has a higher pitch. By controlling the discrepancy between these tones (the cues), experimenters can obtain a psychometric curve: the probability of a subject's response given the discrepancy between cues. This curve is often used to quantify the just-noticeable difference (JND), which is related to how different the two cues must be before subjects can tell them apart.
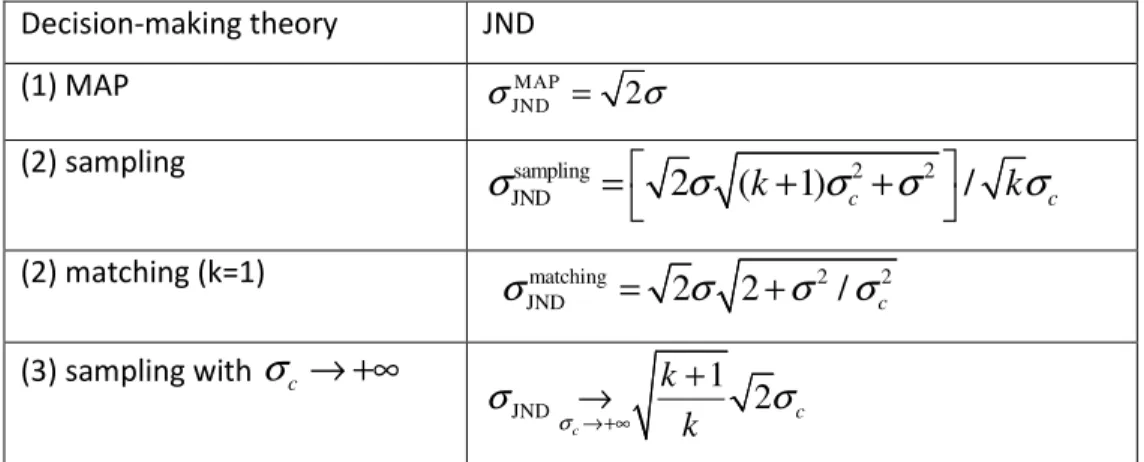
5 The JND is often assumed to measure sensory uncertainty, i.e., uncertainty/variance of the likelihood, independently of the variance of the prior. The MAP decision-making hypothesis described above is the implicit and untested assumption in studies that use JND for measuring likelihood uncertainty -- or at least consistent with that objective. However, as we show in Chapter 4, if the sampling/matching hypotheses are true then the JND is in fact proportional to perceptual uncertainty (i.e. proportional to the variance of the posterior distribution). Importantly this would mean that the JND is affected by changes in prior uncertainty and hence that it should be used with caution. The prevalence of either of these hypotheses has thus broad implications for the interpretability of the 2AFC paradigm.
In Chapter 4 we present a task that allows manipulation of subjects’ prior uncertainty while simultaneously measuring subjects’ JND. Our results suggest that prior uncertainty does not affect the subjects’ JND. Hence our results support the MAP hypothesis and the use of JND to measure sensory uncertainty. Importantly we show how the 2AFC task can be used to test these decision-making theories.
1.5
Deciding where to look next
A big part of our sensory information comes through our retina. When we are scanning a visual scene, we are constantly moving our eyes from one place to the next. In fact, deciding where to look next might be one of our most frequent decisions. How do we accomplish it? In order to understand how we chose where to look next, the computational modeling of eye-fixation choices has found that both bottom-up/task independent image features such as bottom-up saliency (Itti and Koch, 2001), as well as top-down features, such as target similarity (Einhäuser et al., 2008) can predict eye movements to some degree.
6
In the second part of the thesis (Chapter 5) we look into neural representation of one of these important variables for deciding where to look next; bottom-up saliency (Itti and Koch, 2001). We search for neural representation of bottom-up saliency in the frontal-eye-field (FEF) while monkeys are searching natural scenes for an embedded target (Phillips and Segraves, 2010). The FEF is a brain region that is thought to be involved in the production of saccades, while at the same time responding to salient visual stimuli. However, while some experiments using artificial stimuli suggest that saliency is represented in the FEF, understanding what the brain represents/does ultimately involves understanding how it represents the kind of stimuli it has evolved to represent (Kayser et al., 2003; MacEvoy et al., 2008; Theunissen et al., 2000). We use natural scenes and an objective definition of bottom-up saliency that has been shown to predict both human and monkey’s saccade choices. We find that basic analyses suggest that FEF represents both saccade direction and saliency. However, by using Generalized Linear Models (Pillow et al., 2008; Saleh et al., 2010; Truccolo et al., 2005), specifically linear–nonlinear-Poisson cascade models, we show that saccade covariates explain away (Pearl, 1988) bottom-up saliency. Hence, even though saliency appears to be used when deciding where to look next, it does not seem that FEF neurons actively represent it during natural scene search.
1.6
Marr’s levels in this dissertation
To understand and contextualize the contributions of this dissertation in a unified sense, it is useful to group them under Marr’s levels of analysis. David Marr (Marr, 1982) introduced a taxonomy of three different levels of description/analysis. According to Marr, it is possible to divide models into those that deal with the objective of computation (Level 1), the algorithm used (Level 2), and the implementation (Level 3). The Level 1 approaches
7 ask which computational problem the nervous system is trying to solve. Normative approaches, which ask which kind of computation the brain should be solving, are included in the category. A typical example is the question of if the nervous system combines cues from different modalities taking into account their uncertainty to obtain a minimum variance estimate (Kording, 2007). Level 2 models deal with which algorithm or which strategies does the nervous system use to solve the computational objective. Finally level 3 deals with the precise physical implementation of the level 2 algorithms. The implementation can itself be described at many levels: molecular, synapses, spikes, etc. A description at level 1 can have several descriptions at level 2, and an algorithm at level 2 can have several possible implementations at level 3. However a particular implementation should originate one algorithm and a particular algorithm is typically solving one particular computational objective. Research done at a particular level thus constrains the possible descriptions not only at that level but also at the other levels and one could argue that the richer approaches are usually the ones able to connect different levels.
The research presented in this dissertation touches several Marr levels. While Chapter 2 and 3 are mostly experimental, in these chapters we examine the learning and generalization of the prior distribution assuming a normative model of decision making: Bayesian decision theory (Marr level 1). In Chapter 4 we test decision-making algorithms (Marr’s level 2) while also using the normative approach of Bayesian decision theory. Finally in Chapter 5 we use a computational definition of natural scene saliency that is generally used to predict eye movements. Hence, we test a specific algorithm (Marr’s level 2) for how the brain decides where to look next. While it is difficult to say exactly what mechanism/implementation means in Marr’s level 3 — it constitutes many levels of explanation — Chapter 5 investigates whether and how features of a computational algorithm (Marr’s
8
level 2) for deciding where to look next is implemented in a specific population of neurons (Marr’s level 3).
9
2. Generalization of Stochastic Visuomotor Rotations
Hugo L. Fernandes, Ian H. Stevenson and Konrad P. KordingCitation. Fernandes HL, Stevenson IH, Kording KP (2012) Generalization of Stochastic Visuomotor Rotations. PLoS ONE 7(8): e43016. doi:10.1371/journal.pone.0043016
Author Contributions. Conceived and designed the experiments: HLF IHS KPK. Performed the experiments: HLF. Analyzed the data: HLF IHS KPK. Implemented the analysis: HLF with the contribution of IHS and KPK, Contributed reagents/ materials/ analysis tools: HLF IHS KPK. Wrote the paper: HLF IHS KPK
2.1
Summary
Generalization studies examine the influence of perturbations imposed on one movement onto other movements. The strength of generalization is traditionally interpreted as a reflection of the similarity of the underlying neural representations. Uncertainty fundamentally affects both sensory integration and learning and is at the heart of many theories of neural representation. However, little is known about how uncertainty, resulting from variability in the environment, affects generalization curves. Here we extend standard movement generalization experiments to ask how uncertainty affects the generalization of visuomotor rotations. We find that although uncertainty affects how fast subjects learn, the perturbation generalizes independently of uncertainty.
10
2.2
Introduction
A central goal of systems neuroscience in general and motor control research in particular is to understand how sensorimotor behaviors, such as reaching, are represented and learned. One factor that regularly influences movement planning and execution is uncertainty. For example, when we grasp objects our hands move very differently depending on our level of uncertainty; if we are uncertain about an object’s position, we open our hands wider, move more slowly and approach the object with our hands aligned with the direction of highest uncertainty (Christopoulos and Schrater, 2009). This example highlights the fact that variability in the external world affects behavior and suggests that uncertainty must be represented in the nervous system.
Many studies in the field of motor control have used generalization experiments to examine the neural representation of movement, asking how learning a perturbation in one task affects behavior on novel tasks (Donchin et al., 2003; Ghahramani et al., 1996b; Goodbody and Wolpert, 1998a; Hwang et al., 2006; Krakauer et al., 2000a; Mattar and Ostry, 2007; Paz et al., 2003; Pearson et al., 2010; Shadmehr, 2004; Shadmehr and Moussavi, 2000; Shadmehr and Mussa-Ivaldi, 1994; Thoroughman and Shadmehr, 2000; Thoroughman and Taylor, 2005). By studying which aspects of the behavior are transferred between tasks and which tasks a behavior transfers to, these experiments have investigated how we represent and modify movement and task variables. Generalization is sensitive to many factors including the coordinate system, nature, and complexity of the perturbation (Hwang et al., 2006; Krakauer et al., 2000a; Shadmehr and Mussa-Ivaldi, 1994; Thoroughman and Taylor, 2005), movement variables such as speed (Goodbody and Wolpert, 1998) and posture (Shadmehr and Moussavi, 2000), as well as the extent and type of training and feedback (Pearson et al., 2010; Taylor et al., 2012). However, one factor that has not
11 yet been studied in the context of generalization experiments is uncertainty. Many studies have explored how uncertainty affects behavior (Christopoulos and Schrater, 2009; Körding and Wolpert, 2004a; Saijo and Gomi, 2012; Tassinari et al., 2006), but how uncertainty influences generalization has received little attention.
From a normative viewpoint, subjects should generalize what they have learned about a perturbation in one situation to a novel situation only if they expect the perturbation to occur in the novel situation. Behavior in novel situations reveals what subjects expected to occur, and these expectations may be affected by several factors including task similarity or familiarity with the type of perturbation. It has been difficult to formalize this normative approach to generalization, since natural movement statistics and natural perturbation statistics are difficult to collect. However, any normative description of generalization must take uncertainty into account, since variability in the external world can have strong effects on behavior; task uncertainty (Körding and Wolpert, 2004), sensory uncertainty (Wei and Körding, 2010) and motor noise (Harris and Wolpert, 1998; van Beers, 2009), have all been shown to affect individual movements and learning, and may affect the similarity between movements as well as the resulting generalization.
A common interpretation of generalization from one task to another is that stronger generalization indicates a larger overlap in the neural representations of the two tasks. For instance, Krakauer et al. (Krakauer et al., 2000) measured generalization of planar, center-out reaching movements with rotation and gain perturbations. Training with a rotational perturbation in one direction produced strong generalization to nearby angular targets, but did not affect movements to novel targets with large angular separations from the training direction (>45°). On the other hand, visuomotor gain perturbations tended to generalize globally, to all reach directions. This finding suggests that the internal neural representation that
12
changed in response to these perturbations is activated during movements to similar angular directions, and that there may be a polar representation of planar reaches, where reach angle and extent are independent. Here we extend a visuomotor rotations experiment of Krakauer et al. (Krakauer et al., 2000) by introducing variability in the perturbations.
It is not clear, a priori, if and how uncertainty might influence generalization. One hypothesis, from a normative perspective, might be that task variability will make subjects more conservative and generalization narrower. High variability may indicate to subjects that it is less likely that the perturbation will be present for novel targets. A second hypothesis is that higher uncertainty will result in broader neural representations and that these could be reflected in wider generalization patterns. Several theories of the neural representation of uncertainty explicitly predict that uncertainty changes neural tuning. In particular, these models predict that tuning of individual neurons becomes wider with higher uncertainty (Girshick et al., 2011; Zemel et al., 1998), and there is some experimental data suggesting that this may be the case (Barlow et al., 1957; Cisek and Kalaska, 2005) (see Discussion). If generalization patterns trivially reflect overlapping neural tuning and if neural tuning becomes wider with increasing uncertainty then we might expect generalization to become broader with increasing uncertainty. However, it is difficult to match behavioral results to precise neural mechanisms; generalization between two movements can typically only be interpreted in terms of the degree of behavioral similarity between the movements or in terms of an abstract similarity between the neural representations of the two movements (Poggio, 1990; Poggio and Bizzi, 2004; Pouget and Snyder, 2000; Thoroughman and Shadmehr, 2000).
Here, with the goal of examining how uncertainty influences generalization patterns, we designed an experiment to manipulate the mean and the variance of noisy visuomotor rotations relative to the central starting position while subjects performed center-out reaches. We examined how
13 subjects adapt to distributions of perturbations applied during movement in one direction (training direction). On each trial a rotation sampled from a Gaussian distribution with fixed mean and variance was applied to a hidden cursor controlled by the subjects’ index finger. After the subjects adapt, we measure how the learned mean generalizes to movements into other directions. The mean perturbation remained the same under the different noise conditions. If this mean is the only factor driving generalization movements, then we would not expect to see any difference between generalization curves. On the other hand, since uncertainty has been shown to affect many different types of movement, it is important to test whether or not generalization changes under noisy perturbations. We found that the mean of the perturbation generalizes with a width of about 30 degrees, in line with previous studies (Fernandes et al., 2011; Krakauer et al., 2000a; Paz et al., 2005). We found that the variance of the perturbation changes the speed and extent of learning, but, importantly, generalization is unaffected.
2.3
Results
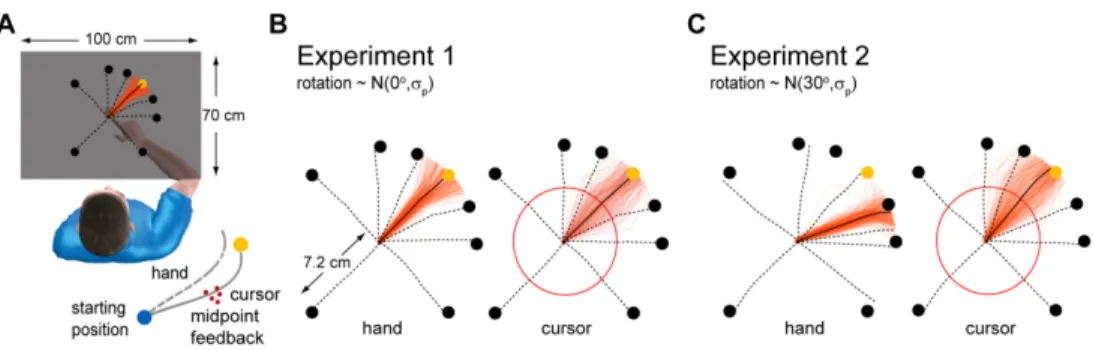
Here we ask how a perturbation that varies randomly across trials is learned for one direction and how adaptation to this perturbation affects movements into other directions. We thus extend movement generalization studies by analyzing how uncertainty, induced by variability or noise in the perturbation, affects generalization patterns. Subjects controlled the position of a hidden cursor with their right index finger by making planar reaches in a projector-mirror system that blocked the view of the hand (Figure 2.1A). They made
center-out reaches from the workspace center to one of eight targets while a visuomotor rotation, relative to the workspace center position, was applied to the hidden cursor position. The visuomotor rotation was drawn randomly each trial from a Gaussian distribution with fixed mean and variance (Figure
14
2.1B). During learning subjects were incentivized to make reaches to one of
the targets and received endpoint feedback about the cursor position that allowed them to adapt to the perturbations. During testing subjects made reaches to the other targets, without endpoint feedback, allowing us to examine the generalization patterns (Figure 2.1C). We then measured how
learning about the rotations under different variance conditions generalized.
Subjects (n=16) were confronted with a rotational perturbation that caused the cursor to deviate from the true hand position as subjects moved away from the center of the workspace. We presented three blocks of training with the same absolute mean perturbation (±30 degrees) but different variability (standard deviations,
σ
p: 0o, 4o or 12o). Since the sign of the mean of the perturbation was randomly chosen for each subject and condition, in order to compare across subjects we transformed the measure of generalization so that positive hand position angles always refer to hand position angles that counteract the average perturbation – we call this measure the absolute angle of final hand position. In agreement with previous studies (Berniker et al., 2010b; Burge et al., 2008), we found that subjects rapidly adapt to the mean rotation, and, while they initially make large errors, subjects learn to counter-act the perturbation so that errors become small over the course of a few trials (Figure 2.2). We found thatlearning is fastest (p<0.03, bootstrap) and most complete (p<0.001, bootstrap) for the condition with zero variance (see Methods for details). As the uncertainty of the perturbation increased learning was both slower and less complete.
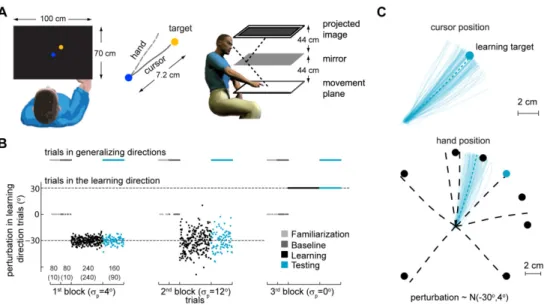
15 Figure 2.1. Experimental setup, protocol and typical trajectory data. A)
Experimental setup. Subjects control the position of a hidden cursor on the screen with their right index finger. A projector-mirror system allows the image on-screen to be perceived as being in the movement plane. Subjects were incentivized to reach to a target (yellow) starting from a central target position (blue). The experiment assesses generalization of the learned mean under different uncertainty conditions. B) Perturbations and block design for an individual subject. Sequence of trials in the learning direction and generalizing directions and perturbations applied to trials in the learning direction for an individual subject.
σ
p denotes the standard deviation of the distribution of perturbations. Each block is composed of 4 sub-blocks:familiarization, baseline, learning and testing. Numbers in the 1st block horizontal axis correspond to the total number of trials during each sub-block (no brackets) and the number of trials towards the learning direction during each sub-block (between brackets). C) Typical hand and cursor position during a testing sub-block. Thin colored lines are movements towards the learning target (colored circles). Dashed thick lines are average hand position for reaches in each direction. Black circles are targets in generalizing directions.
16
Once subjects learn the perturbation in one direction we assess how this learned perturbation generalizes. Using the average final hand position during movements to the testing directions as a measure of generalization, we found that the generalization patterns are local in all three variance conditions (Figure 2.3A-C). This is in line with Krakauer et al. (Krakauer et
al., 2000) whose main condition was essentially identical to our
σ
p=0o
condition. Given that different subjects have different baseline biases and the amount of learning changes depending on subject and condition, we subtracted the baseline biases and normalized the generalization by the amount of learning in the learning direction – we call this measure the percent adaptation relative to the learning direction (Figure 2.3C, see
Methods). Despite the fact that uncertainty influenced the rate and amount of adaptation, we did not find a difference between the generalization curves in the three conditions in the absolute angle of final hand position (Figure 2.3B) (F2,210=1.06, p=0.36, two-way repeated measures ANOVA) or in the
percent adaptation relative to the learning direction (Figure 2.3C)
(F2,210=0.11, p=0.89, two-way repeated measures ANOVA). We also did not
find a significant interaction between uncertainty levels and target angle either in the absolute angle of final hand position (F14,210=1.31, p=0.20,
two-way repeated measures ANOVA) or in the percent adaptation relative to the learning direction (F14,210=0.63, p=0.84, two-way repeated measures
ANOVA). These results suggest that the generalization pattern is independent of the uncertainty about the perturbation.
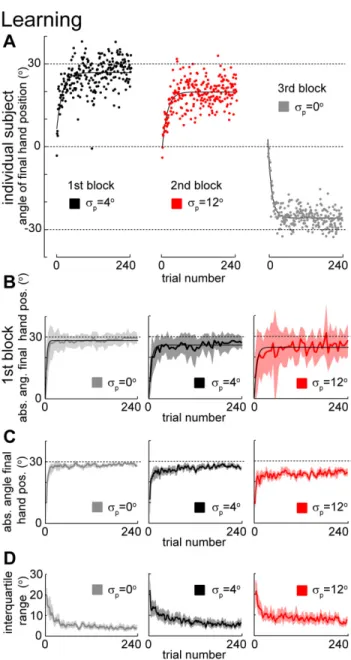
17 Figure 2.2. Learning of mean under different variance conditions. A) Learning the
mean of a perturbation during the first perturbation block for a typical subject. Solid lines denote exponential fits. B) Learning the mean of a perturbation during the first perturbation block across subjects (n=8, n=4, and n=4 for the standard deviations,
p
σ
of 0o, 4o and 12o, respectively). Thick lines are average (±SD) across subjects considering bins of 5 trials. Thin lines are exponential fits. Grey dashed lines indicate the absolute average of the imposed perturbation (30o). C) Learning the18
mean of a perturbation considering all blocks for each variance condition. Thick lines denote medians across subjects and trials in a trial window of 5 trials. Shaded area is 95% confidence region (bootstrap). D) Variability of angle of final hand position. Thick lines denote the interquartile range of the angle of final hand position across subjects and a trial window of 5 trials. Shaded area is 95% confidence region (bootstrap).
With the exception of the transformed sign of the angle of final hand position (for the measures absolute angle and percent adaptation), we have thus far ignored the sign of the perturbation (+30o or -30o) in our analysis. We can take the sign of the perturbation it into account by reflecting the target directions (x-axis in Figure 2.3A-C) of the generalization data relative
to the learning target direction for those blocks that had a -30o as mean of the distribution of perturbations. Given that all sixteen subjects are right-handed, by ignoring the sign of the mean of the distribution of perturbations while combining the data from the different subjects we expect to detect biomechanical biases that could eventually scale with the level of variability but independently of the sign of the perturbation (Figure 2.3B-C). On the
other hand if we take into account the sign of the perturbation we test for influences of angular direction of the mean of the perturbations on generalization and how these might eventually scale with uncertainty (Figure 2.3D, see Methods for details).
When we combine the data across subjects after reflecting of the target directions according to the sign of the mean of the perturbation the generalization data, we observe an asymmetry in the generalization (Figure 2.3D). Although we cannot reject the null hypothesis of no effect of
uncertainty in the three conditions either in the absolute angle of final hand position (F2,210=1.06, p=0.35, two-way repeated measures ANOVA) or in the
percent adaptation relative to the learning direction (F2,210=0.11, p=0.89,
19 level and target direction appears to be significant in both in the absolute angle of final hand position (F14,210=2.06, p=0.016, two-way repeated
measures ANOVA) and in the percent adaptation relative to the learning direction (F14,210=1.95, p=0.023, two-way repeated measures ANOVA). The
direction that corresponds to maximum generalization (determined by fitting a raised von Mises-like function to each subject and condition data, see Methods for details) is not significantly different from zero for the lower uncertainty conditions (p=0.07 and p=0.27, for
σ
p=0o and 4o, respectively; one-sided t-test), but it is significantly different from zero forσ
p=12o (p=0.001, one-sided t-test). Even though it is not consistent with the amounts of uncertainty, there appears to be a weak deviation from a symmetric generalization curve.One possible explanation for the weak asymmetry that we found is use-dependent learning (Diedrichsen et al., 2010; Huang et al., 2011; Verstynen and Sabes, 2011). Under this hypothesis, subjects will tend to bias their reaching towards highly repeated movements. Hand movements during the testing trials would be attracted to the direction in which the hand moved during learning. To determine whether or not use-dependent learning could account for the observed asymmetry, we first plotted a hypothetical symmetric generalization curve - the angle of final hand position (relative to the angle of the learning target) as a function of target direction (Figure 2.3E blue dots) for a perturbation with mean of +30o. Use dependent learning is expected to bias these symmetric movements towards the hand movements during learning (Figure 2.3E red dots). It is difficult to quantify
this small effect exactly, but we observe that use-dependent learning is consistent with the direction of asymmetry that we see in our data.
To check for more subtle differences in generalization we estimated the width of the generalization curve for each individual subject and uncertainty condition (determined by fitting a raised von Mises-like
20
function, see Methods for details). For
σ
p=0o, 4o and 12o we found generalization widths of 27.0±2.2, 24.0±1.1 and 25.4±1.3 (mean±SEM, across subjects), respectively. We could not conclude that higher uncertainty corresponds to wider generalization for any of the 3 pair-wise comparisons (p=0.79, p=0.13 and p=0.92 forσ
p=12 vsσ
p=0o,σ
p=12o vsp
σ
=4o andσ
p=4o
vs
σ
p=0o
, respectively; one-sided paired t-test). These
results suggest that the width of generalization of the mean of a noisy visuomotor rotation does not depend on the level of uncertainty in the perturbation.
Finally we did a post-hoc power analysis to compute the minimum detectable effect size (see Methods for details). The rationale behind this kind of analysis is that there may be a difference in generalization widths and that we did not observe it by chance or because the effect size is small over the range of noise levels used here. We computed how big the effect size should be for us to have a high expectation of observing it using a one-sided paired t-test with significance level of 0.05. We determined that we would expect a probability higher than 0.95 of observing a significant difference in the generalization widths, i.e. we would have had sufficient power to detect an effect, if the effect sizes (generalization widths) were higher than 8.5o, 5.7o and 8.2o for the 12o condition relative to 0o, the 12o relative to 4o, and 4o relative to 0o, respectively. Hence we would expect to observe a significant difference in the generalization widths even if the effect size was relatively small.
22
Figure 2.3. Generalization under different variance conditions. A) Baseline and
generalization of the mean (±SEM) of a perturbation for a typical subject as measured by the absolute angle of final hand position relative to the target. Solid lines are generalization patterns after learning and dashed lines denote the pre-training (baseline) results. B) Average generalization (±SEM) across subjects. Solid lines denote generalization patterns after learning and dashed lines denote the pre-training (baseline) results. C) Percent adaptation (±SEM) in the generalizing directions relative to the learning direction. D) Percent adaptation (±SEM) in the generalizing directions relative to the learning direction after correcting for the sign of the mean of the perturbation; blocks with -30o mean have the target directions (x-axis) reflected relative to the learning direction. E) Diagram illustrating the direction of an asymmetry caused by used-dependent learning. The blue curve denotes a symmetric, local generalization pattern - without used-dependent learning. If there is used-dependent learning, hand movements in trials towards other targets would be attracted towards the direction to which the hand moved during the learning block (dashed red line). This effect would predict an asymmetry with the same side as the one observed in panel D.
2.4
Discussion
Here we extended traditional movement generalization studies by examining how generalization following learning of a visuomotor rotation is affected by the introduction of trial-by-trial variability. We found that generalization about the mean of a visuomotor rotation is largely unaffected when the perturbation is variable – generalization was local under three different variance conditions. Adaptation is slower and less complete with increased variance level but the width of generalization is unaffected.
We could have expected to see differences in generalization widths. Narrower or broader generalization could both have been justified based on normative arguments or under certain assumptions about the how
23 uncertainty affects overlapping neural representation of movement. Furthermore, several previous experiments have shown that generalization widths and patterns are neither universally uniform nor immune to changes in experimental conditions. Even though the width of generalization seems to be consistent across tasks such as reaching and wrist tilting (Fernandes et al., 2011; Krakauer et al., 2000), different kinds of perturbations show wider generalization; for example, gain perturbations in center-out reaches appear to generalize globally (Krakauer et al., 2000). Also, studies that manipulate experimental conditions, such as the complexity of the perturbation (Thoroughman and Taylor, 2005) show changes in width of generalization. Moreover, uncertainty has been shown to affect learning (Berniker et al., 2010b; Shea and Kohl, 1990) and retention (Shea and Kohl, 1990), in particular learning of visuomotor rotations (Saijo and Gomi, 2012; Turnham et al., 2012). As uncertainty is important for all of these other aspects of motor learning, it may well affect generalization patterns as well. Here we have shown that generalization width for visuomotor rotations is not affected by changes in variability at least not up to 12 degrees of standard deviation.
A number of models have been proposed for how the nervous system might represent and manipulate probability distributions and uncertainty (Berkes et al., 2011a; Deneve, 2008; Fiser et al., 2010b; Hinton and Sejnowski, 1983b; Hoyer and Hyvarinen, 2003; Ma et al., 2006; Ma, 2010; Sahani and Dayan, 2003; Zemel et al., 1998). Generally in these models, the probability distribution over the set of expected perturbations or other environmental variable based on past experience is called the prior. After combining the prior expectations with new incoming sensory information – the likelihood - a new probability distribution is computed – the posterior. By manipulating the variance of stochastic perturbations we are modifying the variance of the prior and can alter how much subjects rely on new sensory information during single reaches (Körding and Wolpert, 2004).
24
However, depending on how these distributions are represented by a given neural model and precise assumptions about the neural basis of generalization, these models will make different predictions about generalization behavior.
Some models of neural representation (Girshick et al., 2011; Zemel et al., 1998) explicitly propose an encoding scheme where tuning curves become wider with increasing uncertainty. Under these models neural tuning becomes broader due to the fact that neurons are receiving uncertain input (Zemel et al., 1998) or because they are optimizing the representation of the prior distribution itself with narrowly tuned neurons representing more common directions/orientations (Girshick et al., 2011). Analogous models applied to movement direction would predict that higher uncertainty would lead to broader tuning curves. There is also some experimental data suggesting that individual neurons and populations of neurons are sensitive to changes in uncertainty. Receptive fields in the cat’s retina, for instance, become wider with decreasing light levels (Barlow et al., 1957) and populations of neurons in pre-motor cortex appear to be able to represent uncertainty in reach plans (Cisek and Kalaska, 2005). However, there is still relatively limited experimental evidence to constrain these models of the neural representation of uncertainty, particularly in the movement related brain areas. While many electrophysiological experiments have probed how single neurons represent movement-related variables such as hand-direction, speed, or muscle activity (Georgopoulos et al., 1992; Graham et al., 2003; Kakei et al., 1999; Moran and Schwartz, 1999; Sergio et al., 2005) and even how neural responses change during adaptation to visuomotor rotations (Paz et al., 2003), relatively little is known about how neural activity changes in the presence of sensorimotor uncertainty (but see Britten et al., 1992; Cisek and Kalaska, 2002, 2005; Rickert et al., 2009).
If it is true that the width of generalization curves reflects the tuning widths of the neurons, we did not find signs of such broadening in our
25 generalization study. Importantly, there are three natural interpretations of this result. It could be that our study failed to see the effect because we did not have the necessary statistical power. However, with 16 subjects we ran far more subjects than most movement studies. Also, our power analysis revealed that we should have seen even relatively small effects of broadening; therefore it seems unlikely that this effect exists and we were unable to observe it. Another possibility is that theories that predict broadening of tuning curves are wrong, or at least do not apply to simple targeted reaching movements. However, none of the theories that deal with the representation of uncertainty explicitly mention their predictions of generalization and (third interpretation) generalization may be related to underlying neural representations in a more complex way than generally assumed in motor control research (Donchin et al., 2003; Krakauer et al., 2000a; Thoroughman and Shadmehr, 2000; Thoroughman and Taylor, 2005).
We have found weak signs that generalization curves are slightly asymmetric. Use-dependent learning, where subjects are biased to move in a way that is similar to how they have been moving previously is one of the newly emerging insights in computational motor control (Diedrichsen et al., 2010; Huang et al., 2011; Verstynen and Sabes, 2011). These theories would suggest biases towards the typical direction of hand movement. We find that this is consistent with the weak asymmetry that we found in the generalization curves. Furthermore it is also a potential explanation for the commonly observed adaptation at 180o (Donchin et al., 2003; Fernandes et al., 2011; Krakauer et al., 2000), since movements in this direction are similar to movements returning from the learning target to the center of the working space. Future research would be necessary to clarify which factors give rise to this asymmetry. For example, this asymmetry may disappear if perturbations are introduced in a gradual manner or if limb mechanics are controlled in more detail.
26
For some subjects the simplicity of the task and the salience of the perturbations led to cognitive strategies that may have introduced noise in the measurements. As such, we found relatively high variability across subjects. Gradually introduced perturbations have been shown to lead to a more complete adaptation and larger aftereffects (Kagerer et al., 1997; Taylor and Ivry, 2011b; Turnham et al., 2012). It would be interesting to test if slowly introduced perturbations would reduce the subject-by-subject variance and even have some effect in the generalization widths.
The focus both in behavioral as well as in electrophysiological studies in motor control has been on the generalization and representation of perturbations without any trial-by-trial variability. While uncertainty has been shown to be important in many behavioral settings, variability does not appear to change generalization curves during visuomotor rotation. Variability does affect learning, however, and understanding how variability affects generalization in other tasks should provide some insight into the neural representations of uncertainty and movement.
2.5
Materials and Methods
Ethics statement. The experimental protocol was approved by the
Northwestern University Institutional Review Board and is in accordance with the Northwestern University Institutional Review Board's policy statement on the use of human subjects in experiments. Written informed consent was obtained from all participants. The Institutional Review Board of Northwestern University approved the study.
27
Experimental protocol. Sixteen right-handed healthy subjects (5 male, 11
female; aged 27±3.2 years) participated in the experiment. All were naive to the purpose of the experiment, and were paid according to their performance. Subjects made center-out reaches in an approximately 150 x 150mm central region of a 100cm x 70cm workspace. They controlled the position of a cursor with their right index finger, which was recorded using an Optotrak 3D Investigator Motion Capture System. A projector and mirror system was calibrated such that visual feedback was perceived as being in the movement plane (Figure 2.1A), and the subject's view of their hand was
blocked by the mirror.
The task was designed to measure how subjects generalize the mean of a noisy visuomotor rotation, that is, how a perturbation learned during movements in one direction affects subsequent movements in other, test directions. This experiment extends a previous paradigm that allows measurement of generalization about a fixed perturbation (Krakauer et al., 2000) to include stochastic perturbations.
Subjects were instructed to make center-out reaches into a certain direction (the learning direction) until they adapted to the perturbations/rotations. During this period subjects were given endpoint feedback - that is, the final position of the hidden cursor was displayed - and were eventually able to correct endpoint errors in the learning direction. Afterwards, they were instructed to make movements into other directions (the generalizing directions) in order to measure the generalization pattern of the learned mean of the perturbation. Generalization of the mean was assessed by analyzing their average reaching direction for each target.
The learning direction was randomly sampled from one of the 4 diagonal directions and generalization was measured in 7 directions: 180o, ±90o, ±45o and ±25o from the learning direction (Figure 2.1C). Subjects
28
right index finger. Except for the first familiarization trials the position of the cursor was hidden. Subjects were instructed to make radial reaches from a central blue circle, the starting circle (~6mm radius) to one of 8 yellow circles, the targets (~6mm radius). Targets were all displayed at a distance of 72mm from the central blue circle. 300ms after positioning the cursor over the blue circle, the cursor disappeared, one of the eight targets appeared and subjects had to reach it. On some of the trials the final position of the cursor was displayed for 500ms (endpoint feedback). The final position of the cursor was defined as the first position of the cursor when its center was at a distance greater than 72mm from the center of the starting circle. If the reach was successful, that is, if the center of the red cursor was inside the target then the target turned white and subjects were rewarded by having a point added to their score. If a successful reach happened in those trials where no information was provided about the success of the reach (no endpoint feedback) then a point was added to a hidden score. To initiate the next trial, subjects had to reposition the cursor in the starting blue circle. Except for the familiarization trials where the cursor was always visible, the cursor was visible only within a distance of 10mm from the center of the starting blue circle. Since some subjects have difficulty finding their way back to the starting blue circle, 4 seconds after the previous trial was over, the cursor flashed every second for 50ms to allow subjects to find the starting position.
We measured generalization of the learned mean for a rotation of ±30o under three variability levels. Each trial, noise was added to the visuomotor rotation drawn from a Gaussian with a standard deviation of 0o, 4o or 12o. The standard deviation of 0o reproduces previous experiments that measured the generalization pattern of a deterministic visuomotor rotation (Krakauer et al., 2000).
The experiment was divided into three blocks of 560 trials (Figure 2.1B). Blocks differed in the level of variance and were pseudo-randomized.
29 Each block was composed of 4 sub-blocks: Familiarization, Baseline, Learning and Testing. No rotation was imposed during the familiarization and baseline blocks. In all cases, the maximum time to complete each trial was 4 seconds and the minimum time 40ms. If any of these times was violated the trial was restarted.
Familiarization. During the first half (40 trials, 5 movements to each
target) of the familiarization sub-block the cursor was always visible. During the second half (40 trials, 5 movements to each target) only endpoint position was displayed.
Baseline. This sub-block was used to measure the baseline (80 trials, 10 movements to each target). These reaches were made under the same conditions as the second half of the familiarization block – endpoint feedback was provided in all trials and no perturbation was applied to the cursor.
Learning. Subjects completed 240 trials of movements towards a single learning target with only endpoint feedback. The cursor was rotated relative to hand position.
Testing. The testing sub-block was composed of 160 trials. In order to prevent de-adaptation to the perturbation, the learning target was revisited at least twice every 4 trials; every sequence of 4 trials consisted of two reaches towards the learning target and two reaches towards any two of the 8 targets. Targets were chosen pseudo-randomly so that there were 10 reaches total towards each of the generalizing directions. Endpoint feedback is provided only in the learning direction trials. During these trials towards the learning direction the perturbations applied to the cursor position were sampled from the same distribution used in the learning block.
30
Data analysis. Final hand position angle gives us a measure of the
subject’s estimation of the perturbation. For each trial we computed the final hand position by averaging the last data point before the hand goes beyond a distance of 72mm – the target radial distance – from the center of the starting circle and the first data point after that. Notice that final hand position is well defined for every trial since trials were restarted whenever the subject did not go beyond a distance of 72mm.
Absolute final hand position and percent adaptation. Since the sign of the mean of the distribution of perturbation was randomly chosen for each block and each subject, we normalized the angle of final hand position according to the sign of mean of the perturbations so that the average final hand position angle in the learning direction was positive for every block; this was done by multiplying by -1 the angle of final hand position when the mean of the distribution of perturbations was positive (+30 degrees). We call this measure the absolute final hand position. We measured the baseline movement biases, b(
θ
), and the learned and generalized means, g(θ
), by considering the average absolute angle of final hand position (Figure 2.2).Specifically, b( )
θ
t =θ
t −θ
h tb, and ( ) , g t t h t gθ
=θ
−θ
, whereθ
t is target direction, b t, hθ
and g t, hθ
are average absolute angles of final hand position in trials towards targett
during baseline and testing, respectively. Using this information we can compute the percent adaptation, that is, the difference between testing and baseline in the each direction relative to the learning directionθ
l (Figure 2.3C):( )
( )
percent adaptation( )
100
( )
( )
t t t l lg
b
g
b
θ
θ
θ
θ
θ
−
=
×
−
Notice that a positive absolute angle of final hand position or percent adaptation corresponds to a hand movement that counteracts the mean of
31 the distribution of perturbations. We use one of these two measures in every figure and analysis (with the exception of Figure 2.1A and 2.3E where the
true sign of final hand angle is displayed).
Time-scales of learning. To compute the time scales and amount of adaptation we considered only the first block of learning for each subject (n=8, n=4 and n=4 for
σ
p=0o, 4o and 12o, respectively). We then fitted exponential learning curves that were constrained to start at zero. We used bootstrapping over trials to determine the p-value for the differences between the timescales of learning and between adaptation at end of the learning sub-blocks.Correcting for the sign of the mean of the perturbation. For part of the analysis (Figure 2.3D) we wanted to take into account the fact that, for
some of the blocks, the mean of the imposed perturbation had negative sign (-30o). This was done with the objective of searching for aspects of generalization that could depend on the sign of the imposed perturbation. We did the correction by reflecting the target directions relative to the learning target direction; if we set the learning target direction,
θ
l to be zero, then the corrected generalization functiong
c( )
θ
is defined as:( )
(
)
c
g
θ
=
g
−
θ
.Width of generalization. To determine the generalization width we used raised von Mises-like (circular Gaussian) functions:
2cos( 3)
0 1 2 3 0 1
( | , , , ) exp
g
θ β β β β
=b +b β θ β−2.1
where
θ
is target direction. We fitted these functions to each individual percent adaptation generalization. We used1/
β
2 as the estimate of32
the estimated width of their generalization in at least one of the uncertainty conditions was more than 10 standard deviations away from the mean of the remaining subjects’ widths for that uncertainty condition.
Peak of generalization. To determine if there is a consistent asymmetry in the generalization pattern, we determined, for each subject and each uncertainty condition, the angle of maximum generalization given by the parameter
β
3 in Equation 2.1. The sign of the parameter wascorrected for the sign of the mean of the perturbation, more specifically, we multiplied
β
3 by the sign of the mean of the perturbation.Effect size. To compute the minimum effect size,
η
, that would have been required for detecting an significant effect with probability above 0.95 using a two-sample one-sided paired t-test at a significance level of 0.05, we used the standard minimum detectable effect formula (e.g. see Zar, 1999) 2 2 1 2 0.05,26 0.05,26(
)
14
s
s
t
t
η
=
+
+
where
s
1 ands
2 are the estimated variances of widths for each uncertaintycondition and tα ν, represents the value of the inverse of the cumulative
33
3.
The Generalization of Prior Uncertainty During
Reaching
Hugo L. Fernandes, Ian H. Stevenson and Konrad P. Kording
Article under review
Author Contributions. Conceived and designed the experiments: HLF IHS KPK. Performed the experiments: HLF. Analyzed the data: HLF IHS KPK. Implemented the analysis: HLF with the help of IHS. Wrote the paper: HLF IHS KPK
3.1
Summary
Bayesian statistics defines how new information, given by a likelihood, should be combined with previously acquired information, given by a prior distribution. Many experiments have shown that humans make use of such priors in cognitive, perceptual, and motor tasks, but where do priors come from? As people never experience the same situation twice, they can only construct priors by generalizing from similar past experiences. Here we examine the generalization of priors over stochastic visuomotor perturbations in reaching experiments. In particular, we look into how the first two moments of the prior - the mean and variance (uncertainty) - generalize. We find that uncertainty appears to generalize differently from the mean of the prior, and an interesting asymmetry arises when the mean and the uncertainty are manipulated simultaneously.