DOI: 10.3895/S2318-45312013000100005 ISSN: 2318-4531 29
Abstract— This study aims to evaluate the capacitive
measurement method at low frequencies for determining the moisture content in soybeans. Furthermore, a technique for measuring the moisture content of soybeans at different temperatures is proposed. A practical cylindrical capacitor was designed for the experiments. Capacitive measurements at frequencies of 1 kHz, 10 kHz and 100 kHz were performed using an LCR meter. Two varieties of soybeans were used in the tests, and the differences were evaluated. The errors of the proposed method were analyzed, and the correlation between moisture content and capacitance was verified. The influence of temperature on the measurements was also quantified. Polynomial models are proposed to compensate for temperature variations. It was found that reasonable precision can be achieved at 100 kHz using the temperature compensation provided by the designed models.
Index Terms— Capacitance, Capacitive sensors, Moisture
measurement, Soybeans, Temperature, Polynomial model.
I. INTRODUCTION
HE detection of moisture content in seeds and grains is essential for the majority of processes related to their supply chain. The moisture content of agricultural products, such as soy, corn, rice and wheat, is crucial to guiding many processes. In addition, the moisture content is a key parameter in defining the optimal time for harvest and the maximum storage period, in preparing seeds for oil mill feedstock and even in regulating the final price of the grains or seeds.
William S. Bessa, Eduardo P. Ribeiro, Marlio C. Bonfim and Gideon V. Leandro are with Department of Electrical Engineering, Federal University of Parana, P.O. Box 19011, Centro Politecnico, Curitiba, PR, Brazil(e-mail: [email protected], [email protected], [email protected], [email protected]).
Marcelo R. Errera is with Environmental Engineering Department, Federal University of Parana, P.O. Box 19011, Centro Politecnico, Curitiba, PR, Brazil(e-mail: [email protected]).
One of the most important steps in soybean preparation is the drying process. After the harvest, soybeans must be dried to levels between 10% and 13% (wet basis) of the MC (moisture content), which is achieved by processing the soybeans in a dryer. The process of drying the soybeans to the correct moisture content level extends the storage time of the seeds by inhibiting mold and insect activity in the storage environment [1]. Furthermore, when the seeds are properly dried, they are less likely to be damaged by splitting or cracking during handling [2].
To achieve an efficient and appropriate drying process, it is essential to control the air flow, temperature and linear velocity in the drying chamber as the seeds travel through it. Feedback control loop methods with on-line measurements of the seeds’ moisture content are applied to provide an efficient drying process by relating different combinations of the above variables to the moisture content. Optimization and control of the drying parameters ensure proper quality of the seeds and decrease the cost of production due to energy savings, reduced maintenance costs and shorter drying times [3].
Standard gravimetric methods for estimating the moisture content in grains or seeds require mechanical equipment and are time-consuming and susceptible to various errors in measurement. Such methods, therefore, are unsuitable for real-time measurements.
The electrical properties of grains and seeds can also approximate the moisture content with reasonable accuracy [4]. A close association between the electrical resistance of wheat grains and their moisture content was reported in the beginning of the last century [5]. A historical report on the advances in measuring grain moisture content by detecting their electrical properties was presented by Nelson et al. [6]. Over the years, the radio-frequency range has been conventionally adopted for capacitive measurements. Nevertheless, additional studies have indicated that measurements at microwave frequencies may also be a good
Analysis of capacitive measurements at low
frequencies for moisture content determination
in soybeans
T
William S. Bessa, Eduardo P. Ribeiro, Marlio C. Bonfim, Gideon V. Leandro, and Marcelo R. Errera __________________________________________________________________________________
DOI: 10.3895/S2318-45312013000100005 ISSN: 2318-4531 30 option for sensing moisture content by providing a
density-independent method [7, 8].
Variations in the dielectric properties of soybeans have been studied using a sensor based on a cylindrical capacitor [9]. Results have indicated that under lower measurement frequencies, the change in the dielectric constant of soybeans is greater than at high frequencies, with respect to the moisture content.
The development of an electronic instrument to measure the moisture content of seeds, nuts and grains was reported by Kandala et al. [10]. Empirical equations for calculating the moisture content were determined for capacitive measurements carried out at frequencies between 1 and 5 MHz. The results indicated that such measurements are in reasonable agreement with the traditional air-oven method, with precision errors of less than 1%.
A microprocessor-based grain moisture measurement system was developed by Rai et al. [11]. The authors used a parallel plate capacitor for sensing the moisture content in a range from 5% to 25%, with an accuracy of +/- 0.5%. The device was also designed to compensate for temperature variations.
Over the years, most studies have adopted radio-frequency and microwave ranges to study moisture content sensors based on the capacitive method. The present work aims to test this method at lower frequencies (1 kHz to 100 kHz) to confirm whether good precision is achievable under such conditions. To rapidly sense the moisture content of soybeans with temperature compensation, additional measurements were performed within a temperature range of 25 ºC to 60 °C. If the applicability of this method is confirmed, it would enable, for example, the development of inexpensive moisture content meters due to the simplicity of the electronic circuitry required for these measurement conditions.
To achieve the goals set forth above, the study was divided into the following steps:
a. To estimate the error of the measurement process under the described condition;
b. To test two varieties of soybeans;
c. To quantify the influence of temperature on the capacitive measurements;
d. To propose polynomial models for determining soybean moisture content with temperature compensation.
II. MATERIALS AND METHODS A. Basic Principles
The cylindrical capacitor is composed of two coaxial cylinders with different radii. The capacitance of this device is proportional to its geometrical dimensions and the electrical permittivity of the material between the metal plates. In this model, the dimensions are the length L, the radius of the larger cylinder R1 and the radius of the smaller cylinder R2. The
resulting capacitance can be approximated as follows: ) ln( / ) 2 ( 0L R1 R2 C r (1)
where C is the read capacitance, r is the dielectric constant of
the material between the plates and 0 is the electrical
permittivity of vacuum (8.854 x 10⁻¹² F/m).
The geometry of the capacitor is held fixed throughout the entire study, and only the relative permittivity of the material between the cylinders changes according to variations in moisture content and temperature.
The moisture content of the soybean samples was reported in dry basis, which is calculated as follows:
d w
DB m m
MC (2)
where MCDB is the moisture content of the sample in dry basis, mw is the mass of water contained in the soybeans and
md is the dry mass of the sample.
B. Measurement Methods
The capacitor used in the experiments was constructed from two co-axial steel cylinders 100 mm in length. The larger cylinder had an internal radius of 27 mm, and the smaller cylinder had an external radius of 10 mm. The larger cylinder was positioned as the external plate of the capacitor, and the smaller cylinder was mounted as an internal plate. The cylinders were assembled over a plastic polymer base designed to maintain the distance between the metal cylinders and to close one of the extremities of the capacitor.
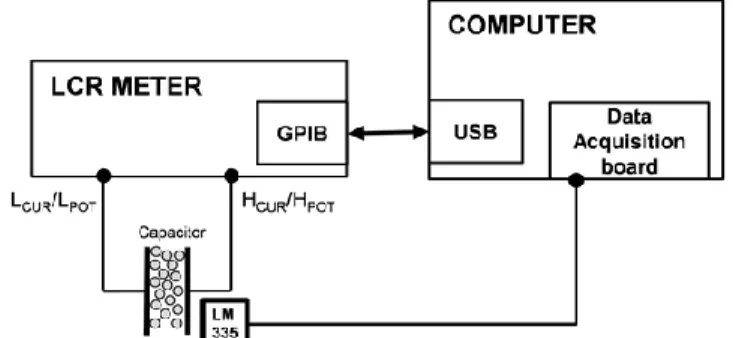
A LCR meter was used to measure the capacitance of the device. The LCR meter determines the capacitance of an electronic device via the impedance method and provides several impedance parameters and formats. The parallel model of impedance measurement was chosen to measure the capacitance and parallel resistance of the designed cylindrical capacitor. The frequencies adopted during the measurements were 1 kHz, 10 kHz and 100 kHz. The applied voltage for measuring the capacitance was 1 VRMS. The basic accuracy of
the LCR meter was 0.1% of the readings.
The LCR meter was connected to a computer via a USB-GPIB interface adapter. A computer program was developed to acquire and store the data. In addition, the program was able to command the LCR meter to automate the measurements.
The temperature readings were collected using a LM335 solid-state voltage output sensor. The sensor was mounted in its basic configuration, in which the output voltage varies by 10 mV/°K. The temperature measurements were acquired in a
DOI: 10.3895/S2318-45312013000100005 ISSN: 2318-4531 31 computer using a PCI (Peripheral Component Interconnect)
acquisition board and a computer program. When calibrated at 25 ºC, the LM335 sensor has a typical accuracy better than 0.25 ºC in the range of 25 ºC to 60 °C. Fig. 1 shows a block diagram of the system setup for performing the capacitive and temperature measurements.
A 4-digit precision electronic balance, with an operating range of 0 to 200 g and a readability of 0.1 milligrams (mg), was used to measure the weight of the soybean samples. The seeds were placed in aluminum crucibles that could withstand the experimental temperature range and that allowed for uniform transmission of the heat for the soybeans inside the air oven.
C. Samples
Two varieties of Glycine max (L.) were used in the experiments. The samples were obtained from different farms in Paraguay (Sample A) and Brazil (Sample B). The Brazilian sample had an initial moisture content of approximately 21% (dry basis), and the Paraguayan sample had a moisture content of approximately 23%. The varieties differed in size and color tone (all predominantly beige).
Approximately 240 g of each sample was gathered. The weights of the samples were measured with the soybeans inside three crucibles (one crucible was measured at a time). The values were recorded to calculate the moisture content of the samples (in dry basis) at the end of the experiment. D. Measurements
Each of the two soybean samples was first weighed with an electronic balance and then placed in the aluminum crucibles. Afterwards, the samples were dried in a hot-air oven at 130 °C over different durations. The time steps (total time that the soybeans remained in the oven) started with 20 minutes for the first three steps. The next two steps lasted 30 minutes. Then, there was a step of 60 minutes. Lastly, there were two steps of 90 minutes. In total, the samples passed through seven steps and 6 hours of drying in the air oven. At each step, the weights of the samples were measured after the cooling process.
The samples cooled inside the cylindrical capacitor for each step. The resultant capacitance and temperature were measured using the LCR meter and the thermistor while the sample cooled inside the capacitor. The LCR meter was set for frequencies of 1 kHz, 10 kHz or 100 kHz. The data were read, processed and stored in the computer using a specially developed program. The measurement temperatures ranged from 52 °C to 25 °C.
To determine the repeatability error arising from repositioning the seeds inside the capacitor and possible bulk density variations, the capacitance was measured by replacing the soybean samples inside the capacitor 10 consecutive times for each drying step. This procedure was performed after the soybeans had cooled to ambient temperature (approx. 25 °C).
The procedure described above led to a set of data for each sample drying step, which ultimately allowed us to obtain a correlation between the measured capacitance and temperature and moisture content.
Using the experimental results, nonlinear polynomial correlations were calculated for MC with respect to capacitance and temperature. The correlations were tested using the RMSE (Root Mean Squared Error) and MR (Maximum Residuals).
III. RESULTS A. Repeatability Error
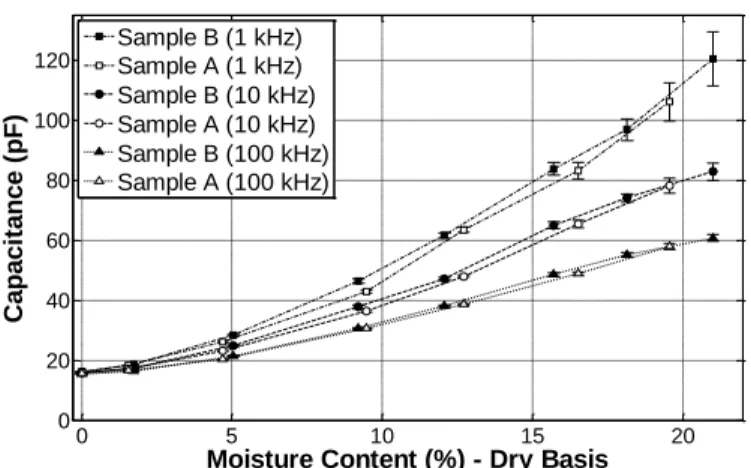
The procedure used to determine the influence of seed repositioning in the capacitor indicated an inherent random error. The chart in Fig. 2 shows the results for the capacitance measured for each moisture content step for the three test frequencies and the two soybean samples. The error bars represent the seed repositioning error. The confidence interval of the measurements was estimated using Student’s t-distribution, with 95% confidence bounds and 9 degrees of freedom.
The measurement error increased with the moisture content of the tested seeds. The largest deviation was found at 1 kHz for a moisture content of 21%, which resulted in a confidence interval of ±9 pF. In contrast, the confidence interval of the measurements at 100 kHz was less than 1.2 pF at the same moisture level. When the moisture content of the seeds was 0%, i.e., when all of the free water was removed, the standard deviation was less than 0.03 pF for all samples and measurement frequencies.
The chart shown in Fig. 2 indicates that the change in the dielectric constant of the seeds with increasing moisture content is greater for measurements at lower frequencies. This finding confirms previouslyreported results for other types of grains and seeds [6, 8, 9, 12, 13].
The measurements in Fig. 2 also show that the dielectric constant of the seeds approaches the same value when the seeds are completely dry, independent of the measurement frequency or sample. Despite the differences between the two seed varieties, the results show that samples A and B exhibited similar behavior, especially for measurements at 100 kHz. 1) Signal-to-noise ratio analysis
To assess the ability to measure moisture content in the presence of repeatability errors, we examined the signal-to-noise ratio (SNR). In this study, the signal is considered the
Fig. 2. Variation of the capacitance with moisture content for samples A and B at frequencies of 1 kHz, 10 kHz and 100 kHz (at approx. 25 °C).
0 5 10 15 20 0 20 40 60 80 100 120
Moisture Content (%) - Dry Basis
C a p a c it a n c e ( p F ) Sample B (1 kHz) Sample A (1 kHz) Sample B (10 kHz) Sample A (10 kHz) Sample B (100 kHz) Sample A (100 kHz)
DOI: 10.3895/S2318-45312013000100005 ISSN: 2318-4531 32
amplitude variation of capacitance in the moisture content range (0 - 21%), and the noise is the standard deviation of the measured capacitance values:
% 21 % 0 % 21 )/ ( DB MC (3)
where µ is the mean (according to the MC) and σ is the maximum standard deviation of the sample within the moisture content range (occurring at MC=21%). Larger SNR values indicate better precision. Table I shows the SNR for the three test frequencies.
The lowest signal-to-noise ratio was observed for measurements at 1 kHz (11.2 and 9.9 for samples A and B, respectively), although this frequency provided the highest sensitivity. In contrast, measurements at 100 kHz showed more potential for determining the moisture content of the soybeans for both samples. In the latter case, the SNR was 32.4 and 34.8 for samples A and B, which is at least 2.8 times better than the measurements at 1 kHz.
The signal-to-noise ratio tests confirm previous studies demonstrating that measurements at higher frequencies (100 kHz in this study) are less susceptible to mechanical variations such as the bulk density of the seeds [6, 8]. Therefore, the SNR results indicate that lower frequencies may not be the optimal measurement frequency range, as the measurements at 10 kHz and 100 kHz provided better results.
2) Correlation analysis
To verify the strength of the nonlinear association between capacitance and moisture content, the Eta coefficient (η) was determined for the results shown in Fig. 2. η is a correlation ratio developed to describe the curvilinear relationships between variables [14] and can be calculated as follows:
total
between SS
SS
(4)
where SSbetween is the sum of squares between groups
(capacitance measurements at different moisture contents) and SStotal is the total sum of squares. The correlation between
variables is considered to be strong when the η coefficient
approaches 1. Table 2 shows the results of the Eta correlation coefficient for the tested samples.
The results indicate a strong correlation between the capacitance and soybean moisture content for all tested samples, as all coefficients were greater than 0.98. The measurements at 100 kHz presented the strongest correlation, with values close to 0.999 for both samples.
The correlation tests statistically confirm that the dielectric constant of soybeans is intrinsically associated with their moisture content, which has also been indicated by previous studies [6, 8, 9, 12, 13].
B. Temperature Data
The experimental data were gathered to determine a simple temperature compensation system that can describe the relation among the capacitance (pF), temperature (°C) and moisture content (% - dry basis). For instance, Fig. 3 illustrates the results obtained for the data acquired for sample A at 100 kHz. Similar trends were observed for the other measurements.
The capacitance increases with the temperature as the moisture content is held constant (Fig. 3). The same trends were previously observed for soybeans [13] and soybean flour [15]. In addition, the data in the chart (Fig. 3) indicate that the capacitive measurements tend to have a linear relationship for temperatures below 45 °C. The fluctuation in capacitance with temperature was almost negligible when the soybeans were completely dried (0% of MC), which is in agreement with
TABLEI
SNR RESULTS FOR EACH SAMPLE AND MEASUREMENT FREQUENCY.
Sample 1 kHz 10 kHz 100 kHz
A 11.2 20.2 32.4
B 9.9 19.6 34.8
TABLEII
ETA CORRELATION COEFFICIENT CALCULATED FOR THE DATA PRESENTED IN FIGURE 2. Sample Statistical Indicator 1 KHZ 10 kHz 100 kHz A Eta Coefficient 0.990 0.996 0.999 B 0.988 0.997 0.999 TABLEIII
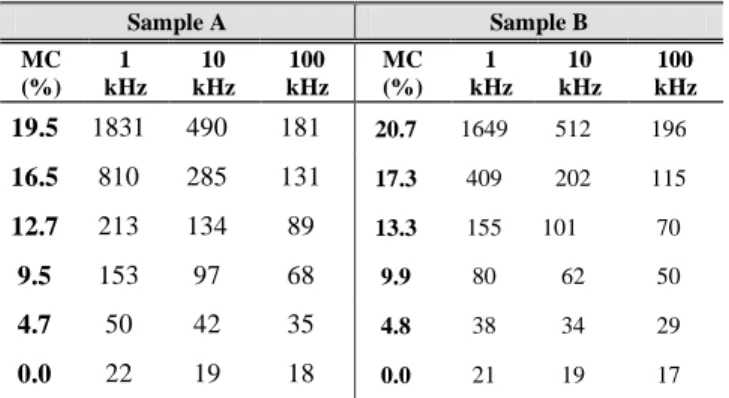
MEASUREMENTS FROM THE PROCEDURE DESCRIBED IN SECTION 2.THIS TABLE SHOWS THE MEASURED CAPACITANCE (IN PF) AT THE HIGHEST TEMPERATURE
OF THE EXPERIMENT (52 ºC). Sample A Sample B MC (%) 1 kHz 10 kHz 100 kHz MC (%) 1 kHz 10 kHz 100 kHz 19.5 1831 490 181 20.7 1649 512 196 16.5 810 285 131 17.3 409 202 115 12.7 213 134 89 13.3 155 101 70 9.5 153 97 68 9.9 80 62 50 4.7 50 42 35 4.8 38 34 29 0.0 22 19 18 0.0 21 19 17
Fig. 3. Variation of the measured capacitance with temperature and moisture content (dry basis) at 100 kHz for sample B.
25 30 35 40 45 50 0 50 100 150 200 Temperature (°C) C a p a c it a n c e ( p F ) 19.5% 16.5% 12.7% 9.5% 4.7% 0.0%
DOI: 10.3895/S2318-45312013000100005 ISSN: 2318-4531 33 previous studies [13].
In addition to the chart in Fig. 3, Table 3 shows the capacitance values for measurements at 52 °C. The trends in Table 3 are in agreement with those shown in Fig. 3. For example, the capacitance of sample A at 1 kHz was 1831 pF, while at 100 kHz, the capacitance was 181 pF.
C. Capacitive Measurement Model
To develop a model for estimating the soybeans’ moisture content according capacitive and temperature measurements, the acquired data were used to perform curve fittings by polynomial interpolation. Polynomial models were used to establish a simple mathematical equation for calculating the moisture content with temperature compensation.
The moisture content (MCDB %) was considered a function
of capacitance (C) and temperature (T) as nth and mth order nonlinear polynomial functions of C and T, respectively, as shown in Eq. (5): 00 01 10 11 2 21 2 2 22 ... ) , ( (%) a T a C a CT a T C a T C a T C a T C f MCDB nm n m (5)
where f(C,T) is the function MCDB (%), C and T are the two
independent variables and anm represents the coefficients. Each
model was applied to measurements at a given frequency. Four models were tested to determine the optimal fitted polynomial equation. Table IV presents the polynomial order for each model.
The fitted models considered the measured values with 95% confidence bounds. We then analyzed the developed models based on the maximum degree of the terms (m, n), the number of coefficients and the statistical adherence of the model against the measured data. We also used the RMSE and MR as statistical indicators to evaluate the exactness of the fitted models.
The RMSE is an indicator that evaluates the difference between the values predicted from a model and those observed experimentally. This indicator provides a good estimation for the accuracy of the developed model. The RMSE was calculated as follows: n x x RMSE n i ai bi
1 2 , , ) ( (6)where xa,irepresents the observed values, xb,i is the value
approximated by the polynomial model and n is number of
points used in the approximation.
The residuals of a fitted model represent the effective difference between the observed values and the values estimated from the model under the same conditions. The MR is the maximum difference found from the residuals in the measurement range. The MR was calculated as follows:
n i
x x
MRmax( a,i b,i), 1,2,..., (7)
where xa,iis the observed value, xb,i is the value approximated
from the model and n is number of points. 1) Curve fittings
We sought a general model that would work for both soybean samples A and B; thus, all of the data were considered for each curve-fitting model. Table V shows the results of the proposed statistical indicators for the fitted models in the three right-most columns under the respective frequency.
The calculated models provided the best fit to the measured data when the frequency was higher, regardless of the order of the polynomial model, which is in agreement with the trends presented by the SNR values shown in Table I. Model 3, when applied to the data at 100 kHz, provided the best curve-fitting result.
When the exponent of the temperature (T) was increased from 1 to 5, the exactness of the fitting showed little improvement. That is, the overall capacitance tends to be linear with respect to temperature, despite the nonlinear variation at the higher moisture content of 19.5%, as shown in Fig. 3. This finding suggests that other mathematical models may be more suitable for fitting temperature variations.
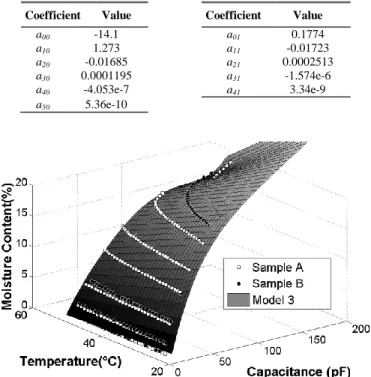
For the sake of simplicity, one may prefer Model 3 for developing a measurement system with temperature compensation because it requires fewer coefficients and provides the best fit to the data when considering both the RMSE and MR. Table VI shows the fitted coefficients for Model 3. Figure 4 illustrates a three-dimensional plot of the data acquired at 100 kHz and the fitted surface for Model 3.
TABLEV
STATISTICAL RESULTS OF THE FITTED POLYNOMIAL MODELS.THE RMSE AND MR INDICATORS ARE PRESENTED IN TERMS OF MOISTURE CONTENT (%- DRY BASIS).BOTH SAMPLES A AND B WERE CONSIDERED IN THE CALCULATIONS.
Samples Model Coefficient Statistical
Indicator 1 kHz 10 kHz 100 kHz A & B 1 5 RMSE 3.5 2.1 1.2 MR 16.6 10.6 5.1 2 15 RMSE 2.3 1.3 0.9 MR 5.0 3.4 2.4 3 11 RMSE 1.4 0.9 0.8 MR 6.6 2.1 1.7 4 21 RMSE 1.4 0.9 0.8 MR 8.0 2.2 2.1 TABLEVI
THE SELECTED POLYNOMIAL MODELS FOR THE CURVE FITTING ANALYSIS.
Model n m Polynomial order
1 2 1 3
2 2 5 7
3 5 1 6
DOI: 10.3895/S2318-45312013000100005 ISSN: 2318-4531 34
IV. CONCLUSION
A cylindrical capacitor was used as a sensing device to measure the moisture content of soybeans at different temperatures and frequencies. The measurements were carried out at low frequencies, namely, 1 kHz, 10 kHz and 100 kHz, to investigate their correlation with the soybeans’ moisture content.
According to the repeatability and SNR results, the applied technique demonstrates that good precision is possible, especially for measurements at 100 kHz. Although the capacitive measurements at 1 kHz were larger in magnitude, the SNR analysis showed that the measurements at 100 kHz presented the best precision for measuring the moisture content of the seeds. According to the correlation tests, the capacitive measurements carried out at 100 kHz showed a stronger relationship with the moisture content. However, good correlation was also confirmed for the other two test frequencies (1 kHz and 10 kHz).
Models were proposed to measure the soybeans’ moisture content with temperature compensation. A six-degree polynomial equation was found to be applicable for determining moisture contents up to 20% for temperatures between 25 °C and 52 °C. In the current study, an overall deviation of less than 1% in MC was reached for the 100-kHz measurements (with a MR of 1.7% of MCDB). Additional
measurements may be required to confirm the accuracy for other soybean varieties.
It was found that the two tested soybean varieties presented similar behavior in terms of the correlation ratio, SNR and temperature analysis.
The results show that a low-frequency capacitive sensor with temperature compensation is feasible with the proposed models. With further improvements, this approach may enable the development of a practical instrument. Both the instrument and the feedback controlling system could be valuable tools in drying and processing soybeans.
Future studies on methods for measuring the capacitance of seeds moving and flowing inside the capacitor walls may help to evaluate the behavior of the capacitive sensor under conditions similar to those of a dryer.
REFERENCES
[1] E. R. De Alencar, L. R. D’A. Faroni, A. F. De Lacerda Filho, L. G. Ferreira and M. R. Meneghitti,“Influence of different storage conditions on soybean grain quality”, 9th International Working Conference on
Stored Product Protection, pp. 30-37, Campinas, Brazil, 2006.
[2] E. R. De Alencar andL .R. D’A. Faroni,“Storage of Soybeans and Its Effects on Quality of Soybean Sub-Products”, Recent Trends for
Enhancing the Diversity and Quality of Soybean Products, Prof. Dora
Krezhova (Ed.), pp. 47-66, InTech, Rijeka, Croatia, 2011.
[3] P. Dufour,“Control Engineering in Drying Technology: Review and Trends”, special issue of Drying Technology on Progress in Drying
technologies, vol. 24, pp. 889-904, 2006.
[4] S. O. Nelson, S. O.,“Dielectric Properties Measurement Techniques and Applications”. Transactions of the ASAE, vol. 42, pp. 523-529, 1999. [5] L. G. Briggs,“An Electrical Resistance Method for the Rapid Determination of the Moisture Content of Grain”. Science,vol. 28, pp. 810-813, 1908.
[6] S.O. Nelson, A. W. Kraszewski, S. Trabelsi and K. C. Lawrence,“Using Cereal Grain Permittivity for Sensing Moisture Content”, IEEE
Transactions Instrumentation and Measurement, vol. 49, pp. 470-475,
2000.
[7] S. O. Nelson,“Dielectric Properties of Agricultural Products -measurements and applications”, IEEE Transactions on Electrical
Insulation, vol. 26, pp. 845-869, 1991.
[8] S. O. Nelson and S. Trabelsi,“Use of Grain and Seed Dielectric Properties for Moisture Measurement”,Southeastcon, 2011 Proceedings
of IEEE, pp. 201-206, Nashville, TN, USA, 2011.
[9] Y. Bao, Z. Zhu, Y. Wu andY. He,“Study on Rapid Measurement of Soybeans Moisture Content Based on Dielectric Properties”. IEEE
Instrumentation and Measurement Technology Conference, pp. 232-255,
Ottawa, Canada, 2005.
[10] C. V. K. Kandala, C. L. Butts and andS. O. Nelson,“Capacitance Sensor for Nondestructive Measurement of Moisture Content in Nuts and Grain”, IEEE Transactions Instrumentation and Measurement, vol. 56, pp.1809-1813, 2007.
[11] A. K. Rai, P. K.Khare and P. Mor,“Microprocessor Based Measurement System for Grain Moisture”,IET-UK International Conference on
Information and Communication Technology in Electrical Sciences, pp.
850-856, Tamil Nadu, India, 2007.
[12] S. O. Nelson, (1978),“Frequency and Moisture Dependence of the Dielectric Properties of High-Moisture Corn”,Journal of Microwave
Power, vol. 13, pp. 213-218, 1978.
[13] T. Olivo, W. Bessa, M. R. Errera, M. Bonfim andE. P. Ribeiro, “Determinação da Umidade da Soja por Medida Capacitiva” (Portuguese), XVII Brazilian Conference on Automation, pp. 4195-4201, Bonito, Brazil, 2010.
[14] P. Y. Chen and P. M. Popovich (2002). “Special Cases of Pearsos’s r” in
Correlation: Parametric and Nonparametric Measures, 1st ed., Thousand Oaks, CA: Sage Publications, Inc., 2002, pp 38-40.
[15] W. Guo, S. Wang,G. Tiwari, J. A. Johnson and J. Tang, “Temperature and moisture dependent dielectric properties of legume flour associated with dielectric heating”, LWT - Food Science and Technology, vol. 43, pp. 193-201, 2010.
TABLEVI
COEFFICIENTS CALCULATED FOR FITTING MODEL 3 AT 100 KHZ, REPRESENTED ACCORDING TO EQ.4.
Coefficient Value Coefficient Value
a00 -14.1 a01 0.1774 a10 1.273 a11 -0.01723 a20 -0.01685 a21 0.0002513 a30 0.0001195 a31 -1.574e-6 a40 -4.053e-7 a41 3.34e-9 a50 5.36e-10
Fig. 4. Polynomial surface from Model 3 and the measured data (at 100 kHz) from samples A and B.