using Part-of-Speech tags
Teresa Gon¸calves and Paulo Quaresma
Departamento de Inform´atica, Universidade de ´Evora 7000-671 ´Evora, Portugal
tcg | [email protected]
Abstract. Support Vector Machines have been applied to text classification with great success. In this paper, we apply and evaluate the impact of using part-of-speech tags (nouns, proper nouns, adjectives and verbs) as a feature selection procedure in a European Portuguese written dataset – the Portuguese Attorney General’s Office documents.
From the results, we can conclude that verbs alone don’t have enough informa-tion to produce good learners. On the other hand, we obtain learners with equiva-lent performance and a reduced number of features (at least half) if we use specific part-of-speech tags instead of all words.
1
Introduction
The learning problem can be described as finding a general rule that ex-plains data given a sample of limited size. In supervised learning, we have a sample of input-output pairs (the training sample) and the task is to find a deterministic function that maps any input to an output such that the dis-agreement with future input-output observations is minimised. If the output space has no structure except whether two elements are equal or not, we have a classification task. Each element of the output space is called a class.
Our problem can be viewed as a supervised classification task of natural language texts, also known as text classification. Research interest in this field has been growing in the last years. Several learning algorithms were applied such as decision trees [14], linear discriminant analysis and logistic regression [10], na¨ıve Bayes algorithm [7] and Support Vector Machines – SVM [6].
In [12], linguistic information is applied on the preprocessing phase of text mining tasks. This work applies a linear SVM to the Portuguese Attorney General’s Office dataset – PAGOD [8], addressing the impact of using part-of-speech (POS) tags to build the learner.
In previous work, we evaluated SVM performance compared with other Machine Learning algorithms [5] and performed a thourough study on some preprocessing techniques (feature reduction, feature subset selection and term weighting) and on the performance achieved when balancing the dataset [4]. In Section 2, a brief description of the Support Vector Machines theory is presented, while in Section 3 the PAGOD dataset is characterised. Section
4 describes our experimental setup, Section 5 our previous experiments and Section 6 our present work. Conclusions and future work are pointed out in Section 7.
2
Support Vector Machines
Motivated by theoretical results from statistical learning theory, Vapnik and coworkers [2] introduced the Support Vector Machines learning algorithm. It joins a kernel technique with the structural risk minimisation framework.
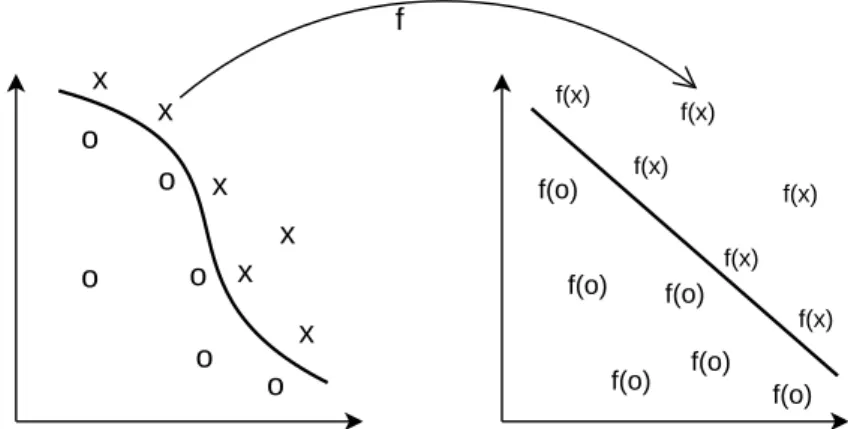
Kernel techniquescomprise two parts: a module that performs a mapping into a suitable feature space and a learning algorithm designed to discover linear patterns in that space. The kernel function, that implicitly performs the mapping, depends on the specific data type and domain knowledge of the particular data source. The learning algorithm is general purpose and robust. It’s also efficient, since the amount of computational resources required is polynomial with the size and number of data items, even when the dimension of the embedding space grows exponentially [11]. Four key aspects of the approach can be highlighted as follows:
• Data items are embedded into a vector space called the feature space. • Linear relations are discovered among the images of the data items in the
feature space.
• The algorithm is implemented in a way that the coordinates of the em-bedded points are not needed; only their pairwise inner products. • The pairwise inner products can be computed efficiently directly from
the original data using the kernel function. These stages are illustrated in Figure 2.
o o o o o o x x x x x x f(x) f(x) f(x) f(x) f(x) f(x) f(o) f(o) f(o) f(o) f(o) f(o) f
Fig. 1. Kernel function: The nonlinear pattern of the data is transformed into a linear feature space.
The structural risk minimisation (SRM) framework creates a model with a minimised VC dimension. This developed theory [15] shows that when the VC dimension of a model is low, the expected probability of error is low as well, which means good performance on unseen data (good generalisation).
SVM can also be derived in the framework of regularisation theory in-stead of the SRM theory. The idea of regularisation, introduced by Tickonov and Arsenin [13] for solving inverse problems, is a technique to restrict the (commonly) large original space of solutions into compact subsets.
3
Dataset Description
Each PAGOD document is classified into multiple categories so, we have a multi-label classification task. Normally, this task is solved by splitting it into a set of binary classification tasks and considering each one independently.
This dataset has 8151 documents and represents the decisions of the Por-tuguese Attorney General’s Office since 1940. It is written in the European Portuguese language, and delivers 96 MBytes of characters. All documents were manually classified by juridical experts into a set of categories belonging to a taxonomy of legal concepts with around 6000 terms.
A preliminary evaluation showed that, from all potential categories only about 3000 terms were used and from all 8151 documents, only 6388 con-tained at least one word on all experiments. For these documents, we found 77723 distinct words, and averages of 1592 words and 362 distinct words per document.
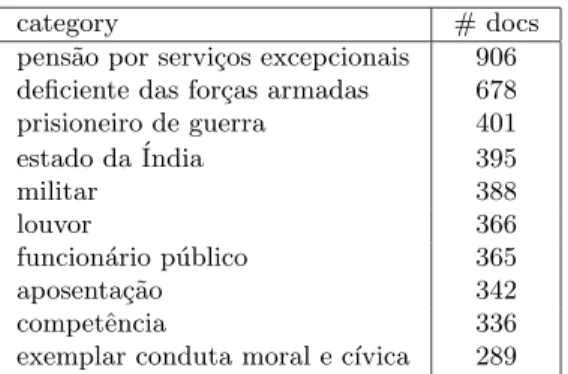
Table 1 presents the top ten categories (the most used ones) and the number of documents that belongs to each one.
category # docs
pens˜ao por servi¸cos excepcionais 906 deficiente das for¸cas armadas 678 prisioneiro de guerra 401 estado da ´India 395
militar 388
louvor 366
funcion´ario p´ublico 365 aposenta¸c˜ao 342
competˆencia 336
exemplar conduta moral e c´ıvica 289
Table 1.The top ten categories for the PAGOD dataset.
The Portuguese language is a rich morphological one: while nouns and adjectives have 4 forms (two genres – male and female and two numbers –
singular and plural), a regular verb has 66 different forms (two numbers, three persons – first, second and third and five modes – indicative, conjunctive, conditional, imperative and infinitive, each with different number of tenses ranging from one to five).
4
Experimental setup
This section presents the choices made in our study: document’s represen-tation, the process for obtaining the POS tags, the kind of procedure used to reduce/construct features and the measures used for evaluating learner’s performance.
The linear SVM was run using the WEKA [16] software package from the University of Waikato, with default parameters. We performed a 10-fold cross-validation procedure.
Representing documents. To represent each document we chose the bag-of-words approach, a vector space model (VSM) representation. Each docu-ment is represented by the words it contains, with their order and punctuation being ignored. From the bag-of-words we removed all words that contained digits.
Obtaining the POS tags. To obtain each word’s POS tag we used a parser for the Portuguese language – PALAVRAS [1]. It was developed in the context of the VISL1
(Visual Interactive Syntax Learning) project in the Institute of Language and Communication of the University of Southern Denmark.
The POS tagger incorporated in the parser is reported to have more than 95% accuracy for texts written in Portuguese. Possible tags are:
• noun (nn),
• proper noun (prop), • adjective (adj ), • verb (vrb), • article (det ), • pronoun (pron), • adverb (adv ), • numeral (num), • preposition (prp), • interjection (in) and • conjunction (conj )
From all possible tags, we just considered nn, prop, adj and vrb.
Parser’s output is the syntactic analysis of each phrase and the POS tag associated with each word.
1
For example, the morphological tagging of the phrase ”O Manuel ofereceu um livro ao pai.” is:
o [o] <artd> <dem> DET M S Manuel [Manuel] PROP M S
ofereceu [oferecer] VRB PS 3S IND VFIN um [um] <quant> <arti> DET M S
livro [livro] NN M S o [o] <artd> <dem> DET M S pai [pai] NN M S
Reducing/constructing features. On trying to reduce/construct features we used linguistic information: we applied a Portuguese stop-list (set of non-relevant words such as articles, pronouns, adverbs and prepositions) and PO-LARIS, a lexical database, to generate the lemma for each Portuguese word.
Measuring performance. To measure learner’s performance we analysed precision, recall and the F1 measures [9] (prediction vs. manual classification from the contingency table of the classification). For each performance mea-sure we calculated the micro- and macro-averaging of the top ten categories. Precision is the number of correctly classified documents divided by the number of documents classified into the class. Recall is given by the number of correctly classified documents divided by the number of documents belonging to the class. F1 belongs to a class of functions used in information retrieval, the Fβ-measure; it is the weighted harmonic mean of precision and recall.
Macro-averaging corresponds to the standard way of computing an av-erage: the performance is computed separately for each category and the average is the arithmetic mean over the ten categories. Micro-averaging av-erages the contingency tables of the various categories. For each cell of the table, the arithmetic mean is computed and the performance is computed from this averaged contingency table.
All significance tests were done regarding a 95% confidence level.
5
Previous experiments
In previous work we compared SVM with other machine learning algorithms [5], namely Na¨ıve Bayes and C4.5. While SVM performance was equivalent to C4.5, the learner building time was much shorter (from hours to minutes). In [4] we made a set of preprocessing experiments on the PAGOD dataset: feature reduction/construction, feature subset selection and term weighting experiments. Next subsection describes them.
5.1 Description
Reduce/construct features. On trying to reduce/construct features we made three sets of experiments:
• all words;
• remove from the first experiment a stop-list of words and, • from that set of words, transform each onto its lemma.
Feature subset selection. For the feature subset selection we used a fil-tering approach, keeping the features that received higher scores according to different functions:
• term frequency : the score is the number of times the feature appears in the dataset;
• mutual information: it evaluates the worth of an attribute by measuring the mutual information with respect to the class. Mutual Information, I(C; A), is an Information Theory measure [3] that ranks the informa-tion received to decrease the uncertainty. The uncertainty is quantified through the Entropy, H(X).
• gain ratio: the worth is the gain ratio with respect to the class. Mutual Information is biased through attributes with many possible values. Gain ratio tries to oppose this fact by normalising mutual information by the feature’s entropy.
For each filtering function, we tried different threshold values. This thresh-old is the number of times the feature appears in all documents. We performed experiences for thr1, thr50, thr100, thr200, thr400, thr800, thr1200and thr1600, where thrn means that all words appearing less than n are eliminated. Term weighting. Finally, for the term weighting experiments, we made four different experiments:
• binary representation: each word occurring in the document has weight 1, all others have weight 0 and the resulting vector is normalised to unit length;
• raw term frequencies, T F (wi, dj), with no collection component nor nor-malisation, being T F (wi, dj) the number of times the word wi occurs in document wj;
• T F normalised to unit length;
• TFIDF representation, where T F is multiplied by log(N/DF (wi))2 and normalised to unit length.
2
N is the total number of documents and DF (wi) is the number of documents in which wi occurs.
5.2 Results
We made a total of 288 different experiments. As already mentioned, we measured precision, recall and the F1 measures and calculated the macro-and micro-averaging for the top ten categories.
The best values were obtained for the following experiments:
• lemmatisation with the term frequency scoring function and term fre-quencies normalised to unit length;
• stop-list removal with the mutual information scoring function and the binary representation experiment.
The threshold value thr400 was chosen since it presented a good trade-off between performance and time consumed (to generate the learner) and it was the best or second best result obtained in all experiments.
6
Part-of-speech tag experiments
In order to assess the impact of the POS tags on the SVM performance, we made several trials, retaining only the words belonging to some specific tag(s). We considered the following experiments:
• nouns (nn) • verbs (vrb)
• nouns and verbs (nn + vrb)
• nouns and proper nouns (nn + prop) • nouns and adjectives (nn + adj)
• nouns, adjectives and proper nouns (nn + adj + prop) • nouns, verbs and adjectives (nn + vrb + adj)
• nouns, verbs and proper nouns (nn + vrb + prop)
For each of these experiments and, on the basis of previous results (see Section 5.2), we used the term frequency for scoring words and the term frequency normalised to unit length for weighting them.
Using this setup, we examined the generated models using threshold val-ues of thr1and thr400 and the original words and their lemmas.
To have a base value of comparison we also present the values for the best setting of the previous experiments, base (lemmatisation, the term frequency scoring function with a 400 threshold value and term weighting by term frequencies normalised to unit length).
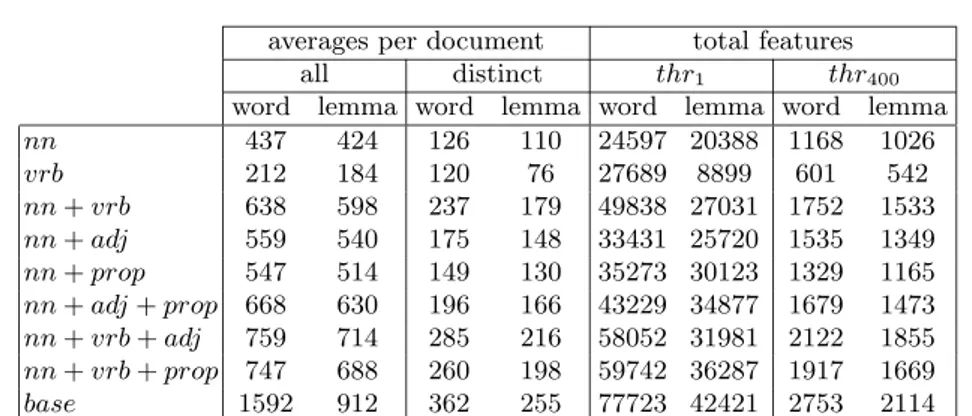
Table 2 shows the averages per document (of all and distinct features) and the number of features (for each threshold value) obtained for each POS-tag experiment with original words (word) and their lemmas (lemma).
averages per document total features all distinct thr1 thr400 word lemma word lemma word lemma word lemma nn 437 424 126 110 24597 20388 1168 1026 vrb 212 184 120 76 27689 8899 601 542 nn+ vrb 638 598 237 179 49838 27031 1752 1533 nn+ adj 559 540 175 148 33431 25720 1535 1349 nn+ prop 547 514 149 130 35273 30123 1329 1165 nn+ adj + prop 668 630 196 166 43229 34877 1679 1473 nn+ vrb + adj 759 714 285 216 58052 31981 2122 1855 nn+ vrb + prop 747 688 260 198 59742 36287 1917 1669 base 1592 912 362 255 77723 42421 2753 2114 Table 2. Averages per document and total of features for each experiment.
micro-averaging macro-averaging
word lemma word lemma
thr1 thr400 thr1 thr400 thr1 thr400 thr1 thr400 nn 0.807 0.887 0.802 0.888 0.739 0.795 0.733 0.791 vrb 0.825 0.926 0.827 0.924 0.699 0.701 0.664 0.703 nn+ vrb 0.831 0.850 0.801 0.858 0.760 0.775 0.742 0.786 nn+ adj 0.809 0.871 0.807 0.880 0.745 0.793 0.744 0.796 nn+ prop 0.812 0.879 0.807 0.879 0.746 0.801 0.744 0.795 nn+ adj + prop 0.820 0.862 0.811 0.866 0.757 0.788 0.751 0.795 nn+ vrb + adj 0.837 0.842 0.815 0.856 0.766 0.776 0.755 0.790 nn+ vrb + prop 0.837 0.845 0.815 0.854 0.768 0.776 0.756 0.786 base – – 0.819 0.836 – – 0.757 0.775
Table 3.Precision for each POS tag experiment.
6.1 Results
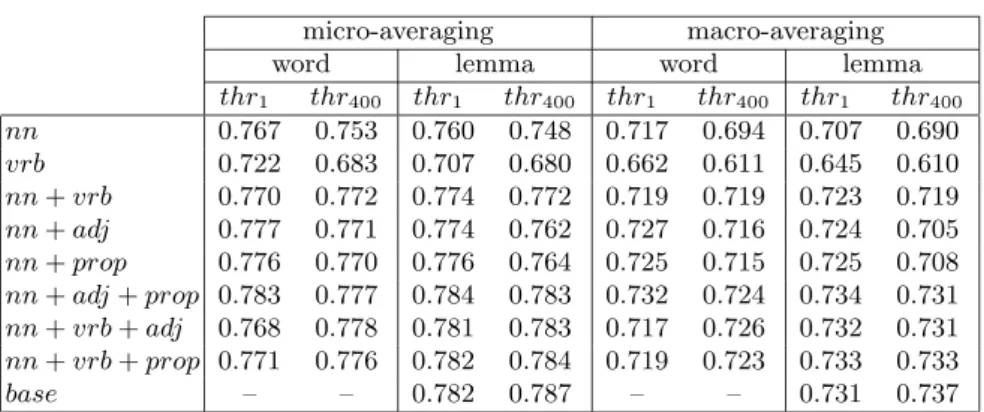
For each experiment, we, once again, analysed precision, recall and F1 mea-sures and calculated the micro- and macro-averaging of the top ten categories. Tables 3, 4 and 5 show, respectively, precision, recall and F1 values.
Considering macro-averaging F1values, the worst significant experiments were vrb (with words or lemmas, for both threshold values) and nn (lemmas with thr1). The micro-averaging F1worst significant values were obtained for the same experiments and also for nn + vrb and nn + adj (lemmas with thr1) and nn (words with thr1).
7
Conclusions and Future Work
From the previous section is possible to conclude that considering just the most frequent words (thr400) learner’s performance is not decreased, but we
micro-averaging macro-averaging
word lemma word lemma
thr1 thr400 thr1 thr400 thr1 thr400 thr1 thr400 nn 0.767 0.753 0.760 0.748 0.717 0.694 0.707 0.690 vrb 0.722 0.683 0.707 0.680 0.662 0.611 0.645 0.610 nn+ vrb 0.770 0.772 0.774 0.772 0.719 0.719 0.723 0.719 nn+ adj 0.777 0.771 0.774 0.762 0.727 0.716 0.724 0.705 nn+ prop 0.776 0.770 0.776 0.764 0.725 0.715 0.725 0.708 nn+ adj + prop 0.783 0.777 0.784 0.783 0.732 0.724 0.734 0.731 nn+ vrb + adj 0.768 0.778 0.781 0.783 0.717 0.726 0.732 0.731 nn+ vrb + prop 0.771 0.776 0.782 0.784 0.719 0.723 0.733 0.733 base – – 0.782 0.787 – – 0.731 0.737
Table 4.Recall for each POS tag experiment.
micro-averaging macro-averaging original w/ lemmas original w/ lemmas thr1 thr400 thr1 thr400 thr1 thr400 thr1 thr400 nn 0.787 0.814 0.781 0.812 0.727 0.728 0.719 0.721 vrb 0.770 0.786 0.762 0.783 0.649 0.642 0.639 0.645 nn+ vrb 0.799 0.809 0.787 0.813 0.737 0.742 0.732 0.747 nn+ adj 0.793 0.818 0.790 0.817 0.735 0.745 0.733 0.739 nn+ prop 0.794 0.821 0.791 0.817 0.735 0.746 0.734 0.738 nn+ adj + prop 0.801 0.817 0.797 0.822 0.743 0.749 0.742 0.754 nn+ vrb + adj 0.801 0.809 0.797 0.818 0.738 0.747 0.743 0.756 nn+ vrb + prop 0.803 0.809 0.798 0.818 0.740 0.745 0.743 0.754 base – – 0.800 0.811 – – 0.743 0.753
Table 5. F1 values for each POS tag experiment.
have a decreased number of features with more than one order of magnitude (see Table 2), which implies faster model generation.
We can also conclude that verbs alone don’t have enough information to produce good learners. This was expected since, as already mentioned, a Portuguese regular verb has 66 different modes. Nonetheless, this conclusion is true even when using words’ lemmas.
On the other hand, using just the words of specific POS tags we obtain learners with equivalent performance of the ones with all words, with a re-duced number of features. From all the best experiments, the one with less features is nn with lemma and thr400, with 1026 features, and the one with more is base with lemma and thr1 with 42421 features.
As future work, and in order confirm these results, we to intend make these same experiments with other datasets (newspaper news datasets: P´ublico written in European Portuguese and Folha de S. Paulo, written in Brazilian Portuguese).
On the other hand, and aiming to develop better classifiers, we intend to address the document representation problem by trying more powerful rep-resentations than the bag-of-words that allow us to use word order and syn-tactical and/or semantical information in the representation of documents. To achieve this goal we plan to use other kind of kernel such as the string kernel (see, for example, [11]).
References
1. E. Bick. The Parsing System ”Palavras”. Automatic Grammatical Analysis of Portuguese in a Constraint Grammar Framework. Aarhus University Press, 2000.
2. Cortes and Vapnik. Support-vector networks. Machine Learning, 20(3), 1995. 3. Thomas M. Cover and Joy A. Thomas. Elements of Information Theory. Wiley
Series in Telecomunication. John Wiley and Sons, Inc, New York, 1991. 4. T. Gon¸calves and P. Quaresma. Evaluating preprocessing techniques in a text
classification problem. (submitted to an international conference).
5. T. Gon¸calves and P. Quaresma. A preliminary approach to the multilabel classification problem of Portuguese juridical documents. In F. Moura-Pires and S. Abreu, editors, 11th Portuguese Conference on Artificial Intelligence, EPIA 2003, LNAI 2902, pages 435–444, ´Evora, Portugal, December 2003. Springer-Verlag.
6. T. Joachims. Learning to Classify Text Using Support Vector Machines. Kluwer academic Publishers, 2002.
7. D. Mladeni´c and M. Grobelnik. Feature selection for unbalanced class distribu-tion and na¨ıve bayes. In Proceedings of ICML-99, 16th Internadistribu-tional Conference on Machine Learning, pages 258–267, 1999.
8. P. Quaresma and I. Rodrigues. PGR: Portuguese Attorney General’s Office decisions on the web. In Bartenstein, Geske, Hannebauer, and Yoshie, editors, Web-Knowledge Management and Decision Support, LNCS/LNAI 2543, pages 51–61. Springer-Verlag, 2003.
9. G. Salton and M. McGill. Introduction to Modern Information Retrieval. McGraw-Hill, 1983.
10. H. Sch¨utze, D. Hull, and J. Pedersen. A comparison of classifiers and doc-ument representations for the routing problem. In Proceedings of SIGIR-95, 18th International Conference on Research and Developement in Information Retrieval, pages 229–237, Seattle, WA, 1995.
11. J. Shawe-Taylor and N. Cristianini. Kernel Methods for Pattern Analysis. Cam-bridge University Press, 2004.
12. C.F. Silva, R. Vieira, F.S. Osorio, and P. Quaresma. Mining linguistically interpreted texts. In 5th International Workshop on Linguistically Interpreted Corpora, Geneva, Switzerland, August 2004.
13. V.M. Tikhonov and V.Y. Arsenin. Solution of Ill-Posed Problems. Winston, Washington DC, 1977.
14. R. Tong and L.A. Appelbaum. Machine learning for knowledge-based document routing. In Harman, editor, Proceedings of 2nd Text Retrieval Conference, 1994. 15. V. Vapnik. Statistical learning theory. Wiley, NY, 1998.
16. I. Witten and E. Frank. Data Mining: Practical machine learning tools with Java implementations. Morgan Kaufmann, 1999.