spectroscopy, electron energy loss spectroscopy, and ab initio calculations
F. Ferreira da Silva, E. Lange, P. Limão-Vieira, N. C. Jones, S. V. Hoffmann, M.-J. Hubin-Franskin, J. Delwiche, M. J. Brunger, R. F. C. Neves, M. C. A. Lopes, E. M. de Oliveira, R. F. da Costa, M. T. do N. Varella, M. H. F. Bettega, F. Blanco, G. García, M. A. P. Lima, and D. B. Jones
Citation: The Journal of Chemical Physics 143, 144308 (2015); doi: 10.1063/1.4932603 View online: https://doi.org/10.1063/1.4932603
View Table of Contents: http://aip.scitation.org/toc/jcp/143/14 Published by the American Institute of Physics
Articles you may be interested in
Integral elastic, electronic-state, ionization, and total cross sections for electron scattering with furfural The Journal of Chemical Physics 144, 144303 (2016); 10.1063/1.4945562
Theoretical and experimental differential cross sections for electron impact excitation of the electronic bands of furfural
The Journal of Chemical Physics 144, 124309 (2016); 10.1063/1.4944615
The electron-furfural scattering dynamics for 63 energetically open electronic states The Journal of Chemical Physics 144, 124310 (2016); 10.1063/1.4944616
Excitation of vibrational quanta in furfural by intermediate-energy electrons The Journal of Chemical Physics 143, 224304 (2015); 10.1063/1.4936631
An experimental and theoretical investigation into the electronically excited states of para-benzoquinone The Journal of Chemical Physics 146, 184303 (2017); 10.1063/1.4982940
Total cross section of furfural by electron impact: Experiment and theory The Journal of Chemical Physics 147, 054301 (2017); 10.1063/1.4996462
THE JOURNAL OF CHEMICAL PHYSICS 143, 144308 (2015)
Electronic excitation of furfural as probed by high-resolution vacuum
ultraviolet spectroscopy, electron energy loss spectroscopy,
and ab initio calculations
F. Ferreira da Silva,1E. Lange,1P. Limão-Vieira,1,2,a)N. C. Jones,3S. V. Hoffmann,3
M.-J. Hubin-Franskin,4J. Delwiche,4M. J. Brunger,2,5,a)R. F. C. Neves,2,6,7M. C. A. Lopes,6
E. M. de Oliveira,8R. F. da Costa,8,9M. T. do N. Varella,10M. H. F. Bettega,11F. Blanco,12
G. García,13M. A. P. Lima,8,a)and D. B. Jones2
1Laboratório de Colisões Atómicas e Moleculares, CEFITEC, Departamento de Física, Faculdade de Ciências e Tecnologia, Universidade Nova de Lisboa, 2829-516 Caparica, Portugal
2School of Chemical and Physical Sciences, Flinders University, GPO Box 2100, Adelaide, South Australia 5001, Australia
3ISA, Department of Physics and Astronomy, Aarhus University, Ny Munkegade, DK-8000 Århus C, Denmark 4Départment de Chimie, Institut de Chimie-Bât. B6C, Université de Liège, B-4000 Liège 1, Belgium
5Institute of Mathematical Sciences, University of Malaya, 50603 Kuala Lumpur, Malaysia 6Departamento de Física, Universidade Federal de Juíz de Fora, Juíz de Fora, MG, Brazil 7Instituto Federal do Sul de Minas Gerais, Campus Poços de Caldas, Minas Gerais, Brazil
8Instituto de Física “Gleb Wataghin,” Universidade Estadual de Campinas, 13083-859 Campinas, São Paulo, Brazil
9Centro de Ciências Naturais e Humanas, Universidade Federal do ABC, 09210-580 Santo André, São Paulo, Brazil
10Instituto de Física, Universidade de São Paulo, CP 66318, 05315-970 São Paulo, Brazil
11Departamento de Física, Universidade Federal do Paraná, CP 19044, Curitiba, Paraná 81531-990, Brazil 12Departamento de Física Atómica, Molecular y Nuclear, Universidad Complutense de Madrid,
Madrid E-28040, Spain
13Instituto de Fisica Fundamental, CSIC, Serrano 113-bis, 28006 Madrid, Spain
(Received 23 July 2015; accepted 25 September 2015; published online 13 October 2015)
The electronic spectroscopy of isolated furfural (2-furaldehyde) in the gas phase has been investigated using high-resolution photoabsorption spectroscopy in the 3.5–10.8 eV energy-range, with absolute cross section measurements derived. Electron energy loss spectra are also measured over a range of kinematical conditions. Those energy loss spectra are used to derive differential cross sections and in turn generalised oscillator strengths. These experiments are supported by ab initio calculations in order to assign the excited states of the neutral molecule. The good agreement between the theoretical results and the measurements allows us to provide the first quantitative assignment of the electronic state spectroscopy of furfural over an extended energy range. C 2015 AIP Publishing LLC.[http://dx.doi.org/10.1063/1.4932603]
I. INTRODUCTION
Furfural (2-furaldehyde), C5H4O2, has been used
exten-sively in the agrochemical, petroleum, plastics, and pharma-ceutical industries.1Recent investigations have also identified
furfural as a viable plant-derived biochemical alternative to petrochemicals, as a part of sustainable bio-refineries aimed at reducing pollution.2–5 With no direct synthetic methods
of production,1 furfural is solely produced through the
thermochemical pre-treatment of biomass. While it is desirable to increase the conversion efficiency of hemicellulose into furfural, from the view point of furfural as a commod-ity chemical,1 its production within some bio-refineries is undesirable, as it can inhibit enzymes responsible for up-conversion of pre-treated biomass.6,7Hybrid interdisciplinary strategies represent a path forward in realising novel methods
a)Electronic addresses: plimaovieira@fct.unl.pt; michael.brunger@flinders.
edu.au; and maplima@ifi.unicamp.br.
in biomass conversion.8Atmospheric pressure plasmas9,10or
electron-beam irradiation (EBI)11,12 has been identified as
alternative methods for pre-treating biomass. Understanding electron-driven and photochemical processes and reaction rates, with key structural analogues of biomass, is important in understanding and potentially controlling the mechanisms that occur in plasma or EBI biomass pre-treatments with a view to promoting or eliminating particular chemical pathways.
A full understanding of the quantum chemical structure and spectroscopy of compounds produced in bio-refineries, such as furfural, is therefore essential in evaluating their role as biofuels. From a more fundamental view, a reliable quantum chemical picture is a precursor for deriving the necessary electron scattering data, and reaction rates and mechanisms, required for understanding and modelling physico-chemical processes. The importance in establishing a realistic quantum chemical picture as a basis for electron scattering calculations was highlighted in recent papers on electron scattering from phenol.13–15 In particular, that body of work clarified the
important role that multichannel coupling to excited electronic states plays in accurately describing scattering processes for complex organic targets. Establishing a detailed quantum chemical picture for furfural is therefore paramount in beginning to formulate the comprehensive electron scattering data set required to model plasma- or electron-interactions with furfural as a biomass analogue.
To begin to address these data needs, furfural has been recently studied by (e,2e) dynamical spectroscopy and He(I) photoelectron methods.16 Although several old experimental
studies17–20of the electronic spectrum of furfural have been
reported, our knowledge of the vacuum ultraviolet (VUV) electronic state spectroscopy of furfural remains poorly quantified in a wide wavelength (λ) region. As far as we are aware, experimental information on such chemical data is mainly restricted to λ ≥ 222 nm (E ≤ 5.58 eV),21and there
is limited other electron scattering data for this target. Related to furfural, we have also performed photon- or electron-impact studies on the base furan structure,22 its methyl derivative,23 2-vinyl furan,24 2-furanomethanol (furfuryl alcohol),25 aza-furans26 and also isoxazole,27 the latter related to furan by the replacement of a CH group by a pyridine-like N atom at position 2 in the ring.
In this comprehensive study, we have performed VUV spectroscopy to identify several new features in the absorption spectrum, with special attention having been devoted to the intermediate to high energy absorption bands and to also provide reliable absolute photoabsorption cross sections. Electron energy loss spectroscopy is undertaken to clarify potential low-lying triplet states and to derive generalised oscillator strengths (GOSs). The experiments are supported by ab initio calculations of the vertical excitation energies and oscillator strengths for the neutral electronic transitions. The outline of our paper is as follows. In Section II, we provide a brief summary of the structure and properties of furfural, while in Section III, we present a brief discussion of the experimental methods. Subsequently in SectionIV, the computational details are described. SectionVis devoted to presenting and discussing the results of this study, with a comparison to other absolute photoabsorption cross sections being made where possible. Finally, some conclusions that can be drawn from this investigation are given in SectionVI.
II. BRIEF SUMMARY OF THE STRUCTURE AND PROPERTIES OF FURFURAL
The molecular structure and conformations of furfural in its ground electronic state have been previously studied in the gas-phase using microwave spectroscopy, with the trans conformer observed to be 286 cm−1 (0.035 eV) more
stable than the cis conformer.28 This value is in reasonable
agreement with that of 250 ± 40 cm−1(0.031 ± 0.005 eV) as
reported by Zwarich and Rabinowitz,21and with the relative
population weight between trans to cis of ∼3:1 determined by Miller et al.29 using the torsional frequencies in the far infrared spectrum. Vibrational analysis of the two conformers of furfural has been carried out on the basis of their IR and Raman spectra by Rogojerov et al.,30whereas Gandini and co-workers20,31 have reported on the photochemistry of furfural
in the (π∗ ← n) and the lowest (π∗← π) absorption bands. Finally, we note that the adiabatic and vertical energies of the lowest ionic states of furfural (ground, first-, and second-excited) have been determined by Klapstein et al.32 using photoelectron spectroscopy (PES).
Furfural possesses Cssymmetry in its electronic ground
state for both conformers. The symmetry species available to a Csmolecule are A′and A′′, with the electronic configuration
of the outermost valence orbitals of the ˜X 1A′ground state
calculated to be . . .(19a′ )2 (20a′ )2 (2a′′ )2 (3a′′ )2 (21a′ )2 (4a′′ )2.
Examination of the ground state molecular orbitals shows that the highest occupied molecular orbital (HOMO), the 4a′′
orbital, is composed of a 2p contribution from the “out-of-plane” carbonyl group oxygen atom and its coupling to the 5-member ring. This gives the 4a′′orbital a π character. The second highest occupied molecular orbital (21a′, HOMO-1) is dominated by contributions from the in-plane carbonyl group oxygen 2p orbital. This orbital has typically been described as a non-bonding (nO) orbital, although it does σ-couple to the
carbon frame. The third highest occupied molecular orbital (3a′′, HOMO-2) also displays a strong π character, arising from the ring oxygen having an out-of-plane (2p) interaction with the out-of-plane π character of the ring. Further details of these orbital characters are discussed in Ref. 16. The lowest unoccupied molecular orbital (LUMO) is mainly of anti-bonding π∗character.
The adiabatic/vertical ionisation energies (AIE/VIE), which are needed to calculate the quantum defects associated with transitions to Rydberg orbitals, have been experimentally determined in our recent study,16using PES, to be 9.223 eV
(4a′′ )−1, 9.956 eV (21a′ )−1, and 10.678 eV (3a′′ )−1, respectively
(see also Ref.32).
III. EXPERIMENTAL DETAILS A. Furfural sample
The liquid sample used in the VUV and electron energy loss measurements was purchased from Sigma-Aldrich, with a stated purity of 99%. In all experiments, the sample was degassed through repeated freeze–pump–thaw cycles.
B. VUV photoabsorption
The high-resolution VUV photoabsorption spectrum (Fig.1) was measured using the new AU-UV beam line of the ASTRID2 storage ring at Aarhus University, Denmark. The apparatus used for the measurement of photoabsorption spectra has also undergone several alterations, since that which was originally described in Eden et al.33These changes have
recently been described in Ref. 34, to where the reader is referred for more detail. Briefly, the gas cell has a path length of 15.5 cm and is fitted with a heated 1 Torr baratron capacitance manometer (Setra model 774). The light enters the cell through a LiF window and exits through a MgF2 window, the latter setting the lower limit of the detectable light to 115 nm. A small gap between the photo-multiplier tube (PMT) detector and the absorption cell is evacuated
144308-3 Ferreira da Silva et al. J. Chem. Phys. 143, 144308 (2015)
FIG. 1. High resolution VUV photoabsorption spectrum of furfural (2-furaldehyde), C5H4O2, in the 3.5–10.8 eV photon energy range.
using a scroll pump for measurements below 200 nm. Above 200 nm air is allowed into this gap to let oxygen absorb higher orders of light (at half the chosen wavelength), which may be passing through the cell. In this way, photoabsorption measurements can be performed with spectrally pure radiation from 115 nm to 340 nm, ensuring artefact-free spectra. The synchrotron beam ring current was monitored throughout the collection of each spectrum and background scans were recorded with the cell evacuated. Absolute photoabsorption cross sections are then obtained using the Beer-Lambert attenuation law, It = I0exp(−nσx), where It is the radiation
intensity transmitted through the gas sample, I0is that through
the evacuated cell, n is the molecular number density of the sample gas, σ is the absolute photoabsorption cross section, and x is the absorption path length (15.5 cm). The accuracy of the cross section is estimated to be ±5%. Only when absorption by the sample is very weak (I0≈ It), does the
error significantly increase as a percentage of the measured cross section.
To ensure that the photon data are free of any saturation effects, the absorption cross sections were measured over the pressure range 0.03–1.29 mbar, with typical attenuations of less than 30%. Finally, we note that the resolution of the instrument was 0.08 nm.
C. Electron energy loss spectroscopy
High-resolution electron energy loss spectra (EELS) [∆E ∼ 80 meV (FWHM)] (see Figs. 2(a) and 2(b)) were obtained on an experimental apparatus that is housed at Flinders University. The full details of this equipment are described in Brunger and Teubner.35Briefly, a monochromated
electron beam is incident on an effusive beam of furfural. The furfural vapour from a liquid reservoir (T ∼ 40 ◦C) passes through a gas handling system (T ∼ 50 ◦C), where it is introduced into the heated scattering chamber (T ∼ 50 ◦C) through a 0.7 mm inner diameter needle. Here, the gas flow is controlled through a variable leak valve, while maintaining a chamber pressure of less than 2 × 10⁻⁵ Torr. This was selected to both limit multiple scattering events and to ensure a reasonable count rate for the experiment. An
FIG. 2. Electron energy loss spectra of furfural in the 2.5–9.5 eV energy loss range at (a) 20 eV electron impact energy and a 90◦scattering angle; (b) 30 eV electron impact energy and a 20◦scattering angle; and (c) 250 eV impact energy and a 4◦scattering angle. See text for further details.
electron analyser/detector system is mounted on a rotating table. Electrons that scatter from the furfural vapour into the acceptance cone of the analyser, at a specific angle made with reference to the incident beam direction, are energy analysed. Those electrons having the correct energy loss value pass through the analyser where they are then detected using a channel electron multiplier. In this work, we obtain energy loss spectra at fixed scattering angles of 20◦ and 90◦, by using a
multi-channel scaler to record the number of electrons detected as we continuously ramp over a range of energy loss values. Here, the energy loss is determined through,
ELoss= E0− Es, (1)
where E0and Esare, respectively, the incident and scattered
electron energies.
Electron energy loss spectra of lower resolution [∆E ∼ 1.1 eV (FWHM)] (a typical spectrum is shown in Fig.
2(c)) were also recorded on a different electron scattering spectrometer that was designed for measuring triple di ffer-ential cross sections for electron impact ionization.36 Here, the electron energy loss spectra are obtained at discrete angles in the 4◦-50◦ range, using an un-monochromated electron beam at a higher impact energy of E0= 250 eV.
This energy was chosen so that any possible triplet-state contributions to those measured energy-loss spectra were minimised. These spectra were further utilised to determine
absolute inelastic differential cross sections (DCSs) through normalising the measured inelastic to elastic scattering ratio to the elastic scattering differential cross section calculated using the Independent Atom Model–Screening Corrected Additivity Rule (IAM-SCAR) approach.37,38 Here, we note that in this implementation of the IAM-SCAR calculation we do not include a correction factor to preserve the optical theorem. We further note that a full discussion of elastic electron scattering from furfural is beyond the scope of this paper, rather it will be given elsewhere.39 Suffice it to say that the
IAM-SCAR theory is known to reliably reproduce elastic electron scattering cross sections from similar targets at higher impact energies (such as 250 eV).40–42 The differential scattering
cross sections for excitation processes are then converted into a GOS, using the standard formula.43The properties of
the GOS for dipole-allowed excitations43,44allow the fitting
of the GOS with the analytic functional form proposed by Vriens.45 This functional form can be extrapolated to the optical limit, K2→ 0 a.u., to derive an experimental optical oscillator strength (OOS) for the transition. Here, K is the momentum transferred in the collision. Note that the currently employed incident electron energy (E0∼ 250 eV)
is lower than that typically required to reach the optical limit.46 However, a GOS-fitting and extrapolation approach
has provided reasonable experimental OOS (to within the stated uncertainties) for a number of molecules in the recent past15,47–49to energies as low as 100 eV. It is therefore useful in
checking the consistency of data compiled across experiments, and scattering and quantum chemical calculations. In the absence of detailed information regarding the OOS of furfural, the implementation of our GOS approach is expected to provide a reasonable estimate of the OOS, although studies conducted at higher impact electron energies are desirable to confirm that view.
IV. COMPUTATIONAL METHODS
To assist in the interpretation of the excited state spectroscopy, we have performed a range of quantum chemical calculations. To begin, we carried out independent elec-tronic structure calculations using the package GAMESS50
to estimate the energy difference between the two furfural conformers. These calculations optimized the furfural geom-etry, with the conformer energies being obtained from the total energy calculation including a zero point energy correction. Using DFT/B3LYP/aug-cc-pVDZ, we obtained 0.0287 eV. With MP2/aug-cc-pVDZ, we obtained 0.0258 eV. The third calculation considered the geometry optimization and zero point energy at the HF/MP2/aug-cc-pVDZ level, with the total energy being calculated at the CCSD(T) /aug-cc-pVDZ level to obtain 0.0236 eV (using the scale fre-quency factor equal to 0.959, we obtained 0.0265 eV). The values obtained for this energy difference agree with previous calculations51 and are in reasonable accord with
the experimental values21,28 and experimentally observed
conformer populations.29 The optimized geometries of both
the trans and cis conformers obtained at the B3LYP /aug-cc-pVDZ level were therefore deemed suitable to use for further computations. With a view to performing extensive
electron scattering calculations within a minimal orbital basis single configuration interaction (MOB-SCI) framework, excited state calculations were performed at the full-single configuration interaction (FSCI) level. Here, a minimal basis set is required for the electron scattering calculations to become tractable.
To assess the reliability and limitations of this single-configuration interaction calculation, further time-dependent density functional theory (TD-DFT) calculations52,53 were
performed within the Gaussian 09 package.54 Here, we
perform the TD-DFT calculations using the B3LYP functional and the aug-cc-pVDZ basis set. Note that this approach of combining FSCI and TDDFT calculations previously enabled us to provide a good quantum chemical picture of the excited electronic states of phenol,15whilst understanding the
limitation of the calculations obtained at the FSCI level. As the theoretical calculations are performed within a fixed nuclei approximation and cannot account for vibrational broadening of the experimental measurement, the present calculations are only expected to provide a qualitative description of the behaviour observed experimentally.
V. ELECTRONIC STATE SPECTROSCOPY: RESULTS AND DISCUSSION
The absolute high resolution VUV photoabsorption spec-trum of furfural (2-furaldehyde) measured at room temper-ature is shown in Fig. 1 from 3.5 to 10.8 eV. The fine structure observed throughout the spectrum is better resolved than in previous work, enabling several Rydberg series to be assigned for the first time. It is noteworthy that the normal vibrational description may lead to some Fermi resonances, both for the valence and Rydberg excitations, making assignments particularly difficult. Our lower energy resolution electron energy loss spectra obtained under different kinematical conditions are presented in Fig.2. These spectra are interpreted through our FSCI and TDDFT calculations which are summarised in TableI. In both the photoabsorption and energy loss spectra, the main observed absorption bands can be classified either as members of Rydberg series or as molecular valence transitions of the type (π∗← nO) and
(π∗← π).21 The assigned character of these transitions is further supported by our own calculations, as summarised in TableI. It is interesting to note that the first singlet excited state at both the TDDFT and FSCI levels in band I is dominated by a 21a′ (HOMO-1) to 5a′′ (LUMO) excitation process,
as opposed to the 4a′′ (HOMO) to 5a′′ (LUMO) character
excitation observed for the singlet transition in band II. This suggests that electron correlation plays an important role in describing excitation processes of furfural and resultantly, the excitation transition ordering. Here, we note that the correct ordering of the 21a′ (HOMO-1) and 4a′′ (HOMO)
has been established through photoelectron spectroscopy and is supported by calculations.16,32Vibronic coupling also plays
an important role in the observed structure as per TablesII–V, especially in the low energy absorption band. As far as the Rydberg states are concerned, the authors are not aware of any previous results for furfural, as considered here, to have been reported in the literature. The first Rydberg members (n= 3)
144308-5 Ferr eir a da Silv a e t al. J. Chem. Ph ys. 143 ,144308 (2015)
TABLE I. Assignment of the prominent theoretically calculated singlet excited states ( f0> 0.010 for bands III-VI) to the experimentally observed features in the photoabsorption and electron energy loss spectra of furfural (2-furaldehyde), C5H4O2. For experimental band assignments, please refer to the electron energy loss spectra in Fig.2. Also presented are the vertical excitation energies, oscillator strengths, and dominant excitation processes. Note that as the theoretical calculations utilise different orbitals, the dominant excitation processes for transitions may differ between each calculation. Triplet states are only shown for bands I and II. See text for more detail.
trans-furfural TD-DFT/aug-cc-pVDZ cis-furfural TD-DFT/aug-cc-pVDZ trans-furfural FSCI cis-furfural FSCI Expt. band Energy (eV) System Energy (eV) f0 Dominant excitation System Energy (eV) f0 Dominant excitation System Energy (eV) f0 Dominant excitation System Energy
(eV) f0 Dominant excitation
I 2.7-4.4 3A′ 2.82 (4a′′ )−1(5a′′ ) 3A′ 2.90 (4a′′ )−1(5a′′ ) 3A′ 2.60 (4a′′ )−1(5a′′ ) 3A′ 2.69 (4a′′ )−1(5a′′ ) 3A′′ 3.11 (21a′ )−1(5a′′ ) 3A′′ 3.11 (21a′ )−1(5a′′ ) 3A′′ 4.03 (21a′ )−1(7a′′ ) 3A′′ 4.06 (21a′ )−1(7a′′ ) 1A′′ 3.65 0.000 (21a′ )−1(5a′′ ) 1A′′ 3.65 0.000 (21a′ )−1(5a′′ ) 1A′′ 4.72 0.001 (21a′ )−1(7a′′ ) 1A′′ 4.76 0.000 (21a′ )−1(7a′′ ) II 4.4-5.4 3A′ 4.53 (3a′′ )−1(5a′′ ) 3A′ 4.56 (3a′′ )−1(5a′′ ) 3A′ 4.46 (4a′′ )−1(6a′′ ) 3A′ 4.52 (3a′′ )−1(5a′′ ) 1A′ 4.79 0.352 (4a′′ )−1(5a′′ ) 1A′ 4.90 0.351 (4a′′ )−1(5a′′ ) 1A′ 5.46 0.477 (4a′′ )−1(5a′′ ) 1A′ 5.58 0.479 (4a′′ )−1(5a′′ ) 3A′ 5.01 (4a′′ )−1(6a′′ ) 3A′ 5.18 (4a′′ )−1(6a′′ ) 3A′ 5.18 (2a′′ )−1(7a′′ ) 3A′ 5.20 (2a′′ )−1(7a′′ ) III 5.4-6.4 1A′ 5.63 0.017 (3a′′ )−1(5a′′ ) 1A′ 5.72 0.044 (3a′′ )−1(5a′′ ) 1A′′ 7.28 0.034 (4a′′ )−1(na′ ) 1A′′ 7.18 0.049 (4a′′ )−1(na′ ) 1A′ 6.32 0.010 (21a′ )−1(22a′ ) 1A′ 7.34 0.011 (3a′′ )−1(5a′′ ) 1A′ 7.43 0.034 (3a′′ )−1(5a′′ ) 1A′′ 6.40 0.017 (4a′′ )−1(23a′ ) IV 6.4-7.4 1A′ 6.69 0.085 (4a′′ )−1(6a′′ ) 1A′ 6.72 0.012 (21a′ )−1(23a′ ) 1A′ 7.86 0.263 (4a′′ )−1(6a′′ ) 1A′ 8.05 0.024 (4a′′ )−1(7a′′ ) 1A′ 6.84 0.028 (21a′ )−1(23a′ ) 1A′ 6.95 0.143 (4a′′ )−1(6a′′ ) 1A′ 8.09 0.034 (4a′′ )−1(8a′′ ) 1A′ 8.20 0.586 (4a′′ )−1(6a′′ ) 1A′ 7.02 0.018 (21a′ )−1(24a′ ) 1A′ 7.23 0.018 (4a′′ )−1(7a′′ ) 1A′′ 8.21 0.012 (4a′′ )−1(na′ ) 1A′′ 7.36 0.020 (3a′′ )−1(22a′ ) 1A′′ 7.33 0.020 (3a′′ )−1(22a′ ) V 7.4-8.2 1A′ 7.47 0.018 (21a′ )−1(25a′ ) 1A′ 7.53 0.024 (21a′ )−1(26a′ ) 1A′′ 8.70 0.039 (3a′′ )−1(na′ ) 1A′′ 8.56 0.034 (4a′′ )−1(na′ ) 1A′ 7.66 0.026 (21a′ )−1(26a′ ) 1A′ 8.07 0.029 (21a′ )−1(27a′ ) 1A′ 9.03 0.011 (21a′′ )−1(na′ ) 1A′ 8.92 0.019 (21a′ )−1(na′ ) 1A′ 7.81 0.042 1A′ 8.13 0.230 1A′ 8.01 0.050 (21a′ )−1(27a′ ) 1A′ 8.09 0.106 VI 8.2-9.0 1A′ 8.60 0.017 (4a′′ )−1(9a′′ ) 1A′ 8.38 0.016 1A′ 9.34 0.106 (4a′′ )−1(na′′ ) 1A′ 9.04 0.106 (4a′′ )−1(6a′′ ) 1A′ 8.66 0.012 (3a′′ )−1(7a′′ ) 1A′ 8.54 0.026 (3a′′ )−1(7a′′ ) 1A′′ 9.51 0.014 (3a′′ )−1(na′ ) 1A′′ 9.52 0.014 (3a′′ )−1(na′ ) 1A′ 8.76 0.015 (21a′ )−1(28a′ ) 1A′ 8.63 0.057 (21a′ )−1(28a′ ) 1A′ 8.70 0.052 (4a′′ )−1(9a′′ )
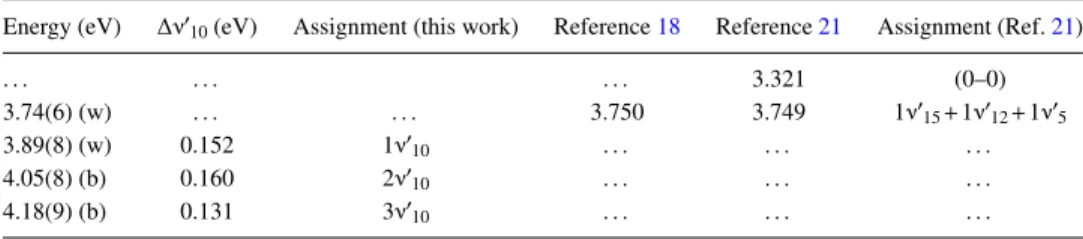
TABLE II. Proposed vibrational assignments in the 3.5–4.3 eV absorption band of furfural (2-furaldehyde), C5H4O2. (w)—weak feature. (b)—broad structure (the last decimal of the energy value is given in brackets for these less-resolved features).
Energy (eV) ∆ν′10(eV) Assignment (this work) Reference18 Reference21 Assignment (Ref.21)
. . . 3.321 (0–0) 3.74(6) (w) . . . 3.750 3.749 1ν′ 15+1ν′12+1ν′5 3.89(8) (w) 0.152 1ν′10 . . . . 4.05(8) (b) 0.160 2ν′ 10 . . . . 4.18(9) (b) 0.131 3ν′10 . . . .
for the (ns, np, and nd ← 4a′′) states converging to the ionic
electronic ground state are reported with consistent δ values (Table VI), but they are weak and higher members of these series (n > 6) could not be proposed. Vibronic coupling is mainly due to the excitation of ν10′(a′), ν16/17′(a′), and ν19′(a′)
quanta, corresponding to the ring stretching, ring/C—C==O deformation, and ring-CHO deformation modes, respectively. Several other Rydberg states converging to the ionic electronic first (21a′
)−1 and second
(3a′′
)−1 excited states
of furfural have been obtained, with their origins also presented in TableVI. In addition, also for the first time, the photoabsorption spectrum was measured above 6.2 eV, thus extending the data over the lowest ionic electronic ground (4a′′ )−1, first (21a′ )−1, and second (3a′′ )−1 excited states of furfural.
A. Valence and vibronic excitation in the range 3.5–4.3 eV (band I)
Previous UV absorption studies have reported the lowest-lying excited state of furfural at ∼3.88 eV and assigned it to the (π∗← n
O) ( ˜A 1A′′← ˜X 1A′) transition,21,55 whereas
Santhamma18reported just a weak absorption band comprised of eleven diffuse structures with no attempt at assignment. We also note a photoemission study from Gandini et al.20 who reported the maximum at ∼330 nm (3.75 eV). In the present high resolution VUV spectrum, we observe a local maximum cross section of 0.13 Mb at 3.89(8) eV (Fig. 1), which is also consistent with the recent lower resolution study.55 The
origin of the band has been identified at 3.321 eV21 from
ultraviolet absorption of furfural vapour (TableII). It should be noted that in the present measurements, the weak bands below ∼3.74 eV are lost in the background noise, so that the (0–0) transition is not observed in the present work. The present high-resolution spectrum reveals that the fine structure is primarily attributed to excitation of the ν′10(a′) ring stretching
mode21(see TableIIfor the proposed assignments). The mean vibrational excitation energy of the mode is 0.148 eV from the present analysis, 0.006 eV lower than its value in the electronic ground state for trans furfural and 0.010 eV for the cis-conformer.30
B. Valence and vibronic excitation in the range 4.3–5.3 eV (band II)
The valence excitation band in this energy range (Figs.1
and 3) has been assigned to the (π∗← π)
( ˜B 1A′← ˜X 1A′
)
transition in agreement with Refs. 20 and 21. The (0–0) transition has been identified at 4.602 eV by Santhamma,18
which is in very good agreement with the present value (see Table III). Gandini et al.20 have reported the maximum at
∼257 nm (4.82 eV). In the present high resolution VUV spectrum, we observe a local maximum cross section of 66.5 Mb at 4.831 eV (Fig.1), in good agreement with the value of 4.835 eV from Zwarich and Rabinowitz.21Gandini et al.,20 previously reported the absence of emission in the(π∗← π
) transition, which was rationalised on the basis of a fast singlet to triplet conversion involving a vibrationally excited ground-state path. The present calculations suggest that two triplet states can be found in this energy region to support this argument. Such an assertion is in agreement with the rich fine structure observed, with the clear contribution of hot-bands, from the careful analysis performed by Santhamma,18 and
later explored by Zwarich and Rabinowitz.21It is interesting
to note that Purvis in 191019reported more than 30 bands in
the wavelength region 253–272 nm (4.90–4.56 eV).
The origin of the band is found at 4.627 eV (see TableIII), in good agreement with the 4.626 eV value from Zwarich and Rabinowitz.21 The excitation in this energy region is mainly due to ν9′(a′), ν15′(a′), ν16/17′(a′), ν18′(a′), and ν19′(a′)
quanta, corresponding to ring stretching, ring deformation, ring/C—C==O deformation, C—C==O deformation and ring CHO stretching, and ring-CHO deformation modes, respec-tively.21 There are however several features in TableIIIthat
still remain unassigned.
FIG. 3. High resolution VUV photoabsorption spectrum of furfural (2-furaldehyde), C5H4O2, in the 4.3–5.3 eV photon energy range. For a detailed assignment of the features, see TableIII.
144308-7 Ferreira da Silva et al. J. Chem. Phys. 143, 144308 (2015) TABLE III. Proposed vibrational assignments in the 4.3–5.3 eV absorption band of furfural (2-furaldehyde),
C5H4O2. (s)—shoulder structure. (b)—broad structure. (w)—weak feature (the last decimal of the energy value is given in brackets for these less-resolved features). ?—feature remains unassigned.
Energy (eV) Assignment ∆E (eV) Energy (eV) Assignment ∆E (eV) 4.394 16/1702−190 2 0.025 4.752 6ν ′ 19/2ν′19+1ν′16/17 0.018 4.419 16/170 2−19 0 1 0.023 4.761 1ν ′ 9+1ν′15 0.020 4.437 901−190 1 0.024 4.778 7ν ′ 19 0.026 4.442 16/170 2 0.093 4.785 1ν ′ 9 0.158 4.461 901 0.166 4.79(9) (s) 2ν′16/17 0.086 4.472 150 1−19 0 2 0.023 4.808 1ν ′ 19+1ν′9 0.023 4.485 1201 0.142 4.81(9) (s) 1ν′19+2ν′16/17 0.020 4.495 150 1−19 0 1 0.020 4.831 2ν ′ 19+1ν′9 0.023 4.515 1501 0.112 4.836 2ν′19+2ν′16/17 0.017 4.529 190 4 0.022 4.853 2ν ′ 15/3ν′19+1ν′9 0.112/0.022 4.535 16/1701 0.092 4.863 3ν′19+2ν′16/17 0.027 4.551 190 3 0.026 4.875 1ν ′ 9+2ν′15 0.022 4.560 ? . . . 4.88(6) (s) 3ν′16/17 0.087 4.571 180 1 0.056 4.897 2ν ′ 9+2ν′15 0.022 4.577 1902 0.027 4.905 1ν′19+3ν′16/17 0.019 4.578 ? . . . 4.923 1ν′ 19+1ν′9+1ν′15 . . . 4.596 ? . . . 4.928 2ν′19+3ν′16/17 0.023 4.597 ? . . . 4.946 2ν′ 9 0.161 4.602 1901 0.025 4.958 3ν′19+3ν′16/17 0.030 4.617 ? . . . 4.96(2) (b) 3ν′ 15/1ν′19+2ν′9 0.109/0.021 4.624 ? . . . 4.97(7) (s) 4ν′16/17 0.091 4.627 (0–0) . . . 4.983 2ν′ 19+2ν′9 0.023 4.633 ? . . . 5.000 1ν′19+4ν′16/17 0.023 4.649 1ν′ 19 0.022 5.006 3ν′19+2ν′9 0.022 4.650 ? . . . 5.01(6) (b) 1ν′18+3ν′15 0.054 4.653 ? . . . 5.028 4ν′ 19+2ν′9 0.022 4.670 2ν′19 0.021 5.038 1ν′19+1ν′9+2ν′15 . . . 4.671 ? . . . 5.05(0) (b) 4ν′ 19+2ν′9 0.022 4.683 1ν′18 0.056 5.07(4) (b) 4ν′15/5ν′19+2ν′9 0.112/0.024 4.694 3ν′ 19 0.024 5.09(6) (b) 6ν′19+2ν′9 0.022 4.709 1ν′19+1ν′18 0.026 5.11(8) (b) 7ν′19+2ν′9 0.022 4.713 1ν′ 16/17 0.086 5.13(9) (b) 8ν′19+2ν′9 0.021 4.714 4ν′19 0.020 5.16(1) (b) 9ν′19+2ν′9 0.022 4.734 5ν′ 19/1ν′19+1ν′16/17 0.020/0.021 5.18(9) (b) 5ν′15 0.115 4.741 1ν′ 15 0.114 5.20(4) (b,w) 1ν′18+8ν′9+2ν′9 0.065
C. Valence and vibronic excitation in the range 5.3–6.4 eV (band III)
The valence band in this energy range (Figs.1,4, and5) has been assigned to the (π∗← π) transition in agreement
with Refs.17and21. The band maximum is here tentatively assigned to an energy of 5.539 eV. This value is in good agreement with Zwarich and Rabinowitch,21 who reported a
value at ∼5.58 eV. In the 5.3–6.4 eV lower energy region, we note the presence of two features at 5.416 and 5.539 eV, with an energy difference of 0.123 eV, which we assign to excitation of the ν′10(a′) ring stretching mode (see Fig.5).
D. Valence and vibronic excitation in the range 6.1–7.4 eV (band IV)
The valence band in this energy range (Figs. 1,4, and
5) is here assigned to the (π∗← π) transition in agreement with Ref.17. The (0–0) transition here has been identified at
FIG. 5. High resolution VUV photoabsorption spectrum of furfural (2-furaldehyde), C5H4O2, in the 5.3–10.8 eV photon energy range.
reported by Walsh.17 The band maximum at 6.871 eV is,
however, in good agreement with the value 6.89 eV from Walsh.17This energy region exhibits evidence for a transition
to a Rydberg state assigned to (3s ← 4a′′) at 6.215 eV (see SectionV Fand TableVI) and also shows a significant number of vibrational modes being excited (TablesIVandV). These have been assigned to ν′19(a′) ring-CHO deformation, ν′16/17
(a′) ring/C—C==O deformation, and ν′10 (a′) ring stretching
modes, with mean excitation energies of 0.022, 0.081, and 0.121 eV, respectively.
E. Valence and vibronic excitation in the range above 7.4 eV (bands V and VI)
From the theoretical perspective, a large number of elec-tronic states are recovered in this energy region. These states display a high degree of mixing that makes the interpretation of this energy region particularly challenging. Within the absorption spectrum, bands have been tentatively assigned to a distinct (π∗← π) valence transition peaking at 7.895 eV (Fig. 5), in very good agreement with a TDDFT calculated state at 7.81 eV that displays strong mixing of a number of (π∗← π) transitions. There are also a number of Rydberg exci-tations (see SectionV Fand TablesVandVI). The proposed vibronic structure in this energy region is associated with Rydberg series converging to ionic electronic ground(4a′′
)−1,
TABLE IV. Proposed vibrational assignments in the 6.1–6.4 eV absorp-tion band of furfural (2-furaldehyde), C5H4O2. (b)—broad structure. (s)— shoulder structure (the last decimal of the energy value is given in brackets for these less-resolved features).
Energy (eV) ∆ν′
19(eV) ∆ν′16/17(eV) ∆ν′10(eV) Assignment 6.18(5) (b) . . . (0–0) 6.205 0.020 . . . 1ν′19 6.228 0.023 . . . 2ν′ 19 6.260 . . . 0.075 . . . 1ν′16/1ν′17 6.28(7) (s) . . . 0.102 1ν′ 10 6.319 0.032 . . . 1ν′10+1ν′19 6.33(9) (b) 0.020 . . . 1ν′ 10+2ν′19 6.37(5) (b) . . . 0.088 . . . 1ν′10+1ν′16/1ν′17
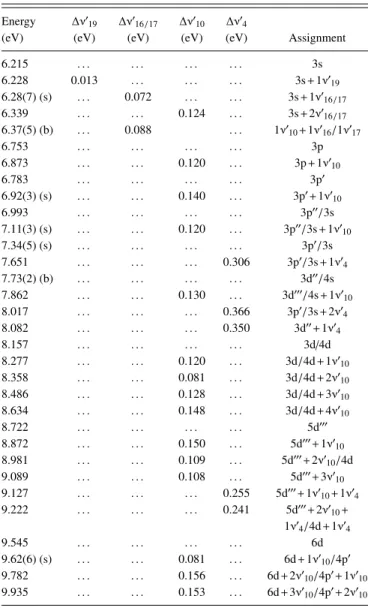
TABLE V. Proposed vibrational assignments in the 6.3–10.8 eV absorption band of furfural (2-furaldehyde), C5H4O2. (s)—shoulder structure. (b)— broad structure (the last decimal of the energy value is given in brackets for these less-resolved features).
Energy ∆ν′
19 ∆ν′16/17 ∆ν′10 ∆ν′4
(eV) (eV) (eV) (eV) (eV) Assignment 6.215 . . . 3s 6.228 0.013 . . . 3s+1ν′ 19 6.28(7) (s) . . . 0.072 . . . 3s+1ν′ 16/17 6.339 . . . 0.124 . . . 3s+2ν′ 16/17 6.37(5) (b) . . . 0.088 . . . 1ν′ 10+1ν′16/1ν′17 6.753 . . . 3p 6.873 . . . 0.120 . . . 3p+1ν′ 10 6.783 . . . 3p′ 6.92(3) (s) . . . 0.140 . . . 3p′+1ν′ 10 6.993 . . . 3p′′/3s 7.11(3) (s) . . . 0.120 . . . 3p′′/3s+1ν′ 10 7.34(5) (s) . . . 3p′/3s 7.651 . . . 0.306 3p′/3s+1ν′ 4 7.73(2) (b) . . . 3d′′/4s 7.862 . . . 0.130 . . . 3d′′′/4s+1ν′ 10 8.017 . . . 0.366 3p′/3s+2ν′ 4 8.082 . . . 0.350 3d′′+1ν′ 4 8.157 . . . 3d/4d 8.277 . . . 0.120 . . . 3d/4d+1ν′ 10 8.358 . . . 0.081 . . . 3d/4d+2ν′ 10 8.486 . . . 0.128 . . . 3d/4d+3ν′ 10 8.634 . . . 0.148 . . . 3d/4d+4ν′ 10 8.722 . . . 5d′′′ 8.872 . . . 0.150 . . . 5d′′′+1ν′ 10 8.981 . . . 0.109 . . . 5d′′′+2ν′ 10/4d 9.089 . . . 0.108 . . . 5d′′′+3ν′ 10 9.127 . . . 0.255 5d′′′+1ν′ 10+1ν′4 9.222 . . . 0.241 5d′′′+2ν′10+ 1ν′ 4/4d+1ν′4 9.545 . . . 6d 9.62(6) (s) . . . 0.081 . . . 6d+1ν′ 10/4p′ 9.782 . . . 0.156 . . . 6d+2ν′10/4p′+1ν′10 9.935 . . . 0.153 . . . 6d+3ν′ 10/4p′+2ν′10 first(21a′ )−1, and second (3a′′
)−1excited states of furfural that
are discussed in Sec.V F. The apparent enhancement of this band due to overlap with an underlying signal suggests that these transitions are followed by dissociative processes. The proposed vibronic assignments in this energy range are listed in TableVbut are not shown in Fig.5to avoid congestion.
F. Rydberg transitions
The VUV spectrum above 6.0 eV (Fig.5) consists of a series of sharp and diffuse absorption features extending to the lowest ionisation energies (IEs). The experimental ionisation energy values obtained by high-resolution He(I) photoelectron spectroscopy16are used to help tentatively assign the Rydberg series, with the proposed Rydberg structures being presented in TableVI. The peak positions, En, have been tested using
the Rydberg formula, En= Ei− R/(n − δ)2, where Ei is the
ionisation energy, n is the principal quantum number of the Rydberg orbital of energy En, R is the Rydberg constant
144308-9 Ferreira da Silva et al. J. Chem. Phys. 143, 144308 (2015) TABLE VI. Energy value (eV), quantum defect (δ), and assignment of
the Rydberg series converging to the ionic electronic ground(4a′′ )−1, first (21a′
)−1, and second (3a′′
)−1 excited states of furfural (2-furaldehyde), C5H4O2. (b)—broad structure. (s)—shoulder structure (the last decimal of the energy value is given in brackets for these less-resolved features).
En δ Assignment En δ Assignment IE1= 9.223 eV IE2= 9.956 eV 6.215 0.87 3s 9.222 0.69 5p 7.73(2) (b) 0.98 4s 9.53(0) (b) 0.35 6p 8.358 1.03 5s 7.65(1) (s) 0.57 3p′ 6.753 0.66 3p 8.878 0.45 4p′ 8.017 0.64 4p 9.301 0.44 5p′ 8.486 0.70 5p 9.52(3) (s) 0.39 6p′ 8.722 0.79 6p 8.157 0.25 3d 6.783 0.64 3p′ 8.981 0.26 4d 8.082 0.55 4p′ 9.347 0.27 5d 8.53(3) (s) 0.56 5p′ 9.545 0.25 6d 8.747 0.65 6p′ 8.358 0.08 3d′ 6.993 0.53 3p′′ 9.050 0.12 4d′ 8.157 0.43 4p′′ 8.613 0.28 5p′′ 8.495 −0.05 3d′′ 9.127 −0.05 4d′′ 7.34(5) (s) 0.31 3d 8.277 0.21 4d IE3= 10.678 eV 8.634 0.19 5d 7.65(1) (s) 0.85 3s 7.599 0.11 3d′ 9.308 0.85 4s 8.338 0.08 4d′ 9.86(4) (b) 0.91 5s 10.21(1) (b) 1.05 6s 7.73(2) (b) −0.02 3d′′ 8.358 0.03 4d′′ 8.338 0.59 3p 8.695 −0.08 5d′′ 9.253 0.57 4p 7.862 −0.16 3d′′′ 8.613 0.43 3p′ 8.495 −0.32 4d′′′ 9.62(6) (s) 0.40 4p′ 8.722 −0.21 5d′′′ 8.866 0.26 3d IE2= 9.956 eV 9.70(9) (s) 0.25 4d 6.993 0.86 3s 9.089 0.07 3d′ 8.613 0.82 4s 9.789 0.08 4d′ 9.133 0.93 5s 10.12(1) (b) 0.06 5d′ 9.454 0.79 6s 10.28(5) (s) 0.11 6d′ 7.599 0.60 3p 9.253 −0.09 3d′′ 8.793 0.58 4p 9.89(9) (b) −0.18 4d′′
penetration of the Rydberg orbital into the core. Regarding the ionisation from the ring orbitals, the lowest energy (6.215 eV) is tentatively assigned to the Rydberg transition (3s ← 4a′′),
with a quantum defect δ= 0.87, whereas the np, np′, np′′,
nd, nd′, nd′′, and nd′′′series are associated with the peaks at 6.753 eV (δ= 0.66), 6.783 eV (δ = 0.64), 6.993 eV (δ = 0.53), 7.34(5) eV (δ = 0.31), 7.599 eV (δ = 0.11), 7.73(2)eV (δ= −0.02), and 7.862 eV (δ = −0.16), respectively (see TableVI). As far as the Rydberg series converging to the first ionic electronic excited state are concerned, the n= 3 members have been obtained for ns, np, np′, nd, nd′, and nd′′series with quantum defects of δ= 0.86, δ = 0.60, δ = 0.57, δ = 0.25, δ = 0.08, and δ = −0.05, respectively (again see Table VI).
Finally, with respect to the Rydberg series converging to the ionic electronic second excited state, a total of six series comprising excitations to ns, np, np′, nd, nd′, and nd′′ have been obtained, the latter with members of n= 3 and n = 4. Due to the broad and structureless nature of the absorption bands, no higher order members of these Rydberg series have been proposed. We do note that the observed quantum defects are in the expected ranges for second row atoms, 0.9-1.2, ∼0.7, and 0-0.3 for ns, np, and nd, respectively.56
Finally, note that the clear increase in the absorption with energy, in the range above ∼6.3 eV, may be related to pre-dissociative or pre-dissociative excited neutral states.
G. Electron spectroscopy
We now discuss the representative EELS (Fig. 2), ob-tained with the electron spectrometers at Flinders University, in more detail. First, for E0= 30 eV impact energy and a
relatively small scattering angle (θ= 20◦), Fig. 2(b), where
the kinematic conditions mimic dipole scattering, the gross features of the spectrum are in excellent agreement with the measured photoabsorption spectrum. This is in-spite of the energy resolution of the photoabsorption measurements being superior to that achievable in our electron scattering experiments. Second, in the EELS obtained at a lower incident electron energy (E0= 20 eV) and a large electron
scattering angle (θ= 90◦), exchange scattering allows dipole-forbidden singlet-triplet excitation processes. This produces an intense feature in band I that is much more significant than that observed in the present and previous55 absolute
photoabsorption spectra in the same energy region. The change in band I behaviour is also evident when the energy loss spectra obtained under the two different kinematical conditions are compared; Fig.2(a)where exchange scattering is comparable in significance to dipole scattering (E0
= 20 eV and θ = 90◦) and Fig.2(b)where dipole-scattering
is preferred (E0= 30 eV and θ = 20◦). Both the TDDFT
and FSCI calculations (see Table I) suggest that two low-lying triplet states are expected in this energy region. We therefore attribute the enhanced spectral intensity observed under the scattering conditions, where exchange scattering is more prominent, to the excitation of these two triplet states. This interpretation appears to be consistent with the comment of Gandini et al.20 that in the (π∗← nO) photoabsorption
transition, the lack of observable fluorescence suggests a short lifetime (<2 ns) for the singlet state, allowing an efficient intersystem crossing to the triplet manifold with a quantum yield close to unity.
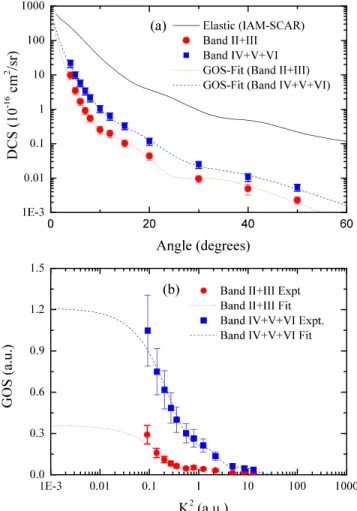
Inelastic DCSs have also been derived from our energy loss spectra obtained at 250 eV impact energy that were measured over the 4◦-50◦range of electron scattering angles.
These DCSs are presented and tabulated in Figure6(a) and Table VII, respectively. Also contained in this figure and table are the present IAM-SCAR elastic scattering cross sections used for normalising our experimentally determined elastic-to-inelastic ratios. Note that our energy resolution of 1.1 eV (FWHM), for the spectrum in Fig. 2(c) and others obtained with the low-resolution spectrometer, and the large number of closely located states only allow us
to de-convolve such energy loss spectra into two unique experimental features for the composite bands II+ III and bands IV+ V + VI. These DCSs are also converted into GOSs and fitted using the Vriens analytic formula45 for the GOS, with the experimental data and fitted GOS also being plotted in Fig. 6(b). In the limit of K2 goes to zero, the GOS converges to the OOS for the unresolved excitation processes. OOSs derived from the present fits to the GOSs are contained in Table VIII, where they are also compared against the summed OOSs obtained for all theoretical states recovered within each experimental band at the TDDFT and FSCI calculation levels. The resultant OOS derived for bands II+ III is in good agreement with the summed OOS for the states obtained within the TDDFT calculation. The summed FSCI OOS is also in fair accord with the experimental value. This self-consistency through a combination of experiment, theoretical quantum chemistry, and IAM-SCAR scattering calculations is particularly good evidence that the excited state characterisations and elastic/inelastic electron scattering data are reliable.
For the composite experimental bands IV+ V + VI, the measurement-derived oscillator strength appears to be much larger than that recovered in the TDDFT calculation. Specifically, no significantly intense states are recovered in band VI that adequately account for the prominent two features observed in the photoabsorption spectrum at ∼8.5 and 9.0 eV. Here, we note that these two features have a comparable photoabsorption cross section to the feature at 7.9 eV. Thus, we expected that a significant proportion of the OOS would be missing from our summed OOS derived from the TDDFT and FSCI calculations, compared to that obtained experimentally, which is precisely what we observe in Table VIII. Also, the recovered oscillator strengths at the FSCI level, while being consistent with the TDDFT level over the sum of bands IV-VI, exhibits a different partitioning of that intensity to the individual bands. This suggests that for the future comparison of MOBSCI inelastic differential cross sections with experimental data, it may be necessary to consider the summed intensity over the bands IV-VI.
FIG. 6. (a) Elastic and inelastic differential cross sections for electron scat-tering from furfural at an impact energy of 250 eV; (b) generalised oscillator strengths for excitation of the II+III and IV+V+VI electronic bands of furfural. See text for further details.
H. Absolute photoabsorption cross sections and atmospheric photolysis
The present optical measurements were carried out in the pressure range 0.03-1.29 mbar and reveal no evidence
TABLE VII. Differential cross sections for elastic electron scattering and inelastic electron scattering from furfural at a 250 eV impact energy. See text for further details.
Theory Expt. Expt.
Angle IAM-SCAR Band II+III Uncertainties Band IV+V+VI Uncertainties (deg) (10−16cm2/sr) (10−16cm2/sr) (%) (10−16cm2/sr) (%) 4 244.7 9.81 25 21.5 25 5 179.3 3.46 23 10.0 22 6 127.9 1.68 23 5.79 22 7 90.0 0.918 23 3.37 23 8 63.1 0.543 23 2.14 23 10 32.4 0.254 25 1.04 23 12 18.0 0.199 26 0.632 24 15 8.39 0.103 23 0.327 22 20 3.72 0.0438 23 0.118 23 30 0.921 0.0096 23 0.025 22 40 0.478 0.0049 34 0.011 25 50 0.218 0.0023 23 0.0054 23
144308-11 Ferreira da Silva et al. J. Chem. Phys. 143, 144308 (2015) TABLE VIII. Experimentally derived and theoretically calculated optical oscillator strengths for the composite
experimental bands.
f0 TDDFT FSCI
Expt. band Energy (eV) Expt. Expt. band
trans-furfural cis-furfural trans-furfural cis-furfural II (EL∼ 4.4-5.4) 0.352 0.351 0.483 0.481 III (EL∼ 5.4-6.4) 0.022 0.056 0.050 0.084 II+III 4.3–5.8 0.349 ± 0.025 Sum (II+III) 0.374 0.406 0.533 0.565 IV(EL∼ 6.4-7.4) 0.176 0.221 0.305 0.623 V (EL∼ 7.4-8.2) 0.252 0.293 0.052 0.062 VI (EL∼ 8.2-9.0)a 0.063 0.172 0.120 0.121 IV+V+VI 5.8–9.0 1.211 ± 0.081 Sum (IV+V+VI) 0.491 0.686 0.478 0.806 aIndicates a partial sum over states recovered in the calculation. See text for further details.
for any changes in the absolute cross sections or peak energies as a function of pressure. Thus, we believe that the present spectra are free of any saturation effects. Previous UV photoabsorption cross sections of furfural are restricted to the wavelength ranges 170–200 nm (7.29–6.21 eV),17
200–500 nm (6.20–2.48 eV),21210–370 nm (5.90–3.35 eV),9
253–272 nm (4.90–4.56 eV),19246–280 nm (5.04–4.43 eV), and 331–369 nm (3.75–3.36 eV).18Gandini et al.20reported absolute cross sections of magnitude ∼0.11 Mb (330 nm, 3.76 eV) and ∼76.4 Mb (257 nm, 4.82 eV), against the present respective values of 0.13 and 66.5 Mb. We believe that the observed difference, in particular at the higher energy, may be attributed to the poorer resolution of the apparatus in Gandini et al.20Furthermore, the general level of agreement between
previous cross sections measured at the ASTRID beamline and the most precise independent data available in the literature (see Eden et al.57 and references therein) suggests that the
present furfural cross sections can be relied upon across the energy range studied up to 10.8 eV (see Figure1).
The absolute photoabsorption cross sections presented in this work can be used in combination with solar actinic flux58
measurements from the literature, to estimate the photolysis rate of furfural in the atmosphere from an altitude close to the ground to the limit of the stratopause at 50 km. Details of the programme used to achieve that are presented elsewhere.59 Note that the quantum yield for dissociation following absorption is assumed to be unity. The reciprocal of the photolysis rate at a given altitude corresponds to the local photolysis lifetime. Photolysis lifetimes of less than 24 sunlit hr (1 day) were calculated at altitudes above 0 km. This indicates that furfural molecules can be broken up quite efficiently by UV absorption.
Rate constants for gas-phase reactions of Cl, OH, and NO3
radicals with furfural have been recently studied by Colmenar et al.55with values of k = 2.61 × 1010cm3molecule−1s−1, k
= 3.51 × 1011 cm3 molecule−1 s−1, and k= 1.20 × 1012 cm3
molecule−1s−1, respectively. Their comprehensive study has led to the conclusion that removal of furfural by reactions with OH radicals becomes more important (lifetime of 4 hr) than the UV photolysis under low solar actinic flux conditions independent of the quantum yield, whereas if the emission source also occurs during the night time, NO3radicals will be
the main sink process (lifetime of 28 min) of such species.
I. Challenges of the theoretical electron scattering calculations
Our full-single configuration interaction calculation mentioned previously gives 53 electronic excited states (not all shown in Table I) below 10 eV and 9 states below 7 eV. The MOB-SCI calculation (obtained with selected hole-particle pairs) that will be used for further electron scattering calculations reproduces the FSCI spectrum below 7 eV but only accounts for 30 out of the possible 53 states below 10 eV. The MOB-SCI contains 63 open electronic channels (all below 26 eV), the ground state plus 31 singlet (13 below 10 eV) and 31 triplet (17 below 10 eV) states. The multichannel calculation for this system represents a big computational challenge and becomes even more demanding if we must also carry it out for both of the trans and cis geometries.
A typical furfural gas composition is made up of about 80% trans and 20% cis molecular structures. In order to understand how that could affect the theoretical study on the electron-furfural scattering problem, we carried out a preliminary calculation to obtain the elastic DCSs for energies above 15 eV for the cis and trans molecular structures. Fig.7
FIG. 7. Differential cross section for electron scattering from the cis and trans furfural conformers, at impact energies of 15, 20, 30, and 40 eV, as ob-tained with the Schwinger multichannel method with pseudopotentials at the one-channel static-exchange-plus-polarization level of approximation: trans structure with Lmax= 13, black full line; cis structure with Lmax = 13, blue dashed line; trans structure with Lmax= 10, red dotted line; trans structure with Born-closure, green dotted-dashed line. See Ref.60for an explanation of the terminology used.
shows the DCS’s for 15, 20, 30, and 40 eV electron impact energy obtained with the Schwinger Multichannel method with pseudopotentials60 at the one-channel static-exchange-plus-polarization level of approximation. For details of the terminology used in this figure, please refer to Ref. 60. The results for the two isomers are very similar. This suggests that the more elaborate multichannel calculation needed to correctly describe electron scattering phenomena13 only
needs to be undertaken for the single, most abundant, trans conformer.
VI. CONCLUSIONS
The present work reported the first complete study of the VUV electronic spectra of furfural and also provided the most reliable set of absolute photoabsorption cross sections available between 3.5 and 10.8 eV. Absorption bands attributed to valence and Rydberg transitions were observed, and a number of new assignments proposed on the basis of comparisons with the present ab initio calculations. Electron energy loss spectra measurements were also performed and yielded excellent qualitative agreement with the photoabsorption results. The EELS measurements also provided evidence for the existence of low-lying triplet states in furfural. Intermediate energy EELS measurements were also undertaken to determine generalised oscillator strengths for composite excitation bands. Optical oscillator strengths were derived from the experimental GOS and were found for bands II+ III to be in excellent agreement with corresponding oscillator strengths calculated at the TDDFT level and in quite reasonable agreement with those calculated at the FSCI level for this molecule. The analysis of the observed vibronic structure in our photoabsorption spectra is generally consistent with earlier data, although the higher resolution of the present experiments has enabled us to propose assignments for Rydberg series strongly overlapping with several progressions within these bands. Finally, having quantified the electronically-excited states of furfural, it is now possible to construct a minimal-orbital-basis single configuration-interaction picture for perform-ing high-level low-energy Schwperform-inger multichannel electron scattering calculations. Our initial results at the 1-channel [ground electronic state] level indicated that the scattering computations need only be performed for the trans iso-mer, a significant result in terms of making our further theoretical studies tractable.39 The importance of accurately
describing the electronic structure in complex organic targets cannot be underestimated in electron scattering calculations, where electronic states often display strong multichannel coupling.13
ACKNOWLEDGMENTS
F.F.S. and P.L.V. acknowledge the Portuguese Foundation for Science and Technology (FCT-MEC) through Grant Nos. SFRH/BPD/68979/2010 and SFRH/BSAB/105792/2014, respectively, the research Grant Nos. PTDC/FIS-ATO/1832/ 2012 and UID/FIS/00068/2013. P.L.V. also acknowledges
his Visiting Research Fellow position at Flinders University, Adelaide, South Australia. The Patrimoine of the University of Liège, the Fonds National de la Recherche Scientifique, and the Fonds de la Recherche Fondamentale Collective of Belgium have also supported this research. E.L. and R.F.C.N. thank CNPq (Brazil) and the Science Without Borders Programme for opportunities to study abroad. The authors wish to acknowledge the beam time at the ISA synchrotron at Aarhus University, Denmark. The research leading to these results has received funding from the European Community’s Seventh Framework Programme (Grant No. FP7/2007-2013) CALIPSO under Grant Agreement No. 312284. D.B.J. thanks the Australian Research Council for financial support provided through a Discovery Early Career Research Award. M.J.B. also thanks the Australian Research Council for some financial support, while M.J.B. and M.C.A.L. acknowledge the Brazilian agencies CNPq and FAPEMIG for financial support. F.B. and G.G. acknowledge partial financial support from the Spanish Ministry MINECO (Project No. FIS2012-31230) and the EU COST Action No. CM1301 (CELINA). Finally, R.F.C., M.T.do N.V., M.H.F.B., and M.A.P.L. acknowledge support from the Brazilian agency CNPq.
1A. S. Mamman, J.-M. Lee, Y.-C. Kim, I. T. Hwang, N.-J. Park, Y. K. Hwang, J.-S. Chang, and J.-S. Hwang,Biofuels, Bioprod. Biorefin.2, 438 (2008). 2M. D’Angelantonio, S. S. Emmi, G. Poggi, and G. Beggiato,J. Phys. Chem.
A103, 858 (1999).
3A. J. Ragauskas, C. K. Williams, B. H. Davison, G. Britovsek, J. Cairney, C. A. Eckert, W. J. Frederick, J. P. Hallett, D. J. Leak, C. L. Liotta, J. R. Mielenz, R. Murphy, R. Templer, and T. Tschaplinski,Science311, 484 (2006). 4H. Gomez Bernal, L. Bernazzani, and A. M. Raspolli Galletti,Green Chem.
16, 3734 (2014).
5J.-P. Lange, E. van der Heide, J. van Buijtenen, and R. Price,ChemSusChem 5, 150 (2012).
6J. D. Keating, C. Panganiban, and S. D. Mansfield,Biotechnol. Bioeng.93, 1196 (2006).
7P. Pienkos and M. Zhang,Cellulose16, 743 (2009). 8L. D. Schmidt and P. J. Dauenhauer,Nature447, 914 (2007).
9J. Amorim, C. Oliveira, J. A. Souza-Corrêa, and M. A. Ridenti,Plasma
Process. Polym.10, 670 (2013).
10N. Schultz-Jensen, F. Leipold, H. Bindslev, and A. Thomsen, Appl.
Biochem. Biotechnol.163, 558 (2011).
11J. S. Bak, J. K. Ko, Y. H. Han, B. C. Lee, I.-G. Choi, and K. H. Kim,
Bioresour. Technol.100, 1285 (2009).
12A. W. Khan, J. P. Labrie, and J. McKeown,Biotechnol. Bioeng.28, 1449 (1986).
13R. F. da Costa, E. M. de Oliveira, M. H. F. Bettega, M. T. d. N. Varella, D. B. Jones, M. J. Brunger, F. Blanco, R. Colmenares, P. Limão-Vieira, G. García, and M. A. P. Lima,J. Chem. Phys.142, 104304 (2015).
14R. F. C. Neves, D. B. Jones, M. C. A. Lopes, K. L. Nixon, G. B. da Silva, H. V. Duque, E. M. de Oliveira, R. F. da Costa, M. T. d. N. Varella, M. H. F. Bettega, M. A. P. Lima, K. Ratnavelu, G. García, and M. J. Brunger,
J. Chem. Phys.142, 104305 (2015).
15D. B. Jones, G. B. da Silva, R. F. C. Neves, H. V. Duque, L. Chiari, E. M. de Oliveira, M. C. A. Lopes, R. F. da Costa, M. T. d. N. Varella, M. H. F. Bettega, M. A. P. Lima, and M. J. Brunger,J. Chem. Phys.141, 074314 (2014). 16D. B. Jones, E. Ali, K. L. Nixon, P. Limão-Vieira, M.-J. Hubin-Franskin,
J. Delwiche, C. G. Ning, J. Colgan, A. Murray, D. H. Madison, and M. J. Brunger, “Electron- and photon-impact ionization of furfural,” J. Chem. Phys. (submitted).
17A. D. Walsh,Trans. Faraday Soc.42, 62 (1946).
18V. Santhamma, Proc. Natl. Acad. Sci., India, Sect. A 22, 256 (1956). 19J. E. Purvis,J. Chem. Soc.97, 1648 (1910).
20A. Gandini, P. A. Hackett, and R. A. Back,Can. J. Chem.54, 3089 (1976). 21R. Zwarich and I. Rabinowitz,J. Chem. Phys.63, 4565 (1975).
22R. F. da Costa, M. H. F. Bettega, M. A. P. Lima, M. C. A. Lopes, L. R. Hargreaves, G. Serna, and M. A. Khakoo,Phys. Rev. A85, 062706 (2012).
144308-13 Ferreira da Silva et al. J. Chem. Phys. 143, 144308 (2015) 23A. Giuliani, J. Delwiche, S. V. Hoffmann, P. Limão-Vieira, N. J. Mason, and
M.-J. Hubin-Franskin,J. Chem. Phys.119, 3670 (2003).
24A. Giuliani, I. C. Walker, J. Delwiche, S. V. Hoffmann, C. Kech, P. Limão-Vieira, N. J. Mason, and M.-J. Hubin-Franskin,J. Chem. Phys.120, 10972 (2004).
25A. Giuliani, I. C. Walker, J. Delwiche, S. V. Hoffmann, P. Limao-Vieira, N. J. Mason, B. Heyne, M. Hoebeke, and M. J. Hubin-Franskin,J. Chem. Phys.119, 7282 (2003).
26F. Kossoski and M. H. F. Bettega,J. Chem. Phys.138, 234311 (2013). 27I. C. Walker, M. H. Palmer, J. Delwiche, S. V. Hoffmann, P. Limão-Vieira,
N. J. Mason, M. F. Guest, M.-J. Hubin-Franskin, J. Heinesch, and A. Giu-liani,Chem. Phys.297, 289 (2004).
28R. A. Motiyenko, E. A. Alekseev, S. F. Dyubko, and F. J. Lovas,J. Mol.
Spectrosc.240, 93 (2006).
29F. A. Miller, W. G. Fateley, and R. E. Witkowski,Spectrochim. Acta, Part A 23, 891 (1967).
30M. Rogojerov, G. Keresztury, and B. Jordanov,Spectrochim. Acta, Part A 61, 1661 (2005).
31A. Gandini, J. M. Parsons, and R. A. Back,Can. J. Chem. 54, 3095 (1976).
32D. Klapstein, C. D. MacPherson, and R. T. O’Brien,Can. J. Chem.68, 747 (1990).
33S. Eden, P. Limão-Vieira, S. V. Hoffmann, and N. J. Mason,Chem. Phys. 323, 313 (2006).
34M. H. Palmer, T. Ridley, S. V. Hoffmann, N. C. Jones, M. Coreno, M. de Simone, C. Grazioli, M. Biczysko, A. Baiardi, and P. Limão-Vieira,J. Chem. Phys.142, 134302 (2015).
35M. J. Brunger and P. J. O. Teubner,Phys. Rev. A41, 1413 (1990). 36S. J. Cavanagh and B. Lohmann,J. Phys. B: At., Mol. Opt. Phys.32, L261
(1999).
37F. Blanco and G. García,J. Phys. B: At., Mol. Opt. Phys.42, 145203 (2009).
38F. Blanco and G. García,Phys. Lett. A330, 230 (2004).
39R. F. da Costa, M. A. P. Lima, M. H. F. Bettega, E. M. de Oliveira, M. T. d. N. Varella, G. Garcia, D. B. Jones, and M. J. Brunger, “Elastic electron collisions with furfural: an investigation on the behavior of the cross sections under the influence of multichannel coupling effects” (unpublished). 40P. Palihawadana, J. Sullivan, M. Brunger, C. Winstead, V. McKoy, G. Garcia,
F. Blanco, and S. Buckman,Phys. Rev. A84, 062702 (2011).
41L. R. Hargreaves, J. R. Brunton, A. Prajapati, M. Hoshino, F. Blanco, G. Garcia, S. J. Buckman, and M. J. Brunger,J. Phys. B: At., Mol. Opt. Phys.
44, 045207 (2011).
42H. Kato, T. Asahina, H. Masui, M. Hoshino, H. Tanaka, H. Cho, O. Ingolfs-son, F. Blanco, G. Garcia, S. J. Buckman, and M. J. Brunger,J. Chem. Phys.
132, 074309 (2010).
43E. N. Lassettre,J. Chem. Phys.43, 4479 (1965). 44A. R. P. Rau and U. Fano,Phys. Rev.162, 68 (1967). 45L. Vriens,Phys. Rev.160, 100 (1967).
46B. R. Lewis,Phys. Rev. A78, 026701 (2008).
47H. Kawahara, H. Kato, M. Hoshino, H. Tanaka, and M. J. Brunger,Phys.
Rev. A77, 012713 (2008).
48H. Kawahara, D. Suzuki, H. Kato, M. Hoshino, H. Tanaka, O. Ingolfsson, L. Campbell, and M. J. Brunger,J. Chem. Phys.131, 114307 (2009). 49H. Kato, M. Hoshino, H. Tanaka, P. Limão-Vieira, O. Ingolfsson, L.
Campbell, and M. J. Brunger,J. Chem. Phys.134, 134308 (2011). 50M. W. Schmidt, K. K. Baldridge, J. A. Boatz, S. T. Elbert, M. S. Gordon,
J. H. Jensen, S. Koseki, N. Matsunaga, K. A. Nguyen, S. Su, T. L. Windus, M. Dupuis, and J. A. Montgomery,J. Comput. Chem.14, 1347 (1993). 51K. K. Baldridge, V. Jonas, and A. D. Bain,J. Chem. Phys.113, 7519
(2000).
52R. Bauernschmitt and R. Ahlrichs,Chem. Phys. Lett.256, 454 (1996). 53M. E. Casida,J. Mol. Struct.: THEOCHEM914, 3 (2009).
54M. J. Frisch et al., 09, Revision B.01, Gaussian, Inc., Wallington, CT, USA, 2010.
55I. Colmenar, S. González, E. Jiménez, P. Martín, S. Salgado, B. Cabañas, and J. Albaladejo,Atmos. Environ.103, 1 (2015).
56Ed. C. Sándorfy, The Role of Rydberg States in Spectroscopy and Photo-chemistry(Kluwer Academic Publishers, Netherlands, 1999).
57S. Eden, P. Limão-Vieira, S. V. Hoffmann, and N. J. Mason,Chem. Phys. 331, 232 (2007).
58W. B. DeMore, S. P. Sander, D. M. Golden, R. F. Hampson, M. J. Kurylo, C. J. Howard, A. R. Ravishankara, C. E. Kolb, and M. J. Molina, Chemi-cal Kinetics and PhotochemiChemi-cal Data for Use in Stratospheric Modelling, Evaluation No. 12 (JPL Publication 97–4, 1997).
59P. Limão Vieira, S. Eden, P. A. Kendall, N. J. Mason, and S. V. Hoffmann,
Chem. Phys. Lett.364, 535 (2002).
60R. F. da Costa, M. T. d. N. Varella, M. H. F. Bettega, and M. A. P. Lima,Eur.