Universidade de Lisboa
Faculdade de Ciências
Departamento de Biologia Animal
Seafood consumption in Portugal:
Patterns, drivers and sustainability
Cheila Pereira Almeida
Thesis for the degree in Doctor of Sea Sciences
Universidade de Lisboa
Faculdade de Ciências
Departamento de Biologia Animal
Seafood consumption in Portugal:
Patterns, drivers and sustainability
Cheila Pereira Almeida
Thesis supervised by Prof. Dr. Henrique Cabral (FCUL/CO), Dr. Friederike Ziegler
(SIK) and Dr. Sofia G. Vaz (FCT-UNL/CENSE)
This thesis was made in collaboration with the following institutions:
Sustainable Food Production Department SIK - The Swedish Institute for Food and Biotechnology
CENSE - Centre for Environmental and Sustainability Research
FCTUNL - Faculdade de Ciências e Tecnologia at Universidade Nova de Lisboa
CO – Centro de Oceanografia
Comer é uma celebração da morte ou, o que vem dar ao mesmo, um consumo da vida. Outros seres, vegetais ou animais, morrem para que nós continuemos vivos.
O mais das vezes as mortes que comemos vêm disfarçadas em filetes e bifes, em croquetes e lombinhos, distanciando-nos das matanças que foram necessárias. E essas matanças seguem-se a métodos de criação que são já uma espécie de morte e a negação de um mínimo de alegria de vida aos pobres bichos, sejam frangos, vitelos ou salmões de viveiro.
Se quiser manter a sanidade gastronómica terá de lembrar-se que todas estas manobras são recursos e imaginações, pensadas para suprir a falta de alimentos frescos, preservando os velhos e arranjando estratégias de reconstituição. A maneira como os portugueses, acima de todos, cozinham o bacalhau seco é uma das mais gloriosas excepções, já que o bacalhau fresco e acabado de morrer, por muito bem que seja cozinhado, é sempre mais desinteressante.
O nosso bacalhau (e o basco) é uma solução genial ao problema que é: não tens dinheiro para comprar peixe fresco; ou moras no interior; ou não há praça decente; mas gostarias à mesma de comer peixe ou coisa parecida. É genial porque, mesmo no país europeu com a melhor costa de pesca, implicou atravessar o Atlântico, sofrendo horrores, para ir buscar um peixe americano que se prestasse ao sol e ao sal de Portugal, de modo a podermos dispor dele quando quiséssemos.
Neste momento, porém, peço-vos que comparem uma (ou 9) sardinhas assadas, acabadinhas de pescar e grelhar, com uma lata de boas sardinhas de conserva; um caldo de peixe japonês feito a partir de pó desidratado de sardinhas; umas sardinhas descongeladas comidas quando não se consegue esperar pelos Santos.
As sardinhas frescas são melhores, desculpem lá. A bem ver, só existem, em plenitude, durante escassos 30 dias por ano. Mas são deliciosas e baratas e definidoras. Para mais, atingem o auge quando os pimentos e a alface coincidem e o clima mais se presta à degustação. São um cúmulo. …
As coisas são melhores quanto mais depressa se estragam. Ou seja: se comer é uma celebração da morte em nome da vida; a pressa com que as comidas se degeneram é directamente proporcional à bondade delas.
Eating is a celebration of death or, what comes to the same thing, consuming life. Other beings, plants or animals die so that we may keep on living.
Most often death comes disguised as fillets and steaks, into croquettes and tenderloin, distancing us from the necessary killings. And these killings follow already a kind of denial of life and a minimum of joy of life to the poor critters, as chickens, calves or farmed salmon.
If you want to keep any type of culinary sanity you must remember that all these manoeuvres are resources and imaginations, designed to address the lack of fresh foods, preserving the old and arranging replenishment strategies. The way the Portuguese, above all, cook dried cod is one of the most glorious exceptions, since fresh cod just after his death, no matter how well it is cooked , it is always more unattractive.
Our cod (and Basque) is an ingenious solution to the problem: you have no money to buy fresh fish; or you live inland; or there is no decent market; but you would like anyway to eat fish or something similar. It's genial because even in the European country with the best shore for fishing, it meant crossing the Atlantic, suffering horrors, to catch an American fish that would then lend itself to Portuguese sun and salt, so that we can have it whenever we want it.
Now, let me ask you to compare one (or 9) grilled sardines, coming straight from the sea with a can of sardines canned good; a Japanese fish broth made from dried sardines powder; sardines frozen when you cannot wait for the Saints festivities.
Fresh sardines are best, excuse me. In truth they exist in abundance for only 30 days a year. But they are delicious and cheap. Moreover, they reach their peak at the same time as peppers and lettuce and when the weather inspires us to better tasting food. They are a must.
...
Things are better the faster they get rotten. Meaning: if eating is a celebration of death in the name of life; the speed of food degenerating is directly proportional to their goodness.
Table of Contents
Resumo ... I Abstract ... III Acknowledgements... IV List of Publications ... VI List of Figures ... VII List of Tables ... IX List of Acronyms and Abbreviations ... X Glossary of Terms ... XI
Chapter 1. General introduction ... 1
1.1 Food from the sea ... 2
1.2 Food production and consumption: Two sides of sustainability ... 5
1.2.1 The concept of sustainability ... 5
1.2.2 Environmental impacts from food production ... 6
1.2.3 Consumer choices ... 7
1.3 Life Cycle Assessment applied to seafood ... 9
1.4 Overview about seafood consumption ... 12
1.4.1 Seafood demand worldwide ... 12
1.4.2 Consumer recommendations ... 14
1.4.3 The sustainable seafood movement ... 16
1.4.4 Seafood consumption in Portugal ... 21
1.5 Aims and thesis outline ... 23
1.6 References ... 26
Chapter 2. Why do Portuguese eat so much seafood? Drivers, patterns and historical perspectives ... 36
2.1 Abstract ... 37
2.2 Introduction ... 37
2.3 Methods ... 39
2.4 Results and discussion ... 41
2.4.1 Seafood supply in Portugal ... 41
2.4.2 Seafood in the Portuguese diet throughout last decades ... 44
2.4.3 Drivers in seafood consumption ... 50
2.5 Conclusions ... 55
2.6 References ... 56
Chapter 3. Environmental assessment of sardine (Sardina pilchardus) purse seine fishery in Portugal with LCA methodology including biological impact categories ... 59
3.1 Abstract ... 60
3.2 Introduction ... 61
3.3 Methods ... 63
3.3.1 Goal and scope definition ... 63
3.3.2 Data acquisition ... 64
3.3.3 Impact assessment ... 65
3.3.4 Sensitivity analyses ... 66
3.4 Results ... 67
3.4.2 Impact assessment ... 69
3.4.3 Fishery-specific environmental impacts... 72
3.5 Discussion ... 75
3.5.1 Environmental impact and variables ... 75
3.5.2 Fishery-specific impact categories for sardine ... 78
3.5.3 Carbon footprint of sardine ... 80
3.6 Conclusions ... 81
3.7 References ... 81
Chapter 4. Environmental life cycle assessment of canned sardines from Portugal ... 85
4.1 Abstract ... 86
4.2 Introduction ... 86
4.3 Goal and scope ... 89
4.4 System description ... 90
4.5 Life cycle inventory and data collection ... 92
4.6 Life cycle impact assessment ... 94
4.7 Results and Discussion ... 95
4.7.1 Environmental assessment of canned sardine ... 95
4.7.2 Comparison sardine products at the retailer phase ... 98
4.7.3 Sensitivity analysis ... 101
4.7.4 Canned sardines compared to other seafood products ... 103
4.8 Conclusions ... 105
4.9 References ... 105
Chapter 5. Influence of consumer’s knowledge towards more sustainable seafood consumption in Portugal ... 110
5.1 Abstract ... 111
5.2 Introduction ... 111
5.3 Methods ... 114
5.3.1 Research Approach ... 114
5.3.2 Questionnaire Content, Scaling, and Sample description ... 114
5.3.3 Statistical Analysis ... 116
5.4 Results ... 117
5.5 Discussion ... 125
5.6 Conclusions ... 129
5.7 References ... 130
Chapter 6. General discussion and future perspectives ... 133
6.1 Main findings... 134
6.2 Implications and perspectives for seafood consumption in Portugal ... 136
6.3 Sustainable diets ... 139
6.4 Final considerations ... 140
6.5 Future research ... 142
I
Resumo
O consumo de pescado está a aumentar devido ao crescimento da população mundial e ao facto de os consumidores preferirem cada vez mais peixe. No entanto as capturas da pesca têm vindo a diminuir, devido a restrições provenientes da gestão dos stocks e dos impactes ambientais da pesca. No entanto as capturas da pesca têm vindo a diminuir devido a restrições provenientes da gestão dos stocks e dos impactes ambientais da pesca. O aumento no consumo de pescado tem sido possível através da produção de aquacultura que no entanto, está dependente do peixe selvagem para rações e óleo de peixe, e interfere no funcionamento dos ecossistemas. Portugal tem um dos consumos de pescado per capita mais elevados do mundo e neste cenário é importante entender como é que a procura dos consumidores afecta a cadeia de abastecimento e de que forma pode ser alterado para um consumo mais sustentável.
Os consumidores devem estar informados sobre as consequências das suas escolhas em relação ao pescado e a sua responsabilidade no final da cadeia de abastecimento. No entanto, precisam de ferramentas que os ajudem a decidir. Apesar das iniciativas existentes, a produção de pescado continua a ser um assunto complexo para o entendimento dos consumidores. A Análise do Ciclo de Vida (ACV) é uma metodologia importante para utilizar quando há necessidade de quantificar e agregar os impactes ambientais da produção de alimentos, como o pescado. No entanto, a área do consumo sustentável requer investigação interdisciplinar e estudos com consumidores, de forma a caracterizar os hábitos de consumo e a encontrar formas de comunicação eficientes e adaptadas ao contexto. Os principais objectivos da tese foram descrever o consumo de pescado em Portugal, aplicar a metodologia de (ACV) para produtos do mar portugueses, e descobrir como comunicar com os consumidores para melhorar a sustentabilidade.
O primeiro estudo da tese teve como objectivo responder à questão porque é que os portugueses têm um consumo de pescado muito elevado e acima da média europeia. Para identificar os motivos e possíveis consequências desse consumo foi feita uma análise das estatísticas nacionais e uma revisão bibliográfica sobre o consumo de pescado em Portugal ao longo do tempo. Em países costeiros espera-se um maior consumo de pescado devido à grande diversidade de produtos disponíveis, mas o consumo de pescado em Portugal não está apenas relacionado com a geografia, pesca, ou disponibilidade de recursos marinhos; está também com outros factores como a influência da religião e da política nos hábitos alimentares. Comparando com outros países Europeus, o consumo de pescado em Portugal é caracterizado por uma elevada diversidade de espécies mas o bacalhau é a espécie mais importante nos hábitos alimentares. Representa aproximadamente 40% do pescado consumido em Portugal. Apesar de ser um peixe que não existe na costa Portuguesa, factores como a religião e as tradições, promoveram o seu consumo ao longo do tempo. O elevado consumo tem consequências ambientais e económicas, uma vez que é fornecido a partir de outras partes do mundo, onde o pescado pode ter um papel importante na segurança alimentar local, ou de stocks que não se tem conhecimento suficiente. Além disso, o elevado consumo de pescado impõe riscos de saúde relacionados com ingestão de substâncias tóxicas, mas não existe uma recomendação sobre o assunto para Portugal.
Entre o pescado mais consumido pelos portugueses, a sardinha é o peixe mais importante em termos de capturas. A pesca da sardinha foi avaliada com ACV para identificar os impactes ambientais da frota de cerco. Variáveis como o tamanho dos barcos e tempo foram verificadas e utilizadas categorias de impacto ambiental específicas para a pesca para complementar a análise com informação biológica. A pesca do cerco tem menores impactes ambientais em relação a outras pescarias devido ao baixo consumo de combustível e a menores impactes biológicos, devido ao comportamento dos peixes pelágicos de se agruparem em cardumes. No entanto as devoluções das capturas acessórias podem ser substanciais e é necessário gestão do stock. Foram encontradas diferenças no desempenho ambiental da pesca entre anos, e a variabilidade pode ser ainda maior entre meses. Verificou-se que mesmo que uma pescaria seja eficiente, há necessidade de verificar o
II
estado do stock. Para além disso não foram encontradas diferenças no uso de combustível entre embarcações grandes e pequenas, apesar da composição das capturas ser diferente.
Pequenos peixes pelágicos, como a sardinha, têm capturas com grandes volumes que são difíceis de processar. A indústria conserveira Portuguesa tradicionalmente utiliza este tipo de pescado e o produto mais importante, as conservas de sardinha em azeite, foi avaliado com a metodologia ACV. O caso de estudo foi um produto de uma fábrica de conservas que usa o método tradicional. O desempenho ambiental das sardinhas em conserva foi analisado e comparado com outros produtos, como sardinhas congeladas e refrigeradas. Entre os diferentes produtos de sardinha, a melhor escolha para o ambiente seria sardinhas refrigeradas, apesar de que as sardinhas congeladas não representarem uma grande diferença. O custo ambiental de sardinhas em conserva é quase sete vezes maior por quilo de produto. As sardinhas em conserva em comparação com os outros produtos têm maiores impactes ambientais devido à energia e extracção de matérias-primas necessárias para produzir as latas de alumínio. O azeite teve uma elevada importância na avaliação global devido ao cultivo e à colheita das azeitonas. Desta forma, as acções para optimizar o desempenho ambiental das sardinhas em conserva seria substituir a embalagem e diminuir as perdas de azeite.
Devido às diferenças entre países, é necessário descrever os hábitos alimentares para dirigir mensagens aos consumidores. Através de um inquérito online foram verificadas correlações entre variáveis sócio-demográficas com a frequência do consumo de pescado, o conhecimento sobre pescado, e o interesse em obter informação sobre os produtos. As principais espécies consumidas são atum e bacalhau, o que está relacionado com conveniência e tradições alimentares. Os portugueses têm preferência por consumo de pescado em casa e preparado grelhado, o que revela diferenças culturais entre países. Apesar de terem um elevado conhecimento sobre pescado, um maior conhecimento não significa necessariamente escolhas mais sustentáveis. As diferenças entre os consumidores com maior e menor conhecimento sobre pescado estão relacionadas com as suas preferências de consumo. Os primeiros têm um uso mais diversificado de espécies e elevada prevalência de pequenos peixes pelágicos. Assim, um contributo para escolhas mais sustentáveis de pescado pode ser através da promoção de hábitos de consumo já existentes, que podem ser boas alternativas para o meio ambiente.
Os hábitos alimentares variam entre países e as recomendações devem ser desenvolvidas a nível nacional para que dessa forma haja maiores hipóteses de atingir os objectivos pretendidos. Os hábitos de consumo de pescado dos portugueses são em parte sustentáveis porque utilizam espécies de níveis inferiores na cadeia trófica marinha. A importância da sardinha e de outros peixes pequenos pelágicos entre os hábitos de consumo de pescado dos Portugueses são uma escolha sustentável e a ingestão de muitas espécies diferentes, além do peixe, é uma forma de evitar a pressão sobre os stocks das espécies marinhas e o risco associado à ingestão de substâncias tóxicas. A preservação de espécies de pequenos pelágicos em conservas, quando as outras formas de preservação não são possíveis, pode disponibilizar peixe para consumo humano impedindo que este seja desperdiçado ou usado ineficientemente como alimento de outros animais. No entanto, o consumo de sardinhas frescas ou congeladas representa as melhores escolhas do ponto de vista ambiental.
Contudo cada análise ambiental depende do que se compara. A produção de peixe em geral tem um melhor desempenho ambiental em comparação com a carne, mas tem restrições biológicas que limitam o seu crescimento. Para um consumo sustentável de pescado é necessário nutrir melhor com o peixe que já utilizamos, evitando desperdícios, e optar por espécies de níveis inferiores da cadeia trófica como mexilhões ou mesmo vegetais. Para além disso o pescado é apenas um ingrediente na dieta e um consumo sustentável não é alcançado se as outras alternativas resultarem em piores impactes para o ambiente.
Palavra chave: Pescado; Avaliação do Ciclo de Vida; Impactos Ambientais; Consumidores; Pesca; Sardinha; Conservas; Hábitos Alimentares.
III
Abstract
Seafood production from the sea is on its limit because of overfishing and environmental impacts, but consumer demand is increasing worldwide. Portugal is one of the countries with the highest seafood consumption per capita in the World. The aim of this thesis was to study the seafood consumption in Portugal to find its potential to sustainability. Four studies were developed independently, based on different methodologies including Life Cycle Assessment (LCA) and an internet-based survey. The Portuguese seafood consumption was analysed through time and it was found that it is not only driven by geography, fisheries, or resources availability. Food habits were also influenced by religion and politics. This explains that the main species is cod (salted and dried), representing around 40% of the Portuguese seafood consumption, although it does not exist in Portuguese waters. Sardine is among the species most consumed and it is the most important fish landed in Portugal. The sardine purse seine fishery is relatively efficient, both with regard to biotic and abiotic impacts, due to the schooling behaviour of the species. However stock variability and discards from slipping may be substantial. Small pelagic fish, as sardines, give large catches that can be difficult to use optimally. Canning is one way to preserve it and, canned sardines in olive oil were assessed and compared to other sardine products. The main actions to optimize the environmental performance of canned sardines would be to replace the packaging and to diminish the olive oil losses. Among different sardine products, chilled sardines performed best. Portuguese consumers have relatively high knowledge about seafood but it does not mean more interest about sustainability. Nevertheless Portuguese habits of eating small pelagic fish and different species can be sustainable choices. However seafood is only one ingredient within a diet and every environmental judgement depends on what we compare.
Keywords: Seafood; Life Cycle Assessment; Environmental Impacts; Consumers; Fisheries; Sardine; Canned; Food Habits.
IV
Acknowledgements
This study was funded by the Foundation for Science and Technology – Portugal (FCT) with a PhD grant (SFRH/BD/60187/2009), which support is gratefully acknowledged. I’m very grateful of having the opportunity to do this PhD in a field that joined two subjects that are fascinating to me: seafood and sustainability. Part of the work was also funded by a COST Action to a stay in Nofima, and COST Action Meeting to a conference in University of Barcelona. I would like to acknowledge the Swedish University of Agricultural Sciences for the opportunity to participate in the Ph.D. course “Aquaculture: ethical, legal, and social aspects” in Norway; and the Berlin-Brandenburg Academy of Sciences and Humanities for the workshop “Sustainable Aquatic Food” in Germany.
This PhD could not be accomplished without the valuable contribution of many people and institutions. I’m very thankful to my supervisors Henrique Cabral, Sofia G. Vaz, and Friederike Ziegler, for accepting to be my advisors and giving me support throughout the thesis. Sofia, I’m blessed that you believed on my ideas since the first moment that we met. Without your support, this thesis would never had happened but most of all, we would not share such a good time talking about interesting things. I’m sure we will finish more marathons together! Friederike, I could not be more grateful to have the chance to work with you. Since the first beginning you helped me with everything! Thank you for all professionalism, guidance, kindness and introduction to the fish LCA world. It was always fun to work with you, even during the most boring parts. I wonder how many other things I can do (besides dancing flamenco or live in a farm) which you have not already done!
Many people that I contacted during the thesis support me to pursue, sometimes it was a simple chat. Peter Tyedmers was the first milestone, his help and motivation were essential to build up the PhD proposal. At a certain time I was up in the north, near the North Pole, with Joop Luten and Themistoklis Altintzoglou, to who I’m very thankful for the good time we spent together. Themis, it was inspiring to work with you and I hope that we had done a pleasant “song” together. Thanks for your clear thoughts! I’m very grateful to fishermen, organizations officers, and companies who kindly agreed to answer the questionnaires and provide data: PROPEIXE, APROPESCA, APARA, ANOPCERCO, A Poveira, La Gondola, and Litofish. I want to thank you all the people related to the sardine sector for helping me: Sandra Farinha, Laura Wise, Ana Marçalo, Alexandra Silva, Leonor Nunes. I would like especially to acknowledge Agostinho da Mata, for being able to explain everything about the Portuguese sardine sector in such pleased talks; Elisabete Schiek, from PROPEIXE and Cecília Leite, from A Poveira, for their endless patience in helping with sardine processing industry data; and express my gratitude to Adriano Ribeiro from Jose Gourmet, for joyful
V
talks and enthusiasm about canned sardines and the good stuff from Portugal! Thanks to António Silva, from University of Coimbra, it was very interesting and challenging to discuss the importance of fish as cod with an anthropologist.
My lovely and sustainable colleagues from ECOMAN, thank you for making me feel “at home” in our little office on the other side of the river. It was always nice time spent with you, especially in those moments that I was struggling with the thesis. Please, just keep on thinking “out of the box”! In Sweden I had the best environment (indoor and outdoor) to develop the thesis; nearby the forest and Lotta at the reception, helping with everything that a non-Swedish can ask for! Fika was always cozy and cheerful with MUs colleagues, to who I’m very thankful. It made my days colorful, even during the darkness in the winter time.
Although as a PhD student most of time I had worked alone, I had always by my side other PhD students that for the best and the worst, we were together! Vanja, it was much fun to learn things with you about Portuguese fisheries and customs. Thanks for listening me about my worries so many times at the coffee, train, walking coming back home…we just missed the fishing boat together, I guess! Sara and Andreas thank you for your contribution with fruitful discussions and endless inputs, but also for being my best friends in Sweden. I had much fun with you and Sara’s little kids, bunny, frogs, together with marine biologist folks! Previously colleagues from K-team and IMM, I will always be grateful for the time we had worked together. Thanks Marta Agostinho for pushing me to the PhD “abysm”, you gave me always strength!
Family and friends in Portugal it would be difficult to refer all of you, but you are part important in most of the moments of my life. One beijo or kram to all of you and thank you for warming my life. Cientistas-de-pé, thank you for making me and people to laugh…even about the Portuguese seafood consumption! Stefan, thanks for showing me the beauty of the ocean again but also for sharing the life with me! To my father thankfulness for the moments we spent together under the sea, they still are my inspiration.
VI
List of Publications
This thesis is based on the work contained in the following papers:
Almeida., C., Karadzic., V., Cabral., H. and Vaz., S. 2014. Why do Portuguese eat so much seafood? – Driving forces and consequences. Submitted to Marine Policy.
Almeida, C., Vaz. S., Cabral, H. and Ziegler, F. 2014. Environmental assessment of sardine (Sardina pilchardus) purse seine fishery in Portugal with LCA methodology including biological impact categories. The International Journal of Life Cycle Assessment. 19(2): 297-306.
Almeida, C., Vaz, S. and Ziegler, F. 2014. Environmental life cycle assessment of a canned sardine product from Portugal. In press Journal of Industrial Ecology.
Almeida. C., Altintzoglou T., Cabral. H. and Vaz. S. 2014. Influence of consumer’s knowledge towards more sustainable seafood consumption in Portugal. Submitted to British Food
VII
List of Figures
Figure 1.1 Stakeholders in the seafood supply chain. ... 4 Figure 1.2 Seafood ranges from healthier to a riskier choice (Source: Joint FAO/WHO Expert Consultation on the Risks and Benefits of Fish Consumption, published by Patterson Clark at The Washington Post)... 15 Figure 1.3 Three market-based mechanisms: a) MSC certification (www.msc.org); b) Seafood Watch program seafood guide (www.seafoodwatch.org); c) a boycott initiative from Greenpeace to a Portuguese retailer. ... 16 Figure 2.1 Total production of seafood in Portugal (line) and individual production variation through the years for sardine, molluscs and cod (source: Fisheries statistics, INE). ... 42 Figure 2.2 Seafood production, imports and exports in Portugal between 1961 and 2007 (source: Food Balance Sheet, FAO). ... 43 Figure 2.3 Relative house-hold consumption of the main species in Portugal assuming a per capita consumption for Portugal of 55 kg from FAO for 2005 (adapted from Rodgers et al. 2008). ... 45 Figure 2.4 Apparent seafood consumption in Portugal between 1961 and 2007 (source: Food Balance Sheet, FAO). ... 48 Figure 2.5 The drivers and consequences of Portuguese seafood consumption changes (adapted from Kearney 2010). ... 53 Figure 3.1 System under study for sardine (purse seine figure adapted from www.seafoodscotland.org). The sample data for diesel, ice, lubricants and stock assessment was assessed for different years, from 2005 until 2011... 67 Figure 3.2 Fuel per landings of each vessel in the different years assessed (L- large; S – small and A – overall average). ... 69 Figure 3.3 Relative results of impact assessment of the process contribution (fuel, lubricant and ice) for each impact category for the overall purse seine fishery: acidification potential (AP), eutrophication potential (EP), global warming potential (GWP), ozone depletion potential (ODP) and energy use (E). ... 70 Figure 3.4 Global warming potential (GWP) average to land 1 kg of sardine for 2005 until 2011. ... 71 Figure 3.5 Global warming potential (GWP) average to land 1 kg of sardine for a quarter over one year on a large purse seiner (columns), average landing value (grey line) and total landings for the overall fleet (dark grey line) during the same period (INE 2012). ... 71 Figure 3.6 Sensitivity analyses for gear data of relative results of impact assessment for each impact category for the overall purse seine fishery: acidification potential (AP), eutrophication potential (EP), global warming potential (GWP), ozone depletion potential (ODP) and energy use (E). ... 72
VIII
Figure 3.7 Spawning stock biomass (SSB) (Age 1 and older) (left axis) and recruitment (F) (right axis) for the assessed fishing years for the Atlantic Iberian sardine stock (from ICES 2012). ... 72 Figure 3.8 Relative results of emissions of global warming potential (GWP) and lost potential yield (LPY) calculated for 20 years time perspective. ... 73 Figure 3.9 Mean trophic level (MTL) (left axis) and primary production required (PPR) (right axis) per landings for the assessed years... 75 Figure 4.1 Flow chart and system boundaries of canned sardines in olive oil life cycle with the principal production phases (dotted lines define the system boundaries and boxes represent processes). ... 90 Figure 4.2 Process relative contribution for canned sardines in olive oil production. ... 96 Figure 4.3 Comparison of GWP of one kg of edible sardine products at the store with the different life cycle phases. Canned sardine include olive oil and salt as part of the edible product. ... 100 Figure 4.4 Comparison of the GWP of one kg of edible product of canned sardines in olive oil using different packaging materials. ... 102 Figure 5.1 Relative frequency in occasions of seafood consumption in general, at different meals and different places; and in different preparation methods. ... 119 Figure 5.2 Consumers’ ranking on the importance of information to purchase decisions when buying seafood (seven point scale). ... 122 Figure 5.3 Means (standard deviation) of seafood consumption frequency per week per knowledge level on a seven point scale (all differences p < 0.05). ... 124 Figure 5.4 Means (standard deviation) of species consumption frequency per week per knowledge level on a seven point scale (* p < 0.05). ... 124 Figure 5.5 Means (standard deviation) of interest on information of respondents with high and low level of subjective knowledge on a seven point scale (all differences p < 0.05). ... 125
IX
List of Tables
Table 2.1 Animal food source consumption in Portugal and in the world by average for 2005 (kg/capita/year) (from FAOb). ... 45 Table 2.2 Trends in animal food products consumption in Portugal with kg per capita and the percentage of variability between periods (from National Health Surveys 1987 – 2006, INE). ... 49 Table 3.1 Inventory for fish landed in Portugal by purse seiners. Values per FU = 1 kg of sardines (standard deviation) of fish landed for the overall fleet and for different vessel size categories. ... 68 Table 3.2 Data from JRC for purse seine fishery in Portugal. Data for different years aggregated by size: small (0–12 m), large (12–40 m), and overall (0–40 m) (Anderson and Guillen 2010; Anderson et al. 2011, 2012). ... 77 Table 4.1 Inventory data for the canning process. ... 93 Table 4.2 Absolute results in total and per life cycle processes for one kg of edible product of canned sardine in olive oil. ... 98 Table 4.3 Results for one kg of edible product of sardines canned in olive oil, fresh, and frozen. ... 99 Table 4.4 Results for one kg of edible product of canned sardines in olive oil with different packaging materials. ... 102 Table 5.1 Socio-demographic characteristics of the sample (%, n = 1240). ... 118 Table 5.2 Frequency of seafood in consumption occasions per week (mean and standard deviation) and in live weight per year calculated with edible content conversion and assuming a portion size of 125 grams / week (* p < 0.05)... 120 Table 5.3 Characterization on subjective and objective knowledge about seafood (mean values and standard deviation) in a scale 1 to 7 (* p < 0.05). ... 121 Table 5.4 Different levels of subjective knowledge (mean values and standard deviation) in a scale 1 to 7 related to socio-demographic characteristics of the consumers. ... 123
X
List of Acronyms and Abbreviations
ASC Aquaculture Stewardship Council CFP Common Fisheries Policy
COOL Country-of-origin labelling
EPD Environmental Product Declaration
EU European Union
FAO Food and Agriculture Organization of the United Nations
GHG Greenhouse Gases
ICES International Council for the Exploration of the Sea ISO International Organization for Standardization LCA Life Cycle Assessment
MSC Marine Stewardship Council MSY Maximum Sustainable Yield NGO Non-Governmental Organization
SCP Sustainable Consumption and Production TAC Total Allowable Catch
TL Trophic Level
UN United Nations
UNCED United Nations Conference on Environment and Development WWF World Wildlife Fund
XI
Glossary of Terms
1
Aquaculture – The farming of aquatic organisms in inland and coastal areas, involving intervention in the rearing process to enhance production, such as regular stocking, feeding, protection from predators; and the individual or corporate ownership of the stock being cultivated.
By-catch - Part of a fishing catch taken incidentally in addition to the target species towards which fishing effort is directed. Some or all of it may be returned to the sea as discards.
Discards - That component of a catch thrown back after capture. Normally, most of the discards can be assumed not to survive.
Ecosystem - An organizational unit consisting of an aggregation of plants, animals (including humans) and micro-organisms, along with the non-living components of the environment.
Exclusive Economic Zone (EEZ) - A zone under national jurisdiction (up to 200-nautical miles wide) declared with the provisions of 1982 United Nations Convention of the Law of the Sea, within which the coastal State has the right to explore and exploit, and the responsibility to conserve and manage, the living and non-living resources.
Feed conversion ratio (FCR) - Ratio between the dry weight of feed fed and the weight of yield gain, it measures the efficiency of conversion of feed to fish (e.g. FCR = 2.8 means that 2.8 kg of feed is needed to produce 1 kg of fish live weight).
Landings - Weight of what is landed from a fishery at a landing site. It is different from the catch because it does not include discards.
Maximum Sustainable Yield (MSY) - The largest average catch that can be taken continuously (sustained) from a stock under average environmental conditions. It is often used as a management goal.
Overfished - A stock is considered overfished when its size falls below a minimum threshold. A rebuilding plan is required for stocks that are overfished.
1
XII
Overfishing - A generic term used to refer to the state of a stock subject to a level of fishing effort or fishing mortality such that a reduction of effort would lead to an increase in the total catch.
Quota - A share of the total allowable catch (TAC) allocated to an operating unit such as a country, a vessel, a company or an individual fisher (individual quota) depending on the system of allocation. Quotas may or may not be transferable, inheritable and tradable.
Stock - A group of individuals in a species occupying a well-defined spatial range independent of other stocks of the same species. Random dispersal and directed migrations due to seasonal or reproductive activity can occur. Such a group can be regarded as an entity for management or assessment purposes. The impact of fishing on a species cannot be fully determined without knowledge of the stock structure.
Target species - Those species that are primarily sought by the fishers in a particular fishery.
Total Allowable Catch (TAC) - It is the total catch allowed to be taken from a stock in a specified period (usually a year), as defined in the management plan. The TAC may be allocated to the stakeholders in the form of quotas as specific quantities or proportions.
1
Chapter 1.
General introduction
Prosperity consists in our ability to flourish as human beings within the ecological limits of a finite planet. The challenge for our society is to create the conditions under which this is possible.
From Prosperity without growth: Economics for a finite planet Tim Jackson (2009)
2
1.1 Food from the sea
Fisheries are the major food production that relies on wild natural resources. However, the food production from the sea has been limited by excessive fishing pressure, growing pollution, coastal degradation, climate change and other types of pressures (Garcia and Rosenberg 2010, Rice and Garcia 2011). The global catches are restricted by the marine production (Chassot et al. 2010) but fishing is exceeding that level and as a consequence the proportion of stocks fished above biologically sustainable levels is increasing (FAO 2014). Many fish stocks are exploited at levels in excess of their maximum sustainable yield (MSY). In European Union (EU) waters 86% of the populations regulated by Total Allowable Catches (TACs) present exploitation rates higher than the MSY given (Villasante et al. 2011). Therefore, 26% of stocks are overexploited or depleted in EU (EC 2012) and overall, the number of stocks fished at unsustainable levels is 29% (FAO 2014).
With the fish stocks being depleted, opportunities to expand harvests from fisheries are limited (Rice and Garcia 2011). The depletion of local fisheries makes the fleets of the main seafood markets (EU, Japan and USA) to search for new supplies beyond their waters (Swartz et al. 2010a). Globalization and improvements in transportation, packaging, and processing; increasingly facilitate imports of seafood from all over the world (Knudson and Peterson 2007, Miller et al. 2012a). Therefore this demand exerts pressure on different parts of the oceans due to intensive practices (Villasante et al. 2012) and ambiguous fisheries protocols between countries (Corten 2014). Along with the continuously technological improvements to fish deeper and in new grounds, the marine biodiversity is being threatened with unpredictable consequences (Swartz et al. 2010b).
At the same time, research is improving the knowledge about the species biology, which is used for management purposes through for example, scientific advices that is applied as TACs by governmental organizations. Nevertheless scientists deal with natural systems, which have intrinsic uncertainty, added by low reliable data as often fisheries landings do not reflect total catches (Blanco et al. 2007, Garcia and Rosenberg 2010). Discards and by-catch are usually not included in the data sets but for some fisheries, such as demersal trawling, they represent a significant part of
3
the catch, reaching 83% of the capture (Kelleher 2008). Moreover an ecosystem-based management could be a more realistic approach compared to the emphasis in a single target species (Heupel and Auster 2013). Nevertheless, even with scientific advices, governments apparently fail to deliver sustainable fisheries management (Mitchell 2011). The collapse of Grand Banks cod stocks in Newfoundland, in the early 1990s, was the first case whether it was recognized that scientifically based management was not effective (Agnew et al. 2014). The situation had enormous economic consequences not completely recovered yet, especially for the coastal communities, with thousands of people losing their jobs (Brunner et al. 2009).
Moreover, although the supply of seafood from fisheries has been steadily declining after reaching a peak in 1996, with 9 kg per capita, the seafood demand continues to increase (FAO 2010). The world average consumption of seafood doubled in 20 years, reaching 19 kg per capita in 2012 (FAO 2014). This increase comes mostly from aquaculture, which is growing at a rate of 7% annually and represents already 42% of the global seafood supply (FAO 2014, Tacon and Metian 2013).
Aquaculture is growing faster than any other food-producing sector (Garcia and Rosenberg 2010). Yet, several environmental challenges may limit its future growth (Péron et al. 2010). Aquaculture production discharges effluents, spreads aquatic pathogens and invasive species, and alters habitats with the related loss of ecosystem services (Jonell et al. 2013). A major constraint of aquatic farming is the reliance on wild fish for fishmeal, with subsequent protein inefficiency (Alder et al. 2008, Solér 2012). Around 30% of total catch fish landings goes for fishmeal or fish oil products that are used as feed in other human food systems (e.g. fish, poultry, pigs) (Naylor et al. 2009). It is especially the case of pelagic forage fish (e.g. anchoveta, herring, sardines) that by economic constraints from the free market access of industrial fishing companies, are used into fishmeal and fish oil competing with their use in direct human consumption (Tacon and Metian 2009). The ratio of wild fish input in farmed fish has fallen but, the consumption of fish oil in particular is determinant to the sector’s demand on wild fish resources (Naylor et al. 2009). In average, it is needed 4 to 5 kg of forage fish to produce 1kg of fishmeal and the ratio for fish oil is between 20 to 25 kg of forage fish to obtain 1 kg
4
of fish oil (Péron et al. 2010). The resources needed are more intensively to produce carnivorous fish (e.g. salmon) or species that rely on heavy energy nutrient feeds (e.g. shrimp) (Duarte et al. 2009). However, they are also used to produce herbivorous freshwater species like carp (Péron et al. 2010), because it is greatly produced in China, a country that corresponds to 62% of the aquaculture production worldwide (FAO 2014). For aquaculture to become more sustainable it needs to be less dependent on whole wild fish and to modify culture species and practices, which, in turn, will require influencing consumer preferences (FAO 2014).
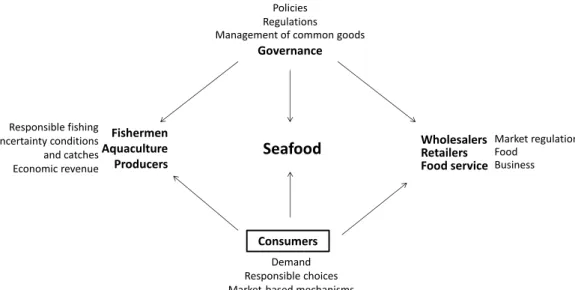
Consumers are on the other side of the production and their demand is at the end of the seafood supply chain (Fig. 1.1). Both roles are interconnected since fishermen fish whatever the demand is and at the same time are regulated by policies. Restaurants and retailers directly respond to consumer demands but have also the potential to influence consumers about seafood from sustainable sources (Peterson and Fronc 2007). Restaurant menus for example, evidenced that when coastal resources were not available anymore, large pelagic fish were served instead (van Houtan et al. 2013). Moreover the seafood consumption trends are shifting all the time and are also dependent on many different factors, which influence the consumption behaviour in general, making the seafood consumption a complex issue which includes a combination of different research areas.
Figure 1.1 Stakeholders in the seafood supply chain.
Responsible fishing Uncertainty conditions and catches Economic revenue Retailers Governance Seafood Fishermen Aquaculture Producers Consumers Food Market regulations Policies Regulations Management of common goods
Demand Responsible choices Market-based mechanisms Business Wholesalers Food service
5
Improvements in the seafood consumption could result in bottom-up inducement, opposing to the production that functions as top-down mechanism. However research remains to be done to understand how the consumers demand affects the supply chain and in which way it can change to more sustainable consumption. This thesis is a contribution to the knowledge on sustainable consumption and production, focusing on seafood and consumers’ demand. It has an interdisciplinary approach to understand how the consumers can contribute to sustainability. The context is Portugal, which is a country with one of the highest seafood consumption per capita in the world. The thesis examines the seafood consumption habits, uses Life Cycle Assessment (LCA) methodology to assess the environmental impacts of food production, and surveys consumers to characterize their seafood choices and understand how to communicate sustainability. By seafood it includes fish, shellfish, algae, from wild and farmed production sources, and from marine or freshwater origins.
1.2 Food production and consumption: Two sides of sustainability
1.2.1 The concept of sustainability
Sustainability relates to environmental, economic and social prosperity. In 1992 at the United Nations Conference on Environment and Development (UNCED) in Rio de Janeiro sustainable consumption and production (SCP) was recognized as linking environment and development (UN 1992). Two years later in Oslo, a definition of SCP was agreed as “use of services and related products, which respond to basic needs and bring a better quality of life while minimising the use of natural resources and toxic materials as well as the emissions of waste and pollutants over the life cycle of the service or product so as not to jeopardise the needs of future generations” (Norwegian Ministry of Environment 1994). In 2002, at the World Summit on Sustainable Development the world leaders signed the Johannesburg Declaration, recognizing that changing consumption and production patterns was the base for the economic and social development (UN 2002). The
6
declaration says that “fish stocks continue to be depleted” and “the adverse effects of climate change are already evident, natural disasters are more frequent and more devastating, and developing countries are more vulnerable”.
After these statements it is globally recognized that we do need to protect ecosystems and biodiversity to feed the world (Munang et al. 2011). However, different problems need to be solved simultaneously, such as to end hunger and raise food production, while reducing agriculture’s damage to the environment (Foley et al. 2011). Even though, the motivation for sustainability is not straightforward because the individual choices are embedded in the social and institutional contexts (Jackson 2005). It is particularly challenging that consumption can be more than just essential needs, such as food; it may also be a way to achieve status and goods that position individuals on society (Shove and Pantzar 2005).
1.2.2 Environmental impacts from food production
The food system as a whole; including production, distribution and consumption; contributes between 15 to 28% of overall greenhouse gas (GHG) emissions (Garnett 2013a). In the EU, food and drinks consumption represent around 20 to 30% of the environmental impacts from household consumption (Tukker et al. 2006) and on average the impact of food per person is estimated as 7.7 kg CO2 eq-1.day (Virtanen et al. 2011). Apart from emissions, there are other important environmental impacts related to agriculture expansion and its land use, such as biodiversity loss, and the consequently destruction of habitats as deforestation (Rands et al. 2010). Of particular concern is the freshwater withdrawals devoted to irrigation (Vanham et al. 2013) and the disruption of the global nitrogen and phosphorus cycles due to fertilizers use, manure application, and leguminous crops (Foley et al. 2011).
The majority of environmental impacts from food are usually in the production phase (Garnett 2011, Virtanen et al. 2011, Infante Amate and González de Molina 2013). The intensification of food farming dramatically increased and is largely responsible for GHG emissions as such as methane,
7
from livestock, and nitrous oxide, from fertilized soils (Foley et al. 2011). The food transportation accounts on average for only 11% of the carbon footprint of food (Nijdam et al. 2012). The amount also depends on the type of transport, since large ships have lower energy use compared to other transports, such as road transport and aircraft-freighted, which has the highest energy use per amount of food transported (Vázquez-Rowe et al. 2012). Nevertheless, larger environmental and economic gains would result from reducing food waste, increasing the food available (Garnett 2008, Foley et al. 2011). Food waste occurs at several stages within the food supply chain, from harvesting to consuming, and accounts between 10 to 40% of all food produced, including fish waste from fisheries by-catch (Parfitt et al. 2010, Pelletier et al. 2011).
Compared to other animal production, fisheries also contribute to GHG emissions but in a lower extent. They are strongly dependent on fossil fuel and as Tyedmers et al. (2005) calculated, fisheries use circa 1.2% of the global fuel use. In general capture fisheries and some extensive aquaculture present the lowest ecological foot print of animal protein production (Garcia and Rosenberg 2010, Nijdam et al. 2012). In most of the seafood products, the fishery phase is responsible for around 75% of the total energy consumption in the life cycle (Thrane et al. 2009, Ziegler et al. 2013). Nevertheless, fisheries are enormously diverse, varying from artisanal fleets to highly industrialized vessels equipped with cutting-edge technology. Furthermore the fuel use intensity is influenced by numerous factors such as fishing gear, target species, structure and vessel size, distance to the fishing ground, decisions on-board or stock abundance (Basurko et al. 2013, Ziegler and Horborn 2014).
1.2.3 Consumer choices
The consumers’ dietary choices are determinant for food systems sustainability and to change them when they are not sustainable, can be extremely positive for the environment (Pelletier et al. 2011). Consumers seem to underestimate their ecological impact from food choices comparing to other environmental behaviours, such as reducing waste or saving energy (Vanhonacker et al. 2013). A
8
multitude of studies tend to address technological potential to mitigate environmental impacts from food, but few focus on achievements in changing consumers’ behaviours (Garnett 2011).
Beef and dairy products production have the greatest global warming potential impacts, between 4 to 12%, and livestock feed requires the use of large amounts of land, water, fertilizers, fossil energy, and emissions of various forms of nitrogen (Tukker et al. 2006, Westhoek et al. 2011). Therefore to change personal choices, as to reduce meat consumption, is the most important variable to decrease GHG emissions from food and land requirements, now used to grow animal feed (Leip et al. 2010, Hallström et al. 2014, Hedenus et al. 2014). Lappé already in 1971 put it like that: “there is an inefficient food policy that allows the production system to take abundant grain, which hungry people cannot afford, and shrinks it into meat, which better-off people will pay for”.
Human diet has undergone significant changes in the recent decades (Infante Amate and González de Molina 2013). With globalization, the way we produce and consume food is ever more disconnected, but food emissions need to be addressed together, avoiding the displacement elsewhere in the life cycle (Garnett 2012). Modern food is highly processed, with long shelf-life, because technological innovations in food systems in the 1960s enabled to produce increasing quantity and variety of foods that are sold at lower prices (Cutler et al. 2003). Therefore with less time to prepare food at home, ready prepared food are more attractive to consumers and cooking skills, usually related with healthier food choices, tend to disappear (Cheng et al. 2007, Hartmann et al. 2013). Moreover the increase of food choices and cheaper prices in industrialised nations encourages wasteful behaviours of consumers (Parfitt et al. 2010).
The substantial contribution of meat and dairy in the Western lifestyle diets is followed by other countries wherever economic growth occurs (Speedy 2003, Gerbens-Leenes et al. 2010). The amount of meat and milk consumed in developing countries is projected to grow three times between 1997 and 2020 but still, it will be three times lower than it is in developed countries (Delgado 2003). Consumers from developed countries should take solid steps to modify their consumption, for environmental reasons but also, for an equitable and responsible use of resources
9
(Garnett 2013b). In this way, it is important to account for possible rebound effects, whereby GHG emissions reduction through encouraging behaviour change are not realised in practice, or even increased by compensating with other behaviours that have higher impacts (Druckman et al. 2011). Indeed, it is imperative that fish does not take the place of meat in people’s diets; otherwise it increases even more the pressure on fish stocks (Garnett 2011).
1.3 Life Cycle Assessment applied to seafood
Life Cycle Assessment is a methodology that emerged as the most widely used methodology to analyse environmental impacts of food products (Pelletier et al. 2011). It gives broad and visible information regarding the origin of the products, processing, and traceability of distribution to retailers and consumers (Vázquez-Rowe et al. 2011). It is an ISO-standardized framework, that develops ‘‘cradle-to-grave’’ life cycle profiles, accounting the potential environmental impacts associated with the energy, emissions and resources consumed (Pelletier and Tyedmers 2008). A LCA study comprises four main phases: 1) goal and scope definition; which describes the product, processes included, system boundaries, and functional unit; 2) inventory analysis; to collect the data on resources use and emissions; 3) impact assessment; which aggregates the potential impacts in selected environmental categories such as climate change, acidification, or aquatic eco-toxicity; and 4) interpretation of the results; made in accordance to defined goal and scope (EC-JRC 2012). The values for each impact category are converted into indicators. For example, all GHG are grouped under the climate change impact category and then in the form of a single indicator as global warming potential (GWP), which harmonises inputs to an equivalent of kg of CO2, often known as the carbon footprint (e.g. 1 CO2=1 kg CO2 eq, 1 CH4=25 kg CO2 eq) (EC 2010). The phases are all iterative and reviewed until the study is finished so the results become coherent with the goal and scope that defined the study. For example, a LCA study with the goal to obtain the carbon footprint for the functional unit of one kilo of sardine, needs to define the scope of the study related to
10
boundaries of framework, processes, area of the study, and type of fishery. Then the inventory phase collects the data that constitute the inputs and outputs. The data from the impact assessment phase are aggregated and all emissions contributing to GWP are given in an amount of CO2 kilos equivalence to produce one kilo of sardine, under the delimitations and assumptions of the study. Seafood LCAs have shown that fishing operations are the main contributor to environmental impacts from fishery products (Avadí and Fréon 2013). The fuel use by fishing vessels typically accounts for the majority of the life cycle GHG emissions of seafood and as such, it is a relatively reliable indicator of the carbon footprint of landed, unprocessed fish (Parker et al. 2014). Other contributors to GHG emissions from fisheries, but in a smaller level, are cooling agent leakage, which can represent 13% of the total emissions (Iribarren et al. 2011). Demersal fisheries in general use more fuel and emit more refrigerants per kg of fish due to the non-schooling nature of demersal species (Ziegler and Hornborg 2014). Purse seine fisheries show the lowest fuel use intensity, especially when they are compared to trawling within the same target species, as it was seen for horse mackerel (Vázquez-Rowe et al. 2010). For Atlantic herring it was obtained five-fold lower fuel use with purse seine compared to trawling (Driscoll and Tyedmers 2010). The reverse is that, for lower fuel consumption fisheries, other operations such as ice and net production, or boat painting; may become more important to the overall assessment (Ramos et al. 2011, Vázquez-Rowe et al. 2010).
A high variability in fuel use was seen also within one fishing technique depending on the circumstances under which it is used (Ziegler et al. 2013) or target specie (Parker et al. 2014). Moreover, despite operating the same fishing gear, each vessel behaves differently depending on the skipper decision (Bazurko et al. 2013). Ramos et al. (2011) evaluated the impacts on a temporal basis for Atlantic mackerel purse seine fishery and found that pelagic species can be considerable influenced by the stock condition. However, most fishery LCA studies still fail to analyse stock assessment or other ecosystem aspects, such as discards (Vázquez-Rowe et al. 2012). It is difficult to quantify for those direct impacts and to combine LCA results with biological indicators. Nevertheless, fishery-specific impact categories have been developed, namely seafloor disturbance, discards and
11
by-catch (Ziegler et al. 2003). Emanuelsson et al. (2014) suggested lost potential yield (LPY) as a category to quantify overfishing. If these impact categories are included in the LCA study, they can contribute to a more accurate assessment.
The results from LCA of seafood can also be used for policy purposes by considering GWP and incorporating fuel use as an additional aspect into fisheries management (Schau et al. 2009, Farmery et al. 2014, Ziegler and Hornborg 2014). More effort, and thereby fuel use, has to be spent to land fish from an overfished stock or a destructive fishing method, in terms of by-catch, discards, and seafloor impacts (Ziegler et al. 2013). Nevertheless, seafood LCAs studies give a limited picture of fisheries because they are mainly focused in European fisheries and in the Atlantic Ocean and North Sea, seldom in African waters or other oceans that are an important source of seafood worldwide (Avadí and Fréon 2013). Likewise for seafood originated from aquaculture, LCA studies do not cover homogeneously the global production. Apart from salmon (e.g. Pelletier and Tyedmers 2007, Winther et al. 2009, Ziegler et al. 2013), there are few LCAs related to other species widely consumed such as catfish (Pangasius) (e.g. Bosma et al. 2011), tilapia and carp (e.g. Mungkung et al. 2013), or shrimp (e.g. Cao et al. 2011). Moreover, the bulk of the aquaculture production occurs in Asia (88%), with inland and freshwater species (FAO 2014). In general, extensive aquaculture entails lower contribution to the total carbon footprint compared to intensive aquaculture, which have an opposite performance (Iribarren et al. 2010b). The amount and type of feed is what usually dominates most of the environmental impacts from aquaculture production, as it was seen for salmon (Ziegler et al. 2013), catfish (Bosma et al. 2011), and shrimp (Cao et al. 2011).
The supply chain after the fishery is ever more covered with LCA studies that analyse post-landing phases or processed seafood products (e.g. Ziegler et al. 2003, Iribarren et al. 2010a, Vázquez-Rowe et al. 2012). The LCA research can identify critical aspects or “hot spots” of production systems that contribute to the environmental impacts (Pelletier and Tyedmers 2008). A LCA study of canned tuna, up to the point of household use, had a carbon footprint largely associated with the fishing stage and the production of the tin cans (Hospido et al. 2006). Moreover the high variability found in the
12
consumption phase demonstrated that the consumer choices influence the sustainability of the overall food consumption (Vázquez-Rowe et al. 2013). Different choices represent different environmental impacts and even within the same species, there is a large magnitude of environmental impacts depending on the source.
The communication of LCA results can be carry out for a specific good or service as an Environmental Product Declaration (EPD) or used as a “carbon footprint” (EC-JRC 2012). However, public understanding of results from LCAs and carbon footprints is still limited. Consumers are not enough informed to substitute products through carbon-based value judgements (Gadema and Oglethorpe 2011). In contrast to LCA results, consumers often consider more obvious, even if wrong, that the transportation distance is worse than the transportation mode (Kissinger 2012). Or they prefer locally grown food even though it is not always better for the environment, as some regions in the world employ more energy practices than others (Hartikainen et al. 2013). To improve the situation consumers need more information like e.g. a way to compare and make trade-offs from carbon footprints labels (Upham et al. 2011). An option could be a carbon tax for food that would increase the price of products with higher carbon footprints, and therefore make it less attractive for consumers (Tobler et al. 2011). Nevertheless, carbon footprints only relate to GHG emissions. Other environmental indicators, such as water use or biodiversity loss, are not included but are equally important when comparing different food production systems (Galli et al. 2012).
1.4 Overview about seafood consumption
1.4.1 Seafood demand worldwide
According to FAO (2014), in 2010 the total captured and farmed aquatic animal food products accounted for 17% of global population’s intake of animal protein, which can be as high as 50% for some coastal developing states. Seafood consumption has been increasing due to a growing worldwide population together with an increase in consumption per capita. The consumption of
13
animal food products raise as people’s income increases (Delgado 2003). At the same way, fish consumption across the globe is influenced by indicators of modernization, in particular economic development (York and Grossard 2004). There is an increasing demand from developing economies that cannot be met with the seafood produced that is essential to human nutrition asset or as local food security (Brunner et al. 2009, Jenkins et al. 2009). The globalization shifts seafood products away from poorer consumers to those with greater ability to pay (Garcia and Rosenberg 2010, Villasante et al. 2012). In China for example, seafood consumption is associated with luxury and social status (Fabinyi 2012). The transitional economic environment of the country have dramatically changed seafood consumption pattern, from 4.5 kg of seafood consumed per person, in 1970, to 31 kg in 2009 (Hu et al. 2014). With its large population, this consumption per capita puts an enormous pressure on the seafood supply. With limited seafood both from wild and farmed sources, it raises the need to balance the distribution of seafood resources worldwide.
Nevertheless, even if consumers are aware about the environmental impacts from seafood production, it is difficult to take responsible seafood choices by the fact that seafood products are traded from many parts of the world. Mislabelling is a threat to consumers’, especially when products are commercialized already processed or prepared, as Miller and Mariani (2010) study showed that 25% of the haddock products were labelled as cod in Ireland. The seafood that is commercialized need to be under regulations to guarantee that the stocks are managed and fishing has regular control, but policies do not take action in a global perspective (Brunner et al. 2009). Therefore Illegal, Unreported and Unregulated (IUU) fish are available in markets and contribute as a source of uncertainty to fisheries management (Garcia and Rosenberg 2010). In general, consumer concerns associated to environment are related to wild vs. farmed origin of seafood, and despite mandatory indication on seafood labels in Europe, consumers are not aware of the origin of fish (Verbeke et al. 2007, Altintzoglou et al. 2011).
The increase in demand is believed by some to be met by better management, namely through an ecosystem based approach, allowing marine ecosystems to remain natural functioning systems,
14
together with more efficient fisheries and waste reduction (Frid and Paramor 2012, Hilborn and Tellier 2012, Merino et al. 2012). At the same time, to minimize environmental impacts coming from aquaculture, it would be necessary to increase integration with food production on land, reduce animal feeds reliance on wild fish, and enhance the production of edible macroalgae and of filter-feeder organisms (e.g. mussels) (Duarte et al. 2009). Within the whole food supply, seafood has benefits when comparing fish farming to land-based animal food production since it uses less water, releases less antibiotics and fertilisers, and has lower impacts on biodiversity (Westhoek et al. 2011). Moreover, regarding to GHG emissions, farmed fish is comparable to poultry, since fish convert more efficiently feed into meat2 (Ellingsen and Aanondsen 2006, Winther et al. 2009).
1.4.2 Consumer recommendations
Seafood is an excellent source of protein, vitamins, minerals; low in saturated fats and a primary source of omega-3 fatty acids (McManus et al. 2011). Recommendations say that aquatic food products represent highly nutritious and healthy food (Tacon and Metian 2013). In addition the regular consumption of the mixed components in seafood protects against a number of health conditions (McManus et al. 2010, Lund 2013). On the other hand, high seafood consumption also presents risks related to contamination of methylmercury (MeHg) and other toxic compounds as polychlorinated biphenyls (PCBs) (Brunner et al. 2009). High levels of MeHg are found usually in predatory species because they accumulate up in the marine food chain, with a potential risk for regular or excessive consumers of these species (e.g. tuna, swordfish, or shark) (Karimi et al. 2012, Olmedo et al. 2013) (Fig. 1.3). Moreover high levels of toxins such as PCBs can be found in farmed salmon because organic contaminants accumulated in fish feed, pass through the feeds to salmon (Hites et al. 2004).
2Fish are cold blooded organisms that do not require energy to maintain body temperature and livein a three dimensional environment, using less energy to move themselves and occupying less area.
15
Figure 1.2 Seafood ranges from healthier to a riskier choice (Source: Joint FAO/WHO Expert Consultation on the Risks and Benefits of Fish Consumption, published by Patterson Clark at The Washington Post3).
Consumers need to balance health benefits against potential risks of seafood, which stresses the importance of communicating species specific advices for particular groups as children and pregnant women or in childbearing age (Ström et al. 2011, Masley et al. 2012). Consuming moderate levels of seafood would be the best way to obtain the nutritional benefits while remaining below safety limits of pollutants associated with seafood (Sirot et al. 2012). What most advices say is to eat at least two portions of fish per week, particularly fatty fish, and to diversify the species as much as possible (Kris-Etherton et al. 2002). However, the healthy benefits from intake of omega-3 fats have encouraged seafood consumption (Peterson and Fronc 2007, McManus et al. 2011). Recommendations in USA say to increase seafood intake (Oken et al. 2012) but those dietary recommendations are not sustainable if seafood needs are inherently dependent on the rest of the world, as it happens for example in Europe (Mitchell 2011). The problem is that recommendations usually consider nutritional, ecological or economic viewpoints of seafood separately and in the end the advices are fragmented and sometimes in conflict, influencing decision-making in different directions (Hicks et al. 2008, Silbernagel et al. 2011, Oken et al. 2012).
3 Eat more fish; risks overstated in