Genome-scale Metabolic Network Reconstruction of
Polaromonas sp. strain JS666: Analysis of cDCE
Degradation Rates and Design of Experiments for
Bioremediation Improvement
A thesis submitted in conformity with the requirements for the degree
Master of Science in Biotechnology
Supervisor: Dr. Moritz von Stosch, Ph.D. Researcher, FCT-UNL
Co-supervisors: Prof. Dr. Rui Oliveira, Associated Professor, FCT-UNL
Dr. Anthony Danko, Ph.D. Researcher, FE-UP
Jury:
President: Prof. Dr. Pedro Simões
Examiner: Prof. Dr. Ana Teixeira
September, 2015
André Catarino Guerra
iii Genome-scale Metabolic Network Reconstruction of Polaromonas sp. strain JS666: Analysis of
cDCE Degradation Rates and Design of Experiments for Bioremediation Improvement
Copyright © - André Catarino Guerra, Faculdade de Ciências e Tecnologia, Universidade Nova de Lisboa.
A Faculdade de Ciências e Tecnologia e a Universidade Nova de Lisboa tem o direito, perpétuo e sem limites geográficos, de arquivar e publicar esta dissertação através de exemplares impressos reproduzidos em papel ou de forma digital, ou por qualquer outro meio conhecido ou que venha a ser inventado, e de a divulgar através de repositórios científicos e de admitir a sua cópia e distribuição com objetivos educacionais ou de investigação, não comerciais, desde que seja dado crédito ao autor e editor.
Copyright © - André Catarino Guerra, Faculty of Sciences and Technology, New University of Lisbon.
‘Su corazón fue un campo Ebrio de hierbabuena
v
Acknowledgments
First of all, I would like to offer my gratitude towards my supervisor Dr. Moritz von Stosch for all the given help and guidance and towards Dr. Rui Oliveira for having me in the SBE group.
I also would like to thank everyone in the Systems Biology and Engineering group that helped me in this project. Especially, Rui Portela, Mauro Luis, Rodolfo Marques and Cristiana Azevedo. I’m
grateful for all the given knowledge and free humor on the Office 334.
Also, I would like to demonstrate my gratitude to Dr. Anthony Danko for his interest on the continuity of my project.
vii
Abstract
Release of chloroethene compounds into the environment often results in groundwater contamination, which puts people at risk of exposure by drinking contaminated water. cDCE (cis-1,2-dichloroethene) accumulation on subsurface environments is a common environmental problem due to stagnation and partial degradation of other precursor chloroethene species. Polaromonas sp. strain JS666 apparently requires no exotic growth factors to be used as a bioaugmentation agent for aerobic cDCE degradation. Although being the only suitable microorganism found capable of such, further studies are needed for improving the intrinsic bioremediation rates and fully comprehend the metabolic processes involved. In order to do so, a metabolic model, iJS666, was reconstructed from genome annotation and available bibliographic data. FVA (Flux Variability Analysis) and FBA (Flux Balance Analysis) techniques were used to satisfactory validate the predictive capabilities of the iJS666 model. The iJS666 model was able to predict biomass growth for different previously tested conditions, allowed to design key experiments which should be done for further model improvement and, also, produced viable predictions for the use of biostimulant metabolites in the cDCE biodegradation.
ix
Resumo
A libertação no ambiente de compostos clorados derivados do etileno muitas vezes resulta em contaminação de águas subterrâneas, o que coloca as pessoas em risco de exposição por beber água contaminada. A acumulação de cDCE (cis-1,2-dicloroeteno) nas águas subsuperficiais é um problema ambiental recorrente, devido à estagnação e degradação parcial de outras espécies precursoras deste cloroeteno. A estirpe Polaromonas sp. strain JS666 aparentemente não requer
factores de crescimento adicionais para ser utilizada na biodegradação aeróbia do cDCE. Apesar de ser o único microrganismo encontrado capaz de tal degradação, são necessários mais estudos para a melhoria das taxas de biorremediação intrínsicas e para compreender plenamente os processos metabólicos envolvidos. Com esse intuito, o modelo metabólico, iJS666, foi reconstruído a partir da prévia anotação do genoma e dados bibliográficos disponíveis. As técnicas de FVA (Análise à Variabilidade dos Fluxos) e FBA (Análise ao Balanço dos Fluxos) foram utilizadas para validar satisfatoriamente as capacidades preditivas do modelo iJS666. O modelo iJS666 foi capaz de prever o crescimento da biomassa em diferentes condições previamente testadas, permitiu projectar experimentos-chave que devem ser realizados para melhorar as capacidades predictivas do modelo e, também, preveu o uso de compostos viáveis para servirem de bioestimulantes na biodegradação cDCE.
xi
Table of Contents
Acknowledgments ... v
Abstract ... vii
Resumo ... ix
Table of Contents ... xi
List of Figures ... xiv
List of Tables ... xvi
Abbreviations ... xviii
1. Introduction ... 20
1.1. Chlorinated Ethenes: A Worldwide Pollution Problem 20 1.2. (Bio)remediation of Chlorinated Ethenes 21 1.3. Polaromonas sp. strain JS666 24 1.4. Genome-scale Metabolic Modeling 28 1.4.1. GENRES: Genome-scale Metabolic Network Reconstructions 28 1.4.2. GEMS: a Constraint-based Approach 30 1.4.3. Genome-scale Metabolic Networks in Bioremediation 33 1.5. Dissertation Overview 35 2. Methods ... 36
2.1. Hardware and Software Environment 36 2.2. Genome-scale Metabolic Network Reconstruction 36 2.2.1. Automated Draft Reconstruction 36 2.2.2. Manual Refinement 37 2.2.2.1. DNA, RNA and Protein Coefficients ... 38
2.2.2.2. Membrane Phospholipid Composition ... 40
2.2.2.3. GAM and NGAM Balance ... 40
2.2.2.5. Model Compartmentalization and Transport Reactions ... 41
2.2.3. Metabolic network debugging 42 2.2.3.1. Confidence score ... 42
2.2.3.2. Pathway Gap Filling ... 43
2.2.3.4 Stoichiometric inconsistencies and cyclic infeasibilities ... 44
2.2.3.5. Initial Growth Testing ... 44
2.3. Model Validation 46 2.5. Analysis of cDCE degradation in iJS666 model 47 2.6. Biostimulants prediction using iJS666 model 48 3. Results and Discussion ... 50
3.1. The iJS666 Model 50 3.1.1. Main Characteristics of iJS666 GENRE 50 3.1.2. Confidence Score and Robustness Analysis 53 3.2. iJS666 model correlation to Polaromonas sp. strain JS666 55 3.2.1. Culture Growth vs Model Growth 55 3.2.2. cDCE degradation on iJS666 model 61 3.3. Metabolites for Biostimulation 70 4. Conclusion ... 72
4.1. Further Research 73 Assay for quantitative determination of glutathione and glutathione disulfide levels using enzymatic recycling method 73 6. References ... 74
7. Supplementary Data ... 80
7.1. Supplementary Data 1 80
7.2. Supplementary Data 2 120
List of Figures
Figure 1.1. Bioaugmentation using Dehalococcoides spp. for site cleanup. Adapted from
Lyon & Vogel, 2013. ... 22
Figure 1.2. Representation of chloroethene groundwater contamination. Adapted from
Jennings, 2008. ... 23
Figure 1.3. 16S rRNA phylogenetic tree of Polaromonas spp. Bootstrap values for 100 trials
and the percentage of variation in sequence identity are both shown in the figure. Adapted
from Osborne et al., 2010. ... 25
Figure 1.4. Simplified pathway(s) of cDCE degradation in Polaromonas sp. strain JS666.
Blue arrows represent pathways that were confirmed with biochemical evidence. Black
arrows indicate pathways supported by iTRAQ study. Dotted arrows indicated proposed
and not yet confirmed reactions. Genes involved in the reactions are represented bellow the
arrows and the generic terms on top. From Cox, 2012. ... 27
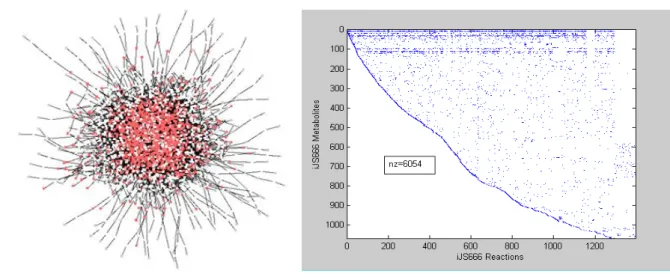
Figure 3.1. Representation of iJS666 network in Cytoscape (left) and the respective
stoichiometric S matrix (right)... 50
Figure 3.2. Affiliation of intracellular reactions to the different major metabolic pathways.
51
Figure 3.4. Robustness analysis of the iJS666 model. Substrate was set to be D-glucose and
biomass equation was set as objective function. ... 54
Figure 3.5. Influence of the specific substrate consumption rate on the specific growth rate
in the iJ666 model predicted by FBA with biomass maximization as objective function. The
last value represented in each individual plot corresponds to the extrapolated specific
growth rate ... 59
Figure 3.6. Influence of the specific substrate consumption rate on the specific oxygen
consumption rate in the iJS666 model predicted by FBA with biomass maximization as
objective function. The last value represented in each individual plot corresponds to the
extrapolated specific growth rate. ... 60
Figure 3.7. FBA and FVA of intracellular iJS666 reactions. Red stars blue points represent
minimal and maximal FVA predicted values. Yellow squares represent the flux values
acquired from FBA with the biomass production set as objective function and with Rs=0.561
xv Figure 3.8. Glutathione influence on the specific growth rate (left) and specific oxygen
consumption rate (right). ... 64
Figure 3.9. Influence of NGAM, GAM and different types of cDCE and chloride transporter in
the specific growth rate (Biomass as objective and Rs=0.561 mmol gDW-1 h-1). ... 67
Figure 3.10. Predictions made by the iJS666 model for the specific growth rate (left) and
sulfur consumption rates (right) using the following sulfur source: 1 - Sulfate; 2 -
Thiosulfate; 3 – Sulfite; 4 - Hydrogen Sulfide; 5 - Elementar Sulfur. The predicted hydrogen
List of Tables
Table 1.1. The 25 Most Detected Pollutants at Waste Sites in North America and Europe.
Adapted from Alvarez & Illman, 2006. ... 20
Table 1.2. Properties of Chlorinated Ethenes. Adapted from Löffter et al., 2013; Kh–Henry’s
Law Constant; AOTC – Air Odor Threshold Concentration; MCL – Maximum Concentration
Level. ... 21
Table 1.3. Visual comparison between some of the most used GENRES predictive software
packages. The displayed stages and steps arise from Thiele & Palsson, 2010. From Hamilton
& Reed, 2014... 29
Table 2.1 Major macromolecules of biomass composition in iJS666 model. DNA, RNA and
protein coefficients (left) are defined by the amount of constituent monomers. For example,
18.763 mmol gDW-1 h-1 of dATP are required to produce 1 mmol gDW-1 h-1 of a DNA molecule
with 100 total deoxyribonucleotides. In the case of phospholipids and acyl-ACP all values
are in mmol gDW-1 h-1 and the components of biomass are expressed in mmol gDW-1. ... 39
Table 2.2. Automatic confidence scoring system used in iJS666 model. ... 43
Table 2.3. MSM proposed by Hartmans et al., 1985 (left). Exchanged metabolites and exchange bounds (right). ... 45
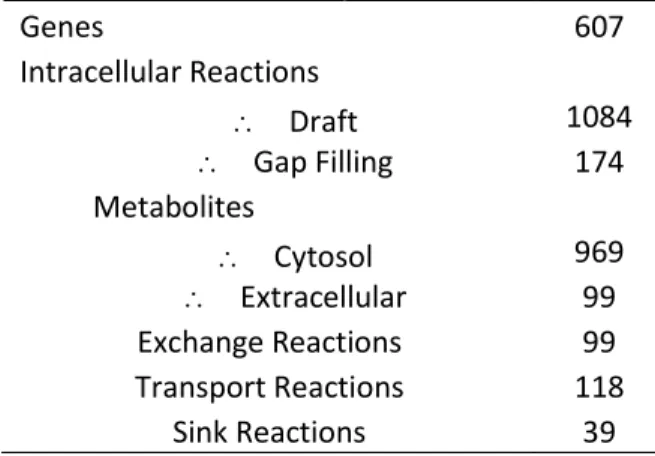
Table 3.1. Metabolic network proprieties of iJS666. ... 51
Table 3.2. Root dead-end metabolites added as sink reactions. ... 52
Table 3.3. Real specific growth rate of Polaromonas sp. strain JS666 and predicted specific growth rate from iJS666 model using different mediums. Green and red rows represent
carbon sources with positive and negative growth associated, respectively. Blue rows refer
to liquid cultures further assessed in Figure 3.5 and extrapolated specific growth rate values
determined as described in Chapter 2.3.*Experimental data from Alexander, 2010;
+Experimental data from Nishino et al., 2013. ... 57
Table 3.4. Converted specific oxygen consumption rates (RO2) to iJS666 model. Initial data
from Nishino et al., 2013. ... 58
Table 3.5. cDCE degradation pathways in iJS666 and respective fluxes. (µ=0.0043 h-1,
Rs=0.561 mmol gDW-1 h-1) ... 61
Tabela 3.6. Re-annotated reactions for the glyoxylate synthesis from glyoxal and respective
xvii Table 3.7. Predicted biostimulant compounds by iJS666 on cDCE medium, (Rs=0.561 mmol
gDW-1 h-1). Rb – specifc biostimulant consumption rate (mmol gDW-1 h-1). ... 70
Abbreviations
TCE – trichloroethene DCE – 1,1-dichlrorethene cDCE – cis-1,2-dichloroethene tDCE – trans-1,2-dichloroethene VC – vinyl chloride
PVC – polyvinylchloride
USEPA – United States Environment Protection Agency ETH – ethene
DNAPL – Dense Non-Aqueous Phase Liquid MW – Molecular Weight
Kh–Henry’s constant
AOTC – Air Odor Threshold Concentration MCL – Maximum Concentration Level P&T – Pump and Treatment
rRNA – ribosomal ribonucleic acid k– Specific substrate utilization rate Ks– Half-velocity transformation constant kbp - 103 base pairs
AkMO – alkene monooxygenase
CSIA – Coumpound-Specific Isotope Analysis DCA – 1,2-dichloroethane
SJCA –St. Julien’s Creek Annex
GENRES – Genome-scale Metabolic Network Reconstructions BLAST – Basic Local Alignment Search Tool
PRIAM – Enzyme Specific Profiles for Genome Annotation KEGG – Kyoto Encyclopedia of Genes and Genomes BRENDA – BRaunschweig ENzyme DAtabase GPR – Gene-Protein-Reaction Association GEM – Genome-scale Model
ODE – Ordinary Differential Equations FBA – Flux Balance Analysis
FVA – Flux Variability Analysis
COBRA – COnstraints Based Reconstruction and Analysis NCBI – National Center for Biotechnology Information NAD – Nicotinamide adenine dinucleotide
ATP – Adenosine triphosphate
xix NGAM – Non-Growth-Associated Maintenace
Rs – Specific Substrate Consumption Rate RO2– Specific Oxygen Consumption Rate TCA – TriCarboxylic Acid cycle
1. Introduction
1.1. Chlorinated Ethenes: A Worldwide Pollution Problem
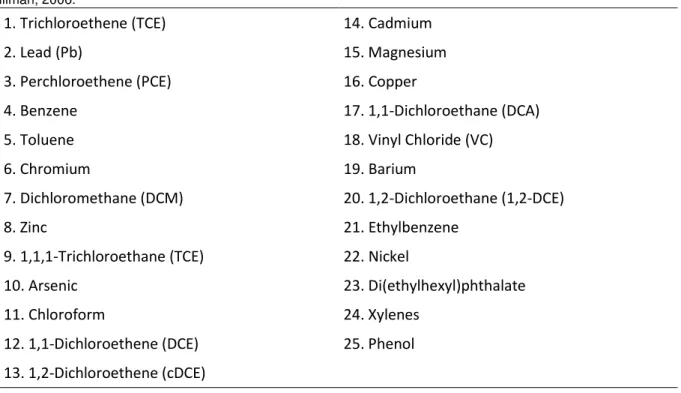
The class of compounds known as chlorinated ethenes (chloroethenes or chloroethylenes) include all the molecules with an ethene backbone and one or more chlorines replacing the hydrogen positions. These include perchloroethene (PCE), trichloroethene (TCE), three forms of dichloroethene: 1,1-dichloroethene (DCE), cis-1,2-dichloroethene (cDCE), and trans-1,2-dichloroethene (tDCE), and vinyl chloride (VC). PCE, TCE and cDCE are worldwide for use as industrial solvents and degreasers and are particularly commonly used in dry cleaning and metal fabrication (USEPA, 2000). Likewise, in plastic industry, VC is produced for polymerization into the plastic polyvinylchloride (PVC) (Kielhorn et al., 2000). Therefore, it is not surprising to find them among the “Top 25 Most Frequently Detected Priority Pollutants at Hazardous Waste Sites in North America and in Europe” (Alvarez & Illman, 2006) (See Table 1.1). The cleanup of these and other volatile organic compounds is estimated to cost “more than $45 billion dollars (1996 dollars) over the next several decades” (USEPA, 2000).
Table 1.1. The 25 Most Detected Pollutants at Waste Sites in North America and Europe.Adapted from Alvarez & Illman, 2006.
Frequently the chloroethenes are leaked into the ecosystem as PCE or TCE. On the anaerobic zones where they are introduced, different microorganisms from Dehalobacter, Dehalospirillum, and Dehalococcoides genera reduce those compounds into dehalogenated daughter products usually by using hydrogen, acetate or lactate as electron donors (Christ et al., 2005). Although communities of these organisms have been shown to completely dehalogenate PCE and TCE to ethene (ETH), a nontoxic compound degradable by many other bacteria) this process is often stalled at the daughter
1. Trichloroethene (TCE)
14. Cadmium
2. Lead (Pb)
15. Magnesium
3. Perchloroethene (PCE)
16. Copper
4. Benzene
17. 1,1-Dichloroethane (DCA)
5. Toluene
18. Vinyl Chloride (VC)
6. Chromium
19. Barium
7. Dichloromethane (DCM)
20. 1,2-Dichloroethane (1,2-DCE)
8. Zinc
21. Ethylbenzene
9. 1,1,1-Trichloroethane (TCE)
22. Nickel
10. Arsenic
23. Di(ethylhexyl)phthalate
11. Chloroform
24. Xylenes
12. 1,1-Dichloroethene (DCE)
25. Phenol
21 products cDCE or VC usually due to insufficient supply of electron donor and/or inadequate microbial-community composition (Löffter et al., 2013).
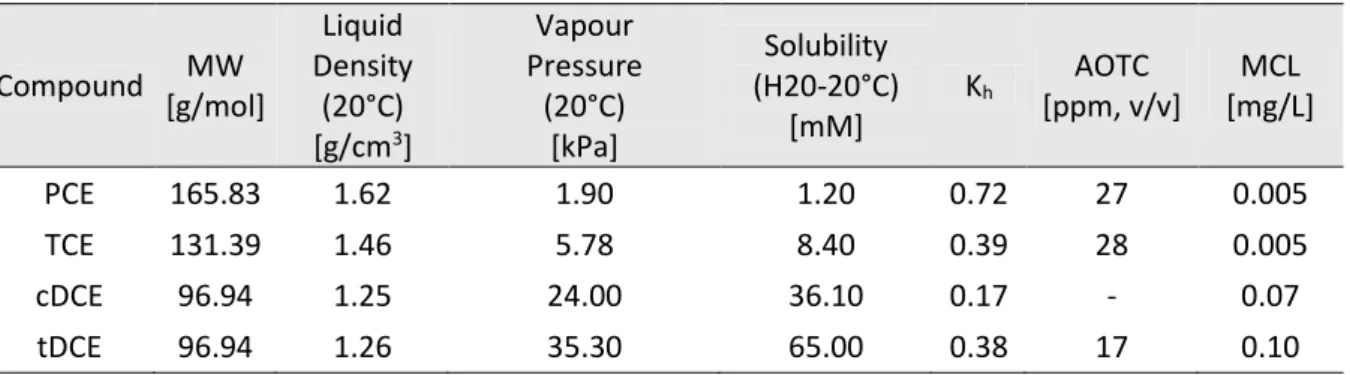
Chloroethenes have a higher density than water and therefore have the tendency to accumulate below the aquifer forming a Dense Non-Aqueous Phase Liquid (DNAPL). Since, they are also hydrophobic compounds usually they are adsorbed into soil particles and therefore have an increased recalcitrance. VC only occurs in the dissolved and gaseous phases is the only known the exception. This phenomenon is one of the main causes for the long term chloroethenes pollution in aquifers (Christ et al., 2005). Release of these chloroethene compounds to the environment from leakage or improper disposal often results in groundwater contamination, which puts people at risk of exposure through their drinking water. Chlorinated ethenes have been shown to have serious liver and central nervous system effects, and several are proven carcinogens (USEPA, 2000). Some of the daughter products produced in the partial anaerobic dehalogenation (especially VC) are more toxic and carcinogenic than their precursors (Kielhorn et al., 2000). For this reason, the USEPA has set very low limits for chlorinated ethene pollution in groundwater (USEPA, 2000), as reported in Table 1.2.
Table 1.2. Properties of Chlorinated Ethenes. Adapted from Löffter et al., 2013; Kh –Henry’s Law Constant; AOTC
– Air Odor Threshold Concentration; MCL – Maximum Concentration Level.
1.2. (Bio)remediation of Chlorinated Ethenes
In order to remediate the contaminated groundwater of the affected sites several different treatment technologies were tested over the years. Pump and Treatment (P&T) was initially used along with the reduction of the chloroethenes. This process involves pumping large volumes of groundwater out of the sediment, followed by on-site treatment with chemical oxidation or adsorption onto activated carbon, then return of the treated water to the ground. Although this technology was able to decontaminate dissolved chloroethenes, long operational periods were often needed in order to allow dissolution of this recalcitrant compounds at great monetary expense (De Wildeman & Verstraete, 2003) and still residual contamination would be present in the ecosystem (Christ et al., 2005).
Permeable reactive barriers have also been used to treat chlorinated ethene pollution by reductive dechlorination to ethene, a more benign compound that occurs naturally in the environment. These barriers consist of trenches filled with an electron donor matrix (such as zero-valent iron or zinc)
Compound
MW
[g/mol]
Liquid
Density
(20°C)
[g/cm
3]
Vapour
Pressure
(20°C)
[kPa]
Solubility
(H20-20°C)
[mM]
K
hAOTC
[ppm, v/v]
MCL
[mg/L]
PCE
165.83
1.62
1.90
1.20
0.72
27
0.005
TCE
131.39
1.46
5.78
8.40
0.39
28
0.005
cDCE
96.94
1.25
24.00
36.10
0.17
-
0.07
that will reduce the contaminants as the groundwater plume flows through. Although, the degradation efficiency of this using chemical donors could exceed 85% for cDCE (Mahendra et al., 2007) and had the advantage of lower operational costs than pump-and-treat remediation, some problems arise when geological site singularities make the construction of a barrier difficult or when long-term efficacy of this strategy with the less oxidized of the chlorinated ethenes (cDCE and VC) decreases (De Wildeman & Verstraete, 2003).
Of the technologies used to remediate contaminated sites, in situ bioremediation is recognized as being the most promising and cost-effective solution. Bioremediation, the removal or detoxification of xenobiotic compounds by living organisms, is currently a popular and proven strategy for sites contaminated with chlorinated ethenes in a variety of ways (Löffter et al., 2013).The most common bioremediation strategy takes advantage of the ability of some microbes to reductively dechlorinate these compounds sequentially in a similar way to the permeable reactive barriers action. As referred before, microbes capable of dehalogenate PCE and TCE are fairly common, but only members of the genus Dehalococcoides have been shown to achieve complete reductive dechlorination to ethene and chloride ion (Dworkin et al., 2001). Subsequently after the identification of this microorganisms and their potential role in biodegradation, a huge number of bioaugmentation applications were executed worldwide (See Figure 1.1).
Figure 1.1. Bioaugmentation using Dehalococcoides spp. for site cleanup. Adapted from Lyon & Vogel,
2013.
23 bioremediation of chlorinated ethene plumes frequently stalls, resulting in accumulation of cDCE (the most common form of DCE) and/or VC (DiStefano et al., 1991), see Figure 1.2.
Figure 1.2. Representation of chloroethene groundwater contamination. Adapted from Jennings, 2008.
An alternative to co-metabolic oxidation of chlorinated ethenes is assimilative oxidation, where chlorinated ethenes are used simultaneously as carbon and energy source. Several microbial species were isolated from soil that are capable of VC-assimilation (Hartmans et al.,. 1985; Verce et al., 2000; Verce et al., 2001), but early work prospecting contaminated aerobic plumes showed that indigenous microorganisms in black-water stream sediments were also capable of aerobic assimilative oxidation of cDCE without any additional co-substrates, yet no causative organism was initially isolated (Bradley & Chapelle, 2000). More recently, Coleman et al. (2002a and 2002b) sought after aerobic bacteria that use VC and cDCE as sole carbon and energy sources. In that work 12 isolates were produced that achieved autonomous growth in a medium with VC as the only carbon and energy source, corroborating that such microbes are commonly found in the aerobic zones of VC-contaminated plumes. Also as a result of that work, only one isolate microorganism, Polaromonas sp. strain JS666, was able to aerobically oxidize cDCE as sole carbon and energy source (Coleman et al., 2002b).
1.3.
Polaromonas
sp. strain JS666
Polaromonas sp. strain JS666 apparently requires no exotic growth factors, it is considered a promising bioaugmentation agent for aerobic sites where cDCE has accumulated since this accumulation in aerobic subsurface environments is a common problem in the remediation of contaminated sites where other chloroethenes were previously partially degraded (Bradley, 2003). Also, aerobic remediation might be preferred over anaerobic reductive dechlorination in situations where the cDCE concentration is low (but still above maximum concentration limit) due to the co-metabolic competition previously referred; where the aquifer is partial or fully aerobic since anaerobic microorganisms could not endure this conditions; and/or where the byproducts of anaerobic biological activity (methane, sulfides, reduced iron, etc.) are adverse to Polaromonas sp. strain JS666 growth (Giddings et al., 2010a).
25
Figure 1.3. 16S rRNA phylogenetic tree of Polaromonas spp. Bootstrap values for 100 trials and the percentage of
variation in sequence identity are both shown in the figure. Adapted from Osborne et al., 2010.
Recently it was found that Polaromonas is one of the most commonly occurring genus in granular activated carbon filters used to treat surface and ground water (Magic-Knezev et al., 2009). This is consistent with the common observation of Polaromonas species in extremely oligotrophic environments (Page et al., 2004; Loy et al., 2005; Kämpfer et al., 2006). In addition to that, Polaromonas species tend to be slow-growing and psychrotolerant, which hamper their isolation from environmental samples by ordinary methods (Irgens et al., 1996; Darcy et al., 2011; Margesin et al., 2012). The strain JS666 is no exception, having long latency times and a doubling time of 74 ± 8 hours being very difficult to cultivate in vitro. The strain number “666” praises those characteristics. (Coleman et al., 2002b).
The growth yield of Polaromonas sp. strain JS666 on cDCE is 6.1 ± 0.4 g protein/mole cDCE, which is comparable to VC-assimilating bacteria, despite the lower energy content of cDCE (Coleman et al., 2002b). A maximum specific substrate utilization rate (k) of 12.6 ± 0.3 nmol/min/mg protein and a half-velocity constant for cDCE transformation (Ks) of 1.6 ± 0.2 μM were determined (Coleman et al., 2002b). Moreover, cDCE was degraded routinely to below 0.03 μg/L by Polaromonas sp. strain JS666 (Coleman et al., 2002b). So, in the context of bioaugmentation or natural attenuation potential, the Polaromonas sp. strain JS666 have the capability to extract enough energy from cDCE for reasonable growth and simultaneously degrade cDCE to a concentration below the MCL (see Table 1.2.) without significant effects on substrate utilization rate (Coleman et al., 2002a; Verce et al., 2001).
biodegradation gene cluster is present in nearly identical copies on the chromosome and the 360 kbp plasmid within a 9.9 kbp duplicated region. This duplication may have been mediated by two nearby transposases, and the increase in gene dosage could have played a role in the adaptation of Polaromonas sp. strain JS666 to growth on chlorinated alkenes or aromatics (Mattes et al., 2008). Many other catabolic genes are found closely associated with transposable elements throughout the genome, indicating recent acquisition and/or rearrangement of genes necessary for the degradation of various xenobiotic compounds, including alkanes, cycloalkanes, and cyclic alcohols (Mattes et al., 2008).
While the specifics remain to be determined, it appears likely that the acquisition of the two plasmids by Polaromonas sp. strain JS666 was a major step in the evolution of its cDCE assimilating capability. This hypothesis is supported by the observation that these two plasmids have been maintained by the strain throughout enrichment, isolation, and many generations of growth in the laboratory, suggesting that they are necessary for growth on cDCE (Coleman et al., 2002b; Mattes et al., 2008). The cDCE degrading phenotype has also been found to be unstable, which would be consistent with plasmid or transposon-carried genes, but may also be due to imperfect regulatory control of the newly constructed pathway (Alexander, 2010).
Concerning the cDCE degradative pathway(s), due to the structural similarities between cDCE, VC, and ethene, Polaromonas sp. strain JS666 was expected to grow on both VC and ethene. VC-assimilating microbes oxidize the VC molecule by an alkene monooxygenase (AkMO), then this chlorinated epoxide metabolite is conjugated with coenzyme M and incorporated into the metabolism of the cell (Mattes et al., 2010). Therefore, epoxidation of cDCE by a monooxygenase was a reasonable hypothesis supported by the observation that this microorganism also produces epoxyethane from ethene at an increased rate after growth on cDCE (Coleman et al., 2002a). However, no homologue of the typical downstream epoxyalkane coenzyme M transferase was identified in the Polaromonas sp. strain JS666 genome.
An integrated ‘omics’ study was conducted using proteomic mass spectrometry, microarray techniques, CSIA (Compound-Specific Isotope Analysis) and enzyme assays in order to establish the cDCE degradative pathway (Jennings et al., 2009). This approach revealed upregulated genes of Polaromonas sp. strain JS666 bacteria grown in cDCE. They included genes for cyclohexanone monooxygenase, glutathione-S-transferase, cytochrome P450 and genes for (di)chloroacetaldehyde, (di)chloroacetate, and (chloro)glycolate transformation were also upregulated in a pattern expected for growth on cDCE or 1,2-dichloroethane (DCA). The results of both molecular techniques and CSIA suggested that cDCE degradation via monooxygenase catalyzed epoxidation (teorically achieved by cyclohexanone monoxygenase, Bpro_5565) may be only a minor pathway and that the initial step in the major cDCE degradation pathway involves carbon-chloride bond cleavage due to the isotope fractionation pattern obtained in the CSIA, most likely to be a glutathione-S-transferase catalyzed initial dehalogenation reaction. Further research was needed to identify the functional activity of upregulated enzymes and to identify their roles in the cDCE degradation pathways of this unique Polaromonas specie (Jennings et al., 2009).
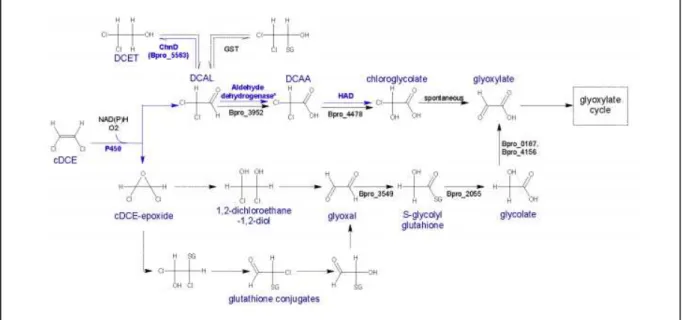
27 cytochrome P450 monooxygenase (Bpro_5301) is responsible for the initial steps in cDCE biodegradation because cDCE was degraded only in the presence of oxygen, degradation was inhibited by cytochrome P450-specific inhibitors, heterologously expressed cytochrome P450 monooxygenase catalyzes the transformation of cDCE to dichloroacetaldehyde (Alexander, 2010), and Bpro_5301 gene was upregulated 3.5-fold by cDCE accordingly to the findings of Jennings et al., 2009. Probably, the glutathione-S-transferase, upregulated 99.8-fold on cDCE medium, participates in the detoxification of the minor cDCE-epoxide compound produced by cytochrome P450 or in the detoxification of the (di)chloroacetaldehyde produced in the main degradation pathway (Cox, 2012; Nishino et al., 2013), as displayed in Figure 1.4.
Figure 1.4. Simplified pathway(s) of cDCE degradation in Polaromonas sp. strain JS666. Blue arrows represent pathways that were confirmed with biochemical evidence. Black arrows indicate pathways supported by iTRAQ study. Dotted arrows indicated proposed and not yet confirmed reactions. Genes involved in the reactions are represented bellow the arrows and the generic terms on top. From Cox, 2012.
1.4. Genome-scale Metabolic Modeling
1.4.1.
GENRES: Genome-scale Metabolic Network Reconstructions
With the recent growth in genomics research, sustained by the decreasing DNA sequencing prices, complete genomic sequences of a multitude of species are assembled at an unprecedented rate (Wetterstrand, 2015) Therefore, it’s evident that full comprehension of encoded functionality is displaced from that increased knowledge rate. A perfect example of this discrepancy is evident for Polaromonas sp. strain JS666 whose genome is completely sequenced although few biochemical evidences were further obtained (Mattes et al., 2008; Jennings et al., 2009).
Genome-scale metabolic network reconstructions (GENRES) try to achieve a complete understanding of the metabolic features of an organism by assembly a network of metabolic reactions catalyzed by enzymes and transporters found on the annotations made for the genome sequence (Palsson, 2009). Such gene annotations are often generated by applying prior knowledge to the genomic sequence using automated algorithms, like for example BLAST, which compares the sequence similarity to previously known enzyme sequences and identifies best matching homologs or PRIAM, which attempts to fit a novel sequence into position-specific enzyme profiles based on the discovered domains.
29 With the increasing number of whole sequenced genomes, there was also an increasing number of newly annotated genes and pathways discovered. The number of GENRES is therefore also increasing although at much slower rate (Palsson, 2009). In order to help researcher in the infamous task of building a genome-scale metabolic networks, automated reconstruction software packages were developed. These bioinformatics tools retrieve the stored information in the previously described databases in order to assemble automatically a draft reconstruction of the metabolism of a specific organism. Some software like Model SEED and PathwayTools have the ability of automatically predict the GPRs based solo in the annotation (Karp et al., 2011), filling up network gaps (Karp et al., 2009) and even converting the network to functional models (Karp et al., 2009; Overbeek et al., 2014). Hamilton & Reed, in 2014, made a review that reported the principal functionalities of the most commonly used prediction software, as shown in Table 1.3.
However, since many of the functions of gene products are predicted from prior knowledge derived from orthologous genes, some predictions result in unannotated or even missannotated enzymes (Schnoes et al. 2009). Even if the enzyme annotation is correct, some of those enzymes are able to use different substrates simultaneously, challenging the identification of their function inside the cell. Also, with the increasing number of annotated genes on those databases the predictions made by software that use those same databases have lesser confidence about specific functionality. For example, PathwayTools (more specifically PathoLogic) have included predictive algorithms based on the phylogeny of the organisms to sort out false positives reactions from the metabolic reconstruction (Karp et al., 2009). Simultaneously, with the increased interest in systems biology and especially in the genome-scale metabolic modelling, illustrative high quality protocols were developed in order to help researchers in the manual curation stage necessary to debug the obtained draft network (Thiele & Palsson, 2010).
Currently produced genome-scale reconstructions usually have a genome coverage around 20%, due to the large percentage (30-40%) of hypothetical proteins unannotated in the genome (Wittig & De Beucklelaer, 2001) and due to the fact that many of the predicted coding sequences belong to non-physiologically relevant proteins. That means that it’s necessary to complement the initial list of enzymes with other sources of biochemical knowledge, in order to fill gaps, add new pathways that confer specific attributes or to have a globally higher confidence level in the reconstructed metabolic network. In instances where the metabolic network model is missing one or more reactions to complete a metabolic pathway, the researcher has to decide whether to include a biochemical reaction lacking any source of evidence.
1.4.2.
GEMS: a Constraint-based Approach
31 a brief review on the used methodologies - Flux Balance Analysis (FBA) and Flux Variability Analysis (FVA) - is hereby given;
FBA is a widely used technique for constraint-based modeling of metabolic networks. It defines each enzymatic and transport reaction in the metabolic network as a flux, and computes a pseudo steady-state distribution of the flow of metabolites within constrained flux bounds set for the model, thereby allowing the researcher to examine the interdependency of various metabolic pathways from a systems perspective (Palsson et al., 2006; Orth et al., 2010).
The first step in a FBA is to mathematically represent metabolic reactions. The core feature of this representation is in the form of a stoichiometric matrix (S) of size m × n. Every row of this matrix represents one unique compound in each compartment (for a system with m compounds) and every column represents one reaction (for a system with n reactions). The entries in each column are the stoichiometric coefficients of the metabolites participating in a reaction being a negative coefficient for every metabolite consumed and a positive coefficient for every metabolite that is produced, assuming that substrates are in the left side and products on the right side of the balanced equation (Orth et al., 2010).
The matrix of stoichiometries imposes mass-balanced fluxes in the system, ensuring that the total amount of any compound being produced must be equal to the total amount being consumed at the pseudo steady-state. The other constraint of this model defines the space of allowable flux distributions of a system—that is, the rates at which every metabolite is consumed or produced by each reaction.
Therefore, to every reaction will be given upper bound (ub) and lower bound (lb), which define the maximum and minimum allowable fluxes of the reactions, respectively. In irreversible reactions, the minimum flux is always set to zero. The flux through all of the reactions in a network is represented by the vector v, which has a length of n. The system of mass balance equations at a pseudo steady-state
will assume that x, the vector of metabolite concentrations, will not have any change over time since the production and consumption of all metabolites are balanced (Orth et al., 2010).
𝒅𝐱 𝒅𝒕 = 𝟎
In the biological system’s level, that means;
𝐒 . 𝐯 = 𝟎
In any realistic large-scale metabolic model, there are more reactions than metabolites (n> m)
combination of fluxes, where c is a vector of weights indicating how much each reaction (i.e. biomass reaction when simulating maximum growth) contributes to the objective function. If the reaction to be maximized already include all the metabolites that should be maximized then c will be a vector of zeros with a positive entry equal to 1 in the column of the reaction to be maximized. This is the case when the biomass components are displayed in the same equation – the biomass equation.
𝐙 = 𝐜𝑻. 𝐯
In this sense, the output of FBA is a particular flux distribution, v, which maximizes or minimizes the objective function, can be displayed as linear problem;
𝐦𝐚𝐱𝐢𝐦𝐢𝐳𝐞 (𝐙) 𝑆𝑢𝑏𝑗𝑒𝑐𝑡 𝑡𝑜:
𝐒 . 𝐯 = 𝟎
𝒍𝒃𝒊≤ 𝐯𝒊 ≤ 𝒖𝒃𝒊 , 𝟏 ≤ 𝒊 ≤ 𝒏
In order to solve this equation system with many variables, the use of dedicated computational linear solvers is needed. Several system biology software that included dedicated solvers are available to the public, but the COBRA (COnstraint-Based Reconstruction and Analysis) toolbox is one of the most popular and includes methods to simulate, analyze and predict a variety of metabolic phenotypes, network gap filling, 13C analysis, metabolic engineering, omics-guided analysis and network visualization (Schellenberger et al., 2011). Over the years, new methodologies for analyzing genome-scale metabolic networks were developed based on FBA. Some of those are gene deletion studies (OptKnock), minimization of metabolic adjustment (MOMA), dynamical FBA (dFBA), parsimonious FBA (pFBA), robustness analysis and FVA, being the last one also used in this dissertation and described below (Palsson, 2006; Schellenberger et al., 2011);
FVA is used to find the minimum and maximum flux for reactions in the network while maintaining some pre-established state of the network. Applications of FVA for molecular systems biology include the exploration of alternative optimal solutions, studying flux distributions under suboptimal growth, investigating network flexibility and network redundancy for example. FVA starts as a regular FBA, maximizing or minimizing a particular objective function, but then uses the achieved objective flux(es) value(s) as a fixed (optimal (γ=1) or suboptimal (γ <1)) constraint and executes
simultaneously a minimization and maximization of each remaining individual fluxes in order to predict their variability in the system, as described in Gudmundsson et al., 2010;
33
𝐒 . 𝐯 = 𝟎
𝒍𝒃𝒊≤ 𝐯𝒊 ≤ 𝒖𝒃𝒊 , 𝟏 ≤ 𝒊 ≤ 𝒏
Then;
𝑴𝒂𝒙𝒊𝒎𝒊𝒛𝒆/𝑴𝒊𝒏𝒊𝒎𝒊𝒛𝒆 (𝐯𝑖)
𝑆𝑢𝑏𝑗𝑒𝑐𝑡 𝑡𝑜:
𝐒 . 𝐯 = 𝟎
𝒘𝑻 . 𝐯 ≥ γ.Z , 𝟎 ≤ 𝜸 ≤ 𝟏
𝒍𝒃𝒊≤ 𝐯𝒊 ≤ 𝒖𝒃𝒊 , 𝟏 ≤ 𝒊 ≤ 𝒏
1.4.3.
Genome-scale Metabolic Networks in Bioremediation
Biotechnology industries have beneficiated significantly from the development of metabolic networks and respective modeling (Saha et al., 2014). However, concerning the field of bioremediation, the development of genome-scale metabolic networks has only recently emerged (Oberhardt et al., 2009). As stated by Mahadevan et al., 2011, there exists a wide diversity of unexplored metabolic reactions encoded in the genomes of microorganisms that have an important environmental role. Similar approaches that have been used in the field of biotechnology could accelerate the elucidation of the physiology and ecology of these microorganisms and could guide optimization of the practical applications in the field of bioremediation.
Bioremediation takes advantage of a microbe’s ability to reduce and potentially eliminate toxic
effects of environmental pollutants. Additionally, microbes capable of degrading harmful waste produce useful chemicals as byproducts, and hence are intriguing production organisms as well (DESe Lorenzo, 2008). An updated list of the genome-scale metabolic networks that were used in order to correlate and predict bioremediation events are listed below;
Acinetobacter baylyi is an innocuous soil bacterium that degrades pollutants (e.g. biphenyl, phenol, benzoate, crude oil, nitriles) and produces lipases, proteases, bioemulsifiers, cyanophycine, and biopolymers. Acinetobacter baylyi is easily transformed and manipulated by homology-directed recombination, enabling straightforward metabolic engineering. Therefore, the genome-based model is accompanied by an extensive library of mutants, and was validated against wild type growth phenotypes in 190 environments and gene essentiality data for nine environments (Durot et al., 2008).
Geobacter metallireducens reduces Fe3+ and is used in bioremediation of uranium, plutonium, technetium, and vadium. Its ability to produce electrically conductive pili makes it useful for harvesting electricity from waste organic matter and as a biocatalyst in microbial fuel cell applications. Using G. metallireducens GEM, growth on different electron donors and electron acceptors was investigated. Model analysis revealed energy inefficient reactions in central metabolism, and experimental data suggested that the inefficient reactions were inactive during biomass optimization on acetate, but up-regulated when grown with complex electron donors. Additionally, the model was tested for flux predictions by comparison with 13C labeling flux analysis. Simulations suggested that the tricarboxylic acid cycle was used to oxidize 91.6% of acetate, in agreement with 90.5% in 13C labeling experiments (Sun et al., 2009).
Geobacter sulfurreducens has similar industrial applications to G. metallireducens and is also able to reduce Fe3+ (Mahadevan et al., 2006). OptKnock was applied to the G. sulfurreducens GEM to improve extracellular electron transport (Izallalen et al., 2008). Gene deletions in the fatty and amino acid pathways and in central metabolism were predicted to increase respiration and cellular ATP demand. To study the ATP demand increase, an ATP drain was added to the GEM. The model showed the rise in ATP usage correlated to decreased biomass flux and increased respiration rate. Experimental results confirmed that an ATP drain demonstrates the predicted results. Increasing electron transfer in G. sulfurreducens has advantages in both bioremediation and microbial fuel cell development, though increased fuel cell current was not found with this mutant strain (Mahadevan et al., 2006; Izallalen et al., 2008).
Rhodococcus erythropolis is a remarkable bacteria used for bioremediation and fuel desulfurization. On a study developed by Aggarwal et al., 2011, it was reported the reconstruction of the first genome-scale metabolic model for R. erythropolis that could successfully predict cell growth results and explaining several experimental observations in the literature on biodesulfurization using dibenzothiophene. The in silico experiments and flux balance analyses allowed to propose minimal media, determine gene and reaction essentiality, and compare effectiveness of carbon, nitrogen, and sulfur sources (Aggarwal et al., 2011).
Rhodoferax ferrireducens strain DMS 15236 is one of the few known facultative microorganisms that can grow anaerobically by oxidizing organic compounds to carbon dioxide with Fe3+ serving as the electron acceptor. This attribute, as well as its ability to grow at the low temperatures found in many subsurface environments, suggests that it could contribute to the oxidation of organic matter coupled to the reduction of Fe3+ in many soils sediments. The genome of R. ferrireducens harbors genes for benzoate degradation that are likely to be active under both aerobic and anaerobic conditions. The R. ferrireducens model contains a pathway for benzoate degradation, and predicts the growth of R. ferrireducens on benzoate with Fe3+ as an electron acceptor (Risso et al., 2009).
35
1.5. Dissertation Overview
In order to comprehend the influence of different extracellular compounds on the Polaromonas sp. strain JS666 metabolism a representative in silico genome-scale metabolic model was reconstructed for this microorganism. This knowledge platform was built by integrating information provided from genome annotation and biochemical data from past studies. The produced model was further compared against physiological and phenotypic data using FBA and FVA with the purpose of validating the final model, hereby designated iJS666.
2. Methods
2.1. Hardware and Software Environment
The model reconstruction and the in silico analysis performed in this study were done on a Windows 7 Professional, 64 bit operating system with an AMD FX-4100 QuadCore Processor (3.60 GHz), 4GB of RAM.
All the initial raw data used on the draft reconstruction was extracted from PathwayTools software (V18.0 Tier 1) that simultaneously predicted the initial enzymatic reactions and GPRs.
MATLAB® (v8.0.0.783, R2012b, The MathWorks, Inc) was simultaneously used to convert the Microsoft Excel previously obtained file into a COBRA model and to execute all necessary scripts present in the COBRA Toolbox (v2.0.6), being glpkmex the linear solver used on the constraint-based algorithms. Since many other scripts and functions were developed during this dissertation, the complete MATLAB programming code is displayed in Supplementary Data 1 and sorted by script/function sequencial usage throughout this dissertation.
The iJS666 metabolic network visualization was achieved by converting the COBRA model into a .sbml file that was imported by CySBML(v1.30) into Cytoscape (v2.8.2). The CyFluxViz (v0.94) application was used for the visual representation of the reaction fluxes, simultaneously.
2.2. Genome-scale Metabolic Network Reconstruction
2.2.1. Automated Draft Reconstruction
37
2.2.2. Manual Refinement
The initial automated reconstruction file yielded a representation of an metabolic network that functioned as a starting point to the final reconstruction although extensive manual curation was need in order to obtain a functional model. The initial reactions list included many non-physiological reactions that should not be included in the final model since those reactions are not mass balanced or have any relevant information to the metabolic process. Some of the reactions excluded in this process are involved in post-translational modifications, non-metabolic protein phosphorylation activity, DNA/RNA modification and degradation, etc…, as exampled below (Thiele & Palsson, 2010);
Example 1: Non-physiological reaction excluded from model.
Protein-L-histidine + ATP → Protein-N-phospho-L-histidine + ADP + H+
Some enzymatic reactions displayed in the initial draft were presented in a generic form, in which one or more of the used metabolites were chemically unspecific. Most of these reactions were immediately excluded since it was impossible to identify the specific metabolites used by them (those reactions were easily identified by searching for metabolites with no molecular mass associated or with generic chemical terms). Some generic reactions that could be easily associated (same substrates, products and gene associations) with well-defined reactions already included in the model, were also excluded in order to avoid repetitions (Thiele & Palsson, 2010);
Example 2: Reaction excluded due to unspecific metabolites.
Carboxylic ester + H2O → Alcohol + Carboxylate + H+
Some of those enzymatic reactions present in the initial draft had unspecific cofactors. When the data revealed the generic group of the cofactor, the reaction unspecific cofactor was substituted by the most common representative cofactor for that respective group. When no information was given for the used cofactor then the reaction was modified to include NAD+/NADP+ (depending if they were present on a catabolic or anabolic pathway, respectively). This assumption lead to an insignificant flux variation since the used cofactors had interconvertible redox reactions included in the model;
Example 3: Reaction with unspecific cofactor.
Octanol + Oxidized electron acceptor → Octanal + Reduced electron acceptor
selected for those reactions. This simplification was pertinent due to the huge amount of metabolites present with an isomeric form that lead to metabolic network dead-ends. This simplification did not affect the reaction fluxes, although in the real cellular metabolism if more than one isomer is produced on the biological system, those compounds could have different downstream pathways or one of those metabolites could accumulate in the cellular pool. The only way to amend this problem in a constraint-based methodology would be to add demand reactions to simulate the consumption of such metabolites although in many cases there is no information about the inclusion rate of those metabolites in the cellular pool. Also, since the metabolic network model had the purpose to be analyzed by constraint-based methods, some polymer associated reactions, in which polymer product had a stoichiometry algebraically representation, could not be inputted with the initial format cause they had to be mass balanced due to the pseudo-stationary constraint. In order to solve this problem, those reactions were simplified to the production/consumption of their respective monomers and the polymer produced was set to a sink/depletion reaction.
Example 4: Polymeric reactions with algebraically stoichiometry.
10-formyl-THP-[γ-Glu]n + L-glutamate + ATP → 10-formyl-THP-[γ-Glu]n+1 + ADP + phosphate
In the manual curation stage, linking macromolecular reactions to the predicted metabolic reactions should be taken in consideration by the researcher in order to achieve a functional model that have the expected physiognomic characteristics, as explained in the next sections.
2.2.2.1. DNA, RNA and Protein Coefficients
DNA, RNA and protein are some of the most fundamental biomass constituents present in a cell. Therefore, the relative contribution to the biomass composition and monomer composition for each of those biopolymers are crucial for high-quality metabolic modelling (Thiele & Palsson, 2010).
Unfortunately, it was impossible, within the framework of this dissertation, to quantify experimentally the relative fractional composition values for all of those molecules in the Polaromonas sp. strain JS666 biomass and some assumptions were made based on previously published literature. More specifically, the biomass relative composition regarding those biopolymers was assessed base on the biomass composition of R. ferrireducens, the closest phylogenetically related microorganism with a correlated genome-scale metabolic model (Risso et al., 2009).
39 displayed in Kazusa database (Nakamura, 2007) for the Polaromonas sp. strain JS666, the amino-acid composition of the proteins was estimated based on the coding sequence, as reported in Table 2.1.
Table 2.1 Major macromolecules of biomass composition in iJS666 model. DNA, RNA and protein coefficients (left) are defined by the amount of constituent monomers. For example, 18.763 mmol gDW-1 h-1 of dATP are required to produce 1 mmol gDW-1 h-1 of a DNA molecule with 100 total deoxyribonucleotides. In the case of phospholipids and acyl-ACP all values are in mmol gDW-1 h-1 and the components of biomass are expressed in mmol gDW-1.
dNTPs DNAJS666 Phospholipids Heads PhospholipidJS666
dATP 18.763 cardiolipin 0.057
dCTP 31.236 phosphatidyl-ethanolamine 0.688
dGTP 31.236 phosphatidyl-glycerol 0.193
dTTP 18.763 phosphatidyl-serine 0.062
TOTAL 100 TOTAL 1
NTPs RNAJS666 Acyl-[ACP] Pool Component Acyl-[ACP]
ATP 18.904 palmitoleoyl-[acp] 1.34
CTP 31.238 cis-vaccenoyl-[acp] 0.158
GTP 31.446 palmitoyl-[acp] 0.392
UTP 18.412 3-oxo-decanoyl-[acp] 0.05
TOTAL 100 TOTAL 1.94
AA ProteinJS666 Biomass
Component Coefficient
GLY 25.85 DNAJS666 0.00104
GLU 16.56 RNAJS666 0.006566
ASP 15.82 ProteinJS666 0.001610
VAL 24.22 PhospholipidJS666 0.00256
ALA 38.93 4-methylphenol 0.00034
ARG 20.56 coenzyme A 0.000345
SER 18.03 glycogen 0.1598
LYS 11.99 heme-O 0.000034
ASN 8.67 tetrahydroxytetrahydrofuran (2r,4s)-2-methyl-2,3,3,4- 0.00102
MET 8.05 lipid A-core 0.00908
ILE 14.46 peptidoglycan 0.02614
THR 16.65 putrescine 0.03527
TRP 4.5 pyridoxal 5’-phosphate 0.000034
CYS 3.08 spermidine 0.00713
TYR 7.18 tetrahydrofolate 0.05
LEU 33.81 thiamine diphosphate 0.00034
PHE 11.38 UDP-α-glucose 0.003
GLN 12.66 FAD 0.00069
HIS 7.13 NADH 0.0022
PRO 16.47 NADPH 0.0017
SEL 1 ubiquinol-8 0.00034
2.2.2.2. Membrane Phospholipid Composition
On previously reported genome-scale metabolic networks, the membrane phospholipid fraction could vary from 9.1 % (w/w) (Thiele & Palsson, 2010) to 15 % (w/w) (Mahadevan et al., 2006) of the biomass content and have an enormous relevance on the predictive capabilities of the metabolic model due to the variable composition, high molecular weight and energetic cost for its biosynthesis (Thiele & Palsson, 2010).
Similar to the DNA, RNA and protein relative composition, the membrane phospholipid relative composition was set to be the same as in Geobacter sulfurreducens and Rhodoferax ferrireducens (Mahadevan et al., 2008; Risso et al., 2009). Nevertheless, the phospholipid composition was determined by experimental data retrieved from other Polaromonas species (Margesin et al., 2012). Some of the discovered phospholipids acyl-groups present in the Polaromonas species were not included in the previously described microorganism’s models. Therefore, the relative acyl phospholipid composition was set differently from the R. ferrireducens and G. sulfurreducens. In order to culminate this problem, the relative phospholipid composition of the Polaromonas sp. strain JS666 was set as described in the Table 2.1.
2.2.2.3. GAM and NGAM Balance
In biological systems, ATP hydrolysis is required in order to growth and to maintain some of the biological processes active. GAM (growth associated maintenance) is the consumption rate of ATP hydrolysis necessary to the growth of the microorganism. This rate represent mainly an output of energy cost necessary to DNA, RNA and protein polymerization reactions to occur. NGAM (non-growth associated maintenance) is the rate of ATP hydrolysis related to the maintenance of the cell when there is no growth occurring. For example, some reactions that contribute to the value of this rate are related with cell osmoregulation, repair mechanisms and cascade signaling. Both GAM and NGAM have a huge influence on the model predictions, especially on the predicted growth rate (Thiele & Palsson, 2010).
Usually GAM values used in genome-scale models are very similar even between different organisms although the same is not true to NGAM values. For example, Escherichia Coli model iAF1260 have a NGAM value of 8.31 mmol gDW-1 h-1 (Feist et al., 2007) while the slow growing bacteria R.
41
2.2.2.4. Final Biomass Equation
The biomass reaction accounts for all known biomass constituents, their fractional contributions to the overall cellular biomass (Thiele & Palsson, 2010). The metabolites in the biomass reaction may affect the in silico essentiality of reactions and their associated genes and when the model tries to predict the optimal growth rate accurately the fractional distribution of each compound plays an important role (Thiele & Palsson, 2010). Since the fractional quantities of the biomass precursors were not experimentally measured for Polaromonas sp. strain JS666, the remaining metabolites present on the biomass equation of the iJS666 model were set as reported in R. ferrireducens biomass equation (Rossi et al., 2006). The unit of the biomass reaction is h-1 since all biomass precursor fractions are defined in mmol gDW-1 and uptake/internal fluxes were introduced in mmol gDW-1 h-1. Therefore, the biomass reaction sums the mole fraction of each precursor necessary to produce 1 g dry weight of cells, as reported in Table 2.1.
2.2.2.5. Model Compartmentalization and Transport Reactions
Polaromonas are bacteria from the family of Comamonadaceae which belongs to the class of Betaproteobacteria and therefore are Gram-negative (Osborne et al., 2010). Hence, the iJS666 model was initially compartmentalized in cytoplasm, periplasm and extracellular spaces.
The PathwayTools software was able to predict the existence of some inner and outer membrane transport systems operating on Polaromonas sp. strain JS666 from the genome annotation. Some of those predicted reactions were in the generic form and consequently they had to be simplified or excluded in cases when the information provided was insufficient to identify the transported metabolites. There was a huge lack of information regarding the cellular localization of those enzymes and many of the periplasmic inner transport reactions would form gaps since there was no corresponding uptake from the extracellular medium.
In the early stages of the model reconstruction, an attempt was made in order to identify and debug those transport systems. PSORT 3.0 was used for the identification of membrane proteins and their intracellular localization. Subsequently, a BLASTp was performed using the CDS of those membrane proteins (data not showed) and the majority of the found results were unclear since, once again, the reactions associated to those homologous enzymes were unspecific. Also, PSORT was unable to predict the membrane localization (inner or outer) of many transmembrane proteins and consequently a simplification of the model was became absolutely necessary. All predicted transport reactions were modified, limiting the intracellular localization of a metabolite to the cytoplasm - [c] - or to the extracellular medium - [e]. The directionality of transport reactions (reversible/irreversible) was kept along with the transport mechanism (symport or antiport) as exemplified below;
ammonium[periplasmic] + H
+[periplasmic]
→ammonium[cytosol] + H
+[cytosol]
ammonium[extracellular] + H
+[extracellular]
→ammonium[cytosol] + H
+[cytosol]
Although this simplification could have a negative influence on the predictive potential, since metabolites could accumulate in different compartments within the microorganism, but it simultaneously reduced the possibility of Type III Pathway formation (Thiele & Palsson, 2010). A similar simplification was also previously reported on the R. ferrireducens model without compromising the model predictive capabilities even that those relied mainly on the transmembrane systems (Risso et al., 2009).
Finally, there was experimental evidence that some compounds could be degraded and used as carbon-sources for biomass growth (Alexander, 2010) as reported in Table 3.2. An extracellular active (with ATP hydrolysis) transport reaction was added for charged metabolites as suggested in Thiele & Palsson, 2010. In order to facilitate the mass balance of extracellular compounds and easier medium control, the uptake from extracellular medium was defined by exchange reactions in the format exampled below for all the extracellular metabolites;
Example 6: Exchange reaction between extracellular medium and the closed system.
ammonium[extracellular] ↔ (
Closed System)
2.2.3. Metabolic network debugging
2.2.3.1. Confidence score
43
Table 2.2. Automatic confidence scoring system used in iJS666 model.
2.2.3.2. Pathway Gap Filling
In every genome-scale metabolic network reconstruction the first step on the debugging mode is the identification of the metabolic gaps present in the draft network. A metabolic/pathway gap can be seen as a hole in the network that don’t allow the in silico model achieve a feasible result on the objective function/equation (e.g.: feasible growth under some specific growth condition previously determined given a set of nutrients and secretion products), making therefore the biological system unfeasible. If one had a complete knowledge about the functionality of the genome, no gap-filling would be needed. However, as reported before, a complete genome annotation is near impossible to obtain. With the increased rate of genome-scale metabolic networks, new parsimony-based algorithms to automatically fill the gaps of the network were developed although these software’s only search for possible reactions to be added to network under the available databases and it is the curator’s ultimate responsibility to decide which criteria to apply to close the metabolic gap (Latendresse, 2014).
In order to find the metabolic gaps in the iJS666 draft reconstruction, the COBRA toolbox script GapFind.m was used, as described in Thiele & Palsson, 2010. This script allowed to identify topological/root gaps and non-topological although a minor modification was made in order to also identify metabolites exclusively inserted in one reversible reaction since they would also form dead-ends. Depending on the type of formed gap and on the unbalanced metabolite, different procedures to correct those gaps were taken into consideration, as described in Thiele & Palsson, 2010. Since many reactions had to be manually introduced to the metabolic network, the identifier (‘NEWRXN’) was used
in the Excel file in order to distinguish between reactions predicted by the automatic draft reconstruction software, PathwayTools, and those manually introduced. The confidence scoring system, previously described, was also applied to this reactions.
Evidence type Confidence
score Examples
Biochemical Data 4 Direct evidence for gene product function and biochemical reaction. Strong Annotation
Evidence 3 Gene predicted by PathwayTools and reaction present on R. ferrireducens Weak Annotation
Evidence 2 Gene/Reaction only predicted in PathwayTools
Weak Evidence 2 No evidence is available but reaction is required for modeling and similar reaction is present at R. ferrireducens Modelling Data 1 No evidence is available but reaction is required for modeling.
2.2.3.4 Stoichiometric inconsistencies and cyclic infeasibilities
Assuming a set of metabolic reactions correctly mass-balanced, the metabolic reactions with the same metabolites would always have the same (or proportional) amount of stoichiometric coefficients for each metabolite, independently of the reaction directionality. Since initially the reactions were admitted in the metabolic network as they were uploaded from the database MetaCyc, a method analogous to the one presented by Gevorgyan et al., 2008, was used in order to identify possible inconsistencies in the stoichiometry of similar reactions. All the reactions which had identical metabolite constitution or similar, diverging at most by one metabolite, were found by the script similarity.m including, but not limited to, the presence of different metabolite stoichiometry, the variation in one proton molecule or the use of different cofactor (correct as described in the Manual Refinement section of Thiele & Palsson, 2010, protocol), then the comparison of those reactions and curation of eventual stoichiometric inconsistencies was done manually.
A common problem when construction metabolic network models is the formation of undesired cycles/loops within the system. Accordingly to Schilling et al., 2000, metabolic pathways could be categorized based on mathematical principles such as linear algebra and convex analysis into three different types of extreme pathways; Type I pathways, requiring the use at least of one of the primary exchange fluxes to be active, Type II pathways (or futile pathways), that only need the currency exchange fluxes (energy and reductive power) to be active and finally Type III pathways (internal loops) that do not require any of the exchange fluxes to be active (Schilling et al., 2000). Although the latter pathways do not influence the final flux rate of the objective function, it can mislead the understanding of the network and respective dependencies by predicting existent intracellular fluxes that are unrealistic accordingly to the real thermodynamic constraints.
In order to avoid those intracellular loops from the model while using COBRA toolbox, an alternatively FBA methodology was tried: Loop Less FBA (LL-FBA) as described in Schellenberger et al., 2011. This method turns any linear programming problem into a modified mixed-integer problem solving the initial problem with an additional constraint: exclusion of network fluxes that contain loops by removing solutions which the sum of the intracellular Gibbs energy is null (Schellenberg et al., 2011). Although, solving the system with this methodology was possible (same objective function flux rates but with different and lesser intracellular fluxes), it has long-processing time especially in a large genome metabolic network. As alternative the objectiveCbModel.m script presented from the COBRA toolbox was used to solve all linear problems, from this point on, using norm one minimization of internal fluxes. These different approaches had very identical results in eliminating intracellular loops (data not shown) however the second methodology had faster processing time.