EXPERIMENTAL ASSESSMENT OF IAQ IMPROVEMENT IN
NATURALLY VENTILATED EDUCATIONAL BUILDINGS
Manuel Pinto1*, Ricardo Almeida1, Paulo Pinho2, Teixeira de Lemos2 and João Lanzinha3
1: Department of Civil Engineering School of Technology & Management
Campus de Repeses 3504-510 VISEU PORTUGAL
e-mail: [email protected]; [email protected]; web: http://www.dcivil.estgv.ipv.pt/Dep/dcivil/ 2: Department of Environment
School of Technology & Management Campus de Repeses
3504-510 VISEU PORTUGAL
e-mail: [email protected]; [email protected]; web: http://www.amb.estgv.ipv.pt/Dep/amb/ 3: C-made and Department of Civil Engineering and Architecture, Faculty of Engineering
University of Beira Interior Calçada Fonte do Lameiro 6201-001 COVILHÃ PORTUGAL e-mail: [email protected]; web:
https://www.ubi.pt/Entidade.aspx?id=Departamento_de_Engenharia_Civil_e_Arquitectura Keywords: air change rate (ACH), classrooms, indoor air quality (IAQ), indoor
environmental quality (IEQ), natural ventilation protocol
Abstract Indoor environmental conditions in classrooms, in particular temperature and indoor air quality, influence students’ health, attitude and performance. In recent years several studies regarding indoor environmental quality of classrooms were published and natural ventilation proved to have great potential, particularly in southern European climate.
This research aimed to evaluate indoor environmental conditions in 8 schools and to assess their improvement potential by simple natural ventilation strategies. Temperature, relative humidity and carbon dioxide concentration were measured in 32 classrooms.
Ventilation performance of the classrooms was deeply characterized by tracer gas measurements of the air change rate assuming different windows related boundary conditions. A total of 110 tracer gas measurements were made. The complete characterization of the classrooms ventilation performance was relevant for the definition of the ventilation protocol since air change rate helped to pinpoint the best ventilation strategy for each case study. The results of the ventilation protocol implementation were very encouraging and, globally, a significant decrease on the CO2 concentration was observed without modifying the comfort
conditions.
1. INTRODUCTION
It seems clear that indoor environmental conditions in classrooms, in particular temperature and IAQ, influence students’ health, attitude and performance. Knowing that children spend a large amount of their time inside school buildings and that they are more susceptible than adults to the adverse effects of indoor pollutants, since their ratio of air breathed volume versus weight is greater and their tissues and organs are still growing [1], school buildings construction and rehabilitation must be properly planned to ensure that users have the adequate conditions for carrying out their work. In recent years several studies evaluating the effects of the classrooms environmental conditions on the learning process were published [2-6].
1.1. Air quality and hygrothermal comfort in schools
Several studies stated that, frequently, ventilation rate and CO2 concentration limits are not
complied, regardless of the ventilation system.
In France, a study was performed including 489 classrooms of 108 school building [7]. The most representative ventilation system was mechanical ventilation, installed in 20% of the schools, 60% of which had mechanical extraction. In the occupation period, 33% of the schools revealed CO2 concentrations above 1700 ppm in more than 66% of the records. It
was concluded that window opening was more frequent before classes, during breaks and at the end of classes, rarely during them. This behaviour was mainly conditioned by exterior noise and specific difficulties with opening systems. In unoccupied periods, median values of 0.12 h-1 (infiltration) and of 1300 ppm were obtained. These values suggest that the ventilation rate should be increased during the night so that in the morning children would be exposed to lower levels of CO2.
Teli et al.[8-9], through questionnaires given to 230 students belonging to 8 classrooms in a UK naturally ventilated school concluded that, out of the winter season (April to July), children prefer lower temperatures than the ones predicted in PMV and adaptive models. It is addressed the need for adjustments in existing rules regarding the thermal comfort criteria, taking into account the differences between adults and children.
A literature review published by Frontczak and Wargocki [10] on the influence of various factors on human comfort concluded that thermal comfort is the most important parameter in IEQ evaluation and that occupants of buildings with natural ventilation revealed a more adaptive behaviour.
1.2. Natural ventilation in schools
In recent years several studies regarding IEQ were published, covering schools of different levels of education with natural ventilation systems (single-sided or cross ventilation), in continuous or purge ventilation. Natural ventilation proved to have great potential, particularly in southern European climate. However, the results, particularly in terms of thermal comfort (air temperature) and ventilation rate or levels of CO2 concentration have
Coley and Beisteiner [11-12] performed measurements in UK primary schools in winter (7 classrooms) and during summer (4 classrooms). The measurements took place during a week period in each classroom and it was concluded that opening windows between classes - purge ventilation - has the potential to reduce CO2 levels to the recommended values. They
concluded that opening windows was not commonly used due to their location (above the occupied zone), or to possible air drafts and also because the staff, including teachers, was reluctant to open the windows, especially because they are not sensitized to the issue of classrooms ventilation.
Santamouris et al. [13] monitored the IAQ in 62 classrooms of 27 naturally ventilated schools of Athens. Measurements were performed in spring and fall seasons when window opening is the main ventilation procedure. Three situations were assessed: a) empty rooms and windows closed; b) during classes, with some windows opened; c) between classes, with most of the windows opened. The average flow rates obtained were 1.5 l/s/person, 4.5 l/s/person and 7 l/s/person, respectively. During the three measurement periods, 52% of the classrooms presented a CO2 concentration greater than 1000 ppm with a median value
of 1070 ppm. At the end of the class period, there was a maximum concentration of 3000 ppm with a median of 1650 ppm. A statistically significant relationship between the window opening and the difference in indoor-outdoor temperature was confirmed.
Giuli et al. [6] evaluated 7 Italian primary schools (28 classrooms), all naturally ventilated. Measurements took place in spring and the average CO2 concentration above the exterior
concentration varied between 45 and 3635 ppm. 12 classrooms exceeded this value by more than 1000 ppm. Through surveys, it was concluded that indoor conditions strongly depend on teachers’ preferences and behaviour and that windows are mainly opened during breaks. 1.3. Research motivation
Natural ventilation, as other ventilation systems, has advantages and disadvantages. However, towards the goals of reducing energy consumption and considering the adaptive possibilities of students, we believe that in Portugal and in other southern European countries, natural ventilation in schools, both new and refurbished, has a great potential for successful implementation [14]. This was the basis of the present study development. 2. METHODOLOGY
This paper focuses on the IAQ and thermal comfort and their relation with enclosure airtightness and the effect of different natural ventilation protocols in Portuguese school buildings.
The project comprises 8 schools of different levels of education (from kindergarten to college) located in the town of Viseu. A total of 32 classrooms, installed in buildings of different types and ages, and with different orientations and sun exposure, were evaluated (Table 1). Classrooms had an approximate average area of 50 m² and an internal height of 3 m. All have bottom-hung windows on the façade (exception is classroom D4) and several had small openings in the interior with adjoining corridors, allowing for the implementation of a cross ventilation strategy as described in section 4. Regarding heating systems, all the
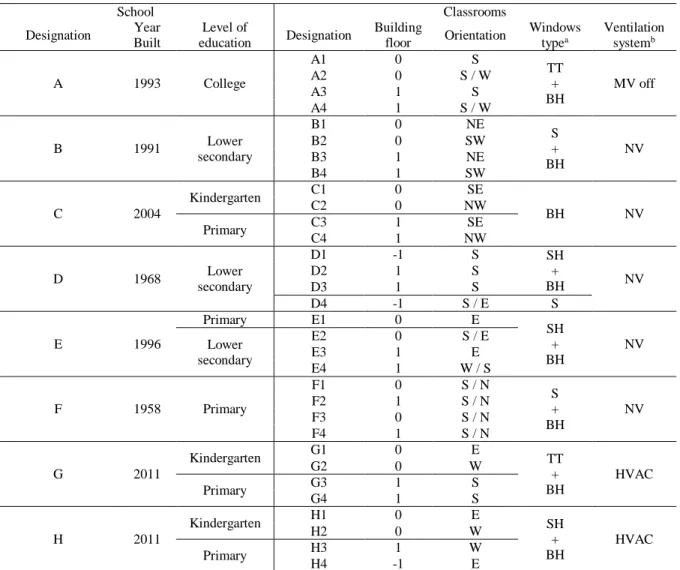
during most of the time, discontinuous and dependent on the school board instructions. School Classrooms Designation Year Built Level of education Designation Building floor Orientation Windows typea Ventilation systemb A 1993 College A1 0 S TT + BH MV off A2 0 S / W A3 1 S A4 1 S / W B 1991 Lower secondary B1 0 NE S + BH NV B2 0 SW B3 1 NE B4 1 SW C 2004 Kindergarten C1 0 SE BH NV C2 0 NW Primary C3 1 SE C4 1 NW D 1968 Lower secondary D1 -1 S SH + BH NV D2 1 S D3 1 S D4 -1 S / E S E 1996 Primary E1 0 E SH + BH NV Lower secondary E2 0 S / E E3 1 E E4 1 W / S F 1958 Primary F1 0 S / N S + BH NV F2 1 S / N F3 0 S / N F4 1 S / N G 2011 Kindergarten G1 0 E TT + BH HVAC G2 0 W Primary G3 1 S G4 1 S H 2011 Kindergarten H1 0 E SH + BH HVAC H2 0 W Primary H3 1 W H4 -1 E
aTT - tilt and turn; BH - bottom hung (tilting); SH - side hung (casement); S - sliding (horizontal sash). bMV - mechanical ventilation; NV - natural ventilation; HVAC - heating, ventilation and air conditioning.
Table 1. School building characterization.
The research was developed in 3 campaigns:
- spring 2013 (March - May): measurements were performed during 4 consecutive days in each school in occupied classrooms - hygrothermal performance (T and RH) and IAQ (CO2) were evaluated;
- summer 2013 (July - September): ACH rate measurements were performed using the tracer gas method - decay technique, in unoccupied classrooms and according to various conditions concerning window and door positions;
- autumn 2013 (September - October): same parameters as for the first campaign were measured during 2-4 days. However, in each school, 2 classrooms were selected with specific conditions for single-sided or cross ventilation and a ventilation protocol was
imposed. The other 2 classrooms had no control on the window opening. 3. IEQ ASSESSMENT
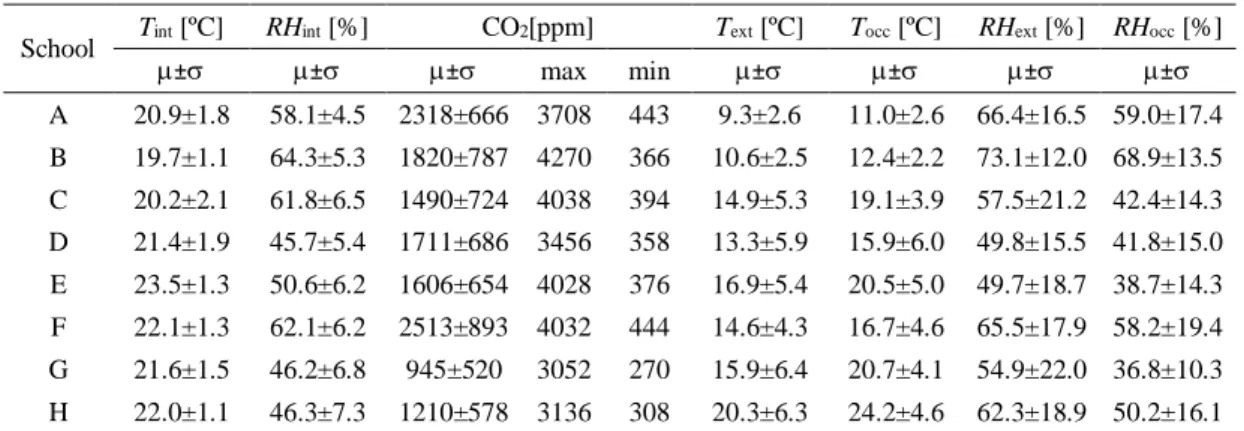
Classrooms IEQ was evaluated according to the previously described methodology. Descriptive statistical analysis of the results is presented in Table 2, which includes information about indoor temperature, relative humidity and CO2 concentration, during the
period of occupation and the correspondent weather conditions, temperature and relative humidity, both daily (Text and RHext) and only considering the period of occupation (Tocc
and RHocc).
School Tint [ºC] RHint [%] CO2[ppm] Text [ºC] Tocc [ºC] RHext [%] RHocc [%]
± ± ± max min ± ± ± ± A 20.9±1.8 58.1±4.5 2318±666 3708 443 9.3±2.6 11.0±2.6 66.4±16.5 59.0±17.4 B 19.7±1.1 64.3±5.3 1820±787 4270 366 10.6±2.5 12.4±2.2 73.1±12.0 68.9±13.5 C 20.2±2.1 61.8±6.5 1490±724 4038 394 14.9±5.3 19.1±3.9 57.5±21.2 42.4±14.3 D 21.4±1.9 45.7±5.4 1711±686 3456 358 13.3±5.9 15.9±6.0 49.8±15.5 41.8±15.0 E 23.5±1.3 50.6±6.2 1606±654 4028 376 16.9±5.4 20.5±5.0 49.7±18.7 38.7±14.3 F 22.1±1.3 62.1±6.2 2513±893 4032 444 14.6±4.3 16.7±4.6 65.5±17.9 58.2±19.4 G 21.6±1.5 46.2±6.8 945±520 3052 270 15.9±6.4 20.7±4.1 54.9±22.0 36.8±10.3 H 22.0±1.1 46.3±7.3 1210±578 3136 308 20.3±6.3 24.2±4.6 62.3±18.9 50.2±16.1
Table 2. IEQ results (spring 2013).
A clear distinction between the hygrothermal and the IAQ results must be made. Temperature and relative humidity results revealed a performance within the comfort zone according to the Portuguese regulation: average temperature above 20.0 ºC (the only exception is school B with 19.7 ºC), with a relatively small dispersion of results; r elative humidity mean values varied between 46% and 64%, and the overall oscillation is limited to the range 30-77%, usually considered as adequate indoor conditions [15]. No evident relation between indoor environment and external conditions was found, both for temperature and relative humidity. The use of heating systems for temperature correction is the most reasonable explanation.
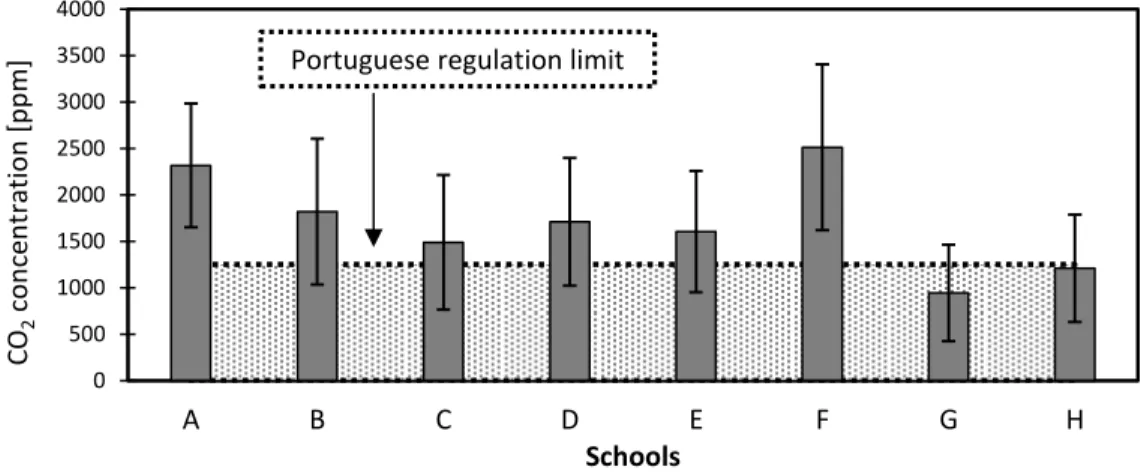
On the indoor air quality evaluation a completely different scenario was observed with high CO2 concentrations being identified, with a magnitude that, in some situations, should be a
matter of concern for the building administration. Maximum values were above 3000 ppm in all school buildings and in four of them they have increased up to 4000 ppm. Considering average values for the all period, only schools G and H presented concentrations below 1250 ppm (the Portuguese regulation concentration limit); in 6 buildings the mean value was higher than 1500 ppm and in 2 of them it was higher than 2000 ppm. The best performing schools, G and H (with HVAC), are also the most recent constructions, indicating that most modern buildings tend to perform better. On the other hand, the worst scenarios were observed in schools A and F. Since the first one is a college and the other, a primary school, no evidence of a relation between IAQ and level of education/age of students has been found. High standard deviation values of also indicate that a large
spreading of results was observed (Figure 1).
Figure 1. CO2 concentration average and standard deviation (spring 2013).
4. ACH MEASUREMENTS
ACH measurements were made on unoccupied classrooms, during summer break (August), using the tracer gas method - decay technique. According to the specific conditions of each classroom, such as windows type and position, several experimental set-ups were assessed in order to evaluate the different possibilities for natural ventilation: everything closed (only infiltration), single-sided ventilation, cross ventilation, with and without door opened. A total of 110 measurements were performed on the 32 classrooms under study. All the measurements were made according to the specified on ASTM E741: 2011.
Natural ventilation potential was assessed in the following conditions:
- everything closed or “in use” position (ex.: permanent openings above the entrance door): it is intended to simulate the current conditions of natural ventilation achieved by infiltration only;
- single-sided ventilation: it was used when classrooms did not have interior windows or other openings and 2 exterior windows were opened;
- cross ventilation: it was used when classrooms had exterior and interior openings (interior openings adjacent to the corridor) and 2 exterior and 2 interior windows were opened; - cross ventilation and door opened: identical to the previous set-up but with the entrance
door opened (0,82,0 m²).
Table 3 details the classrooms windows characteristics.
Results exposed very airtight enclosures. For the scenario of windows closed (Cl), the ACH average ranged from 0.04 h-1 in school C to 0.5 h-1 in school B, with exception of school D that presented 1.5 h-1. In fact, school D is a special case since the wood on the window
frames is deteriorated and in a very poor condition, allowing uncontrolled airflow. Another interesting conclusion is that, when available, cross ventilation (CV) has a great potential.
0 500 1000 1500 2000 2500 3000 3500 4000 A B C D E F G H CO 2 con ce n tra tio n [pp m ] Schools
In this condition, results varied between 1.6 h-1 and 7.6 h-1. Regarding the single-sided (SS) ventilation, results were more modest, ranging from 0.6 h-1 to 2.9 h-1, although still being
an interesting approach to improve the IAQ.
School
Exterior windows Interior windows
Typea Area of 1 window: wh [cm2] Opening at the topb [cm] Height to floor [m] Typea Area of 1 window: wh [cm2] Opening at the topb [cm] Height to floor [m] A BH 11060 25 2.46 - - - - B BH 54×43 19 2.24 BH 73×45 25 2.10 C BH 16856 27 1.70 - - - - D BH 7942 15 2.50 L 9051 - 2.78 E BH 9271 14 2.34 L 8642 - 2.50 F BH 12142 26 2.23 - - - - G BH 100197 10 0.72 BH 4782 7 1.89 H BH 157136 14 0.90 - - - -
a BH - bottom hung (tilting); L - louvred.
b Horizontal distance between movable and fixed frame.
Table 3. Windows characteristics.
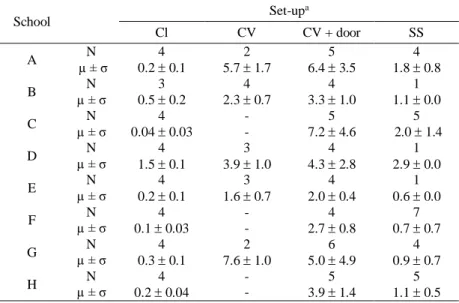
Table 4 summarizes the results in each school, including the number of samples (N).
School Set-up a Cl CV CV + door SS A N 4 2 5 4 µ ± σ 0.2 0.1 5.7 1.7 6.4 3.5 1.8 0.8 B µ ± σ N 3 4 4 1 0.5 0.2 2.3 0.7 3.3 1.0 1.1 0.0 C N 4 - 5 5 µ ± σ 0.04 0.03 - 7.2 4.6 2.0 1.4 D N 4 3 4 1 µ ± σ 1.5 0.1 3.9 1.0 4.3 2.8 2.9 0.0 E µ ± σ N 4 3 4 1 0.2 0.1 1.6 0.7 2.0 0.4 0.6 0.0 F µ ± σ N 4 - 4 7 0.1 0.03 - 2.7 0.8 0.7 0.7 G µ ± σ N 4 2 6 4 0.3 0.1 7.6 1.0 5.0 4.9 0.9 0.7 H µ ± σ N 4 - 5 5 0.2 0.04 - 3.9 1.4 1.1 0.5
aCl - windows closed; CV - cross ventilation; CV+door - cross ventilation + door;
SS – single-sided ventilation.
Table 4. ACH tests in each school (unoccupied classrooms).
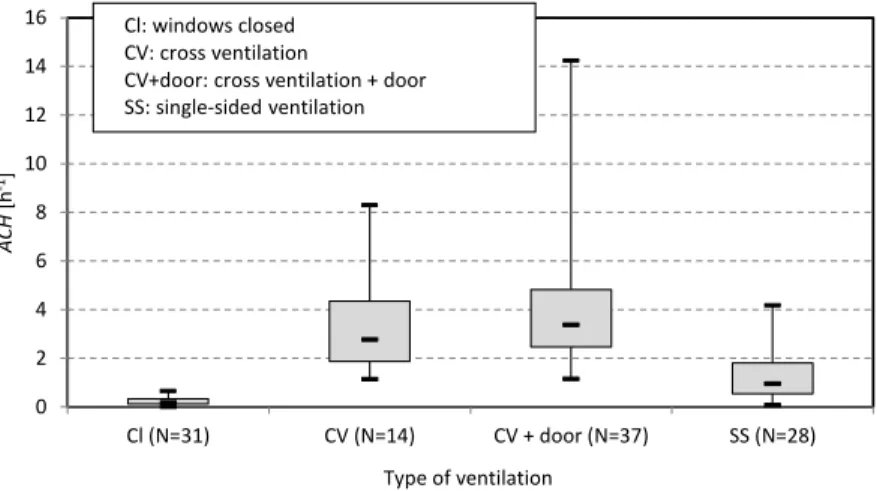
The variability of the results was also analyzed. Figure 2 presents the results box-plot. Enclosure permeability, which corresponds to the situation of windows closed, is the one that presents less variability, the other scenarios having a wider range of results. For this situation median ACH was 0.2 h-1 clearly confirming that infiltration is not sufficient to control and dilute de CO2 internal production. Therefore, additional ventilation must be
ACH of 2.8 and 1.0 h-1 were found for CV and SS, respectively. As it would be expected, CV has a higher potential. The ventilation mode CV+door, which can be implemented during breaks, presents the higher median value, 3.4 h-1 and can provide an important
contribution for the control of CO2 concentration. CV modes are the ones that present higher
variability with maximum values up to 8.3 and 14.2 h-1 for CV and CV+door, respectively.
Figure 2. Box-plot of the results of the ACH measurements (unoccupied classrooms). 5. IEQ ASSESSMENT WITH VENTILATION PROTOCOL
The following step on this investigation was then to improve the ventilation rates by simple adjustments based on a ventilation protocol, which should be implemented in such a manner that classrooms’ comfort conditions are not neglected. Therefore, in the last measurement campaign (September - October) the parameters of the first campaign were measured during 2-4 days. However, in each school, there were 2 classrooms where specific conditions for cross or single-sided ventilation were imposed (ventilation protocol - VP). This ventilation protocols were established according to the ACH results and the use of cross ventilation was limited to the situations where interior openings were available. The other 2 classrooms had no control on the window opening (NVP). Although the implementation of ventilation protocols, users had the possibility to change the conditions. The idea was to test a simple and feasible protocol, which could be applied in regular classes. Therefore, in this research were tested protocols, which were easy to implement, and that do not imposed teachers to perform specific actions during classes.
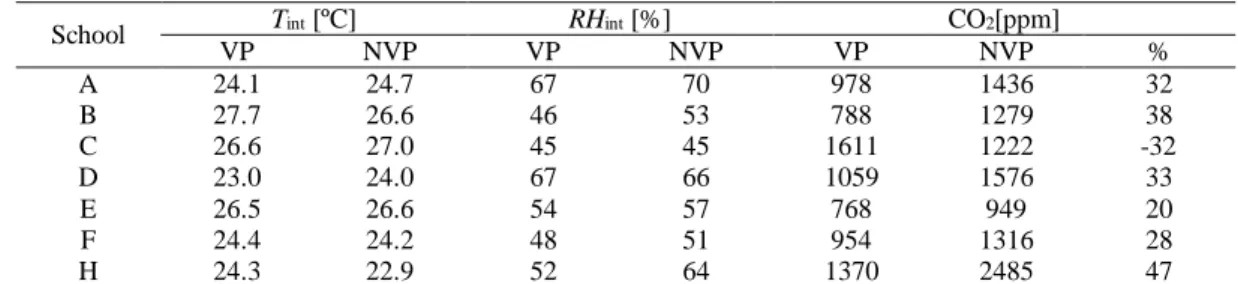
Table 5 shows the average values of air temperature, relative humidity and CO2
concentration separately for scenarios with and without ventilation protocol. The percent improvement in terms of CO2 concentration is also indicated, with positive values
corresponding to a reduction in concentration.
The introduction of a ventilation protocol resulted on an improvement of the IAQ in 6 schools. The only exception was school building C. Apart this particular situation, the implementation of the ventilation protocol was very positive: the most interesting performance was obtained in school H with a reduction of 47% in the CO2 concentration.
Another important result that must be underlined is that the comfort conditions were not
0 2 4 6 8 10 12 14 16 Cl (N=31) CV (N=14) CV + door (N=37) SS (N=28) AC H [h -1] Type of ventilation Cl: windows closed CV: cross ventilation
CV+door: cross ventilation + door SS: single-sided ventilation
neglected with this protocol since no significant difference of temperature between VP and NVP classrooms was found. Comparing results (statistically analyzed) between campaigns was the strategy to evaluate changes in comfort levels and no significant differences were found.
School Tint [ºC] RHint [%] CO2[ppm]
VP NVP VP NVP VP NVP % A 24.1 24.7 67 70 978 1436 32 B 27.7 26.6 46 53 788 1279 38 C 26.6 27.0 45 45 1611 1222 -32 D 23.0 24.0 67 66 1059 1576 33 E 26.5 26.6 54 57 768 949 20 F 24.4 24.2 48 51 954 1316 28 H 24.3 22.9 52 64 1370 2485 47
Table 5 - Air temperature, relative humidity and CO2 concentration with and without ventilation protocol
(autumn 2013).
6. CONCLUSIONS
A simple ventilation protocol based on a cross and single-sided ventilation strategy was implemented in several occupied classrooms. Results were very encouraging and, globally, a significant decrease on the CO2 concentration was observed without modifying the
comfort conditions. This strategy should continue to be explored and validated for winter conditions but from this research some recommendations can already be pointed:
- Regarding ventilation (and also lighting) improvement, interior openings should always be provided;
- Both exterior and interior windows (eg. bottom hung) should be as high as possible (opening axe > 2.00 m). and guarantee a maximum opening area (eg. for bottom hung at least 20 cm);
- A strategy based on opening doors during breaks and at the end of the day should be implemented. School board should create awareness of the consequences of poor IAQ and promote training for both teachers and school staff in order to encourage the use of the ventilation protocols;
- A protocol based on a cross and single-sided ventilation should, therefore, be implemented in Southern European countries at least during spring and fall.
REFERENCES
[1] WHO (2005): Effects of Air Pollution on Children's Health and Development: a Review of the Evidence, Ed. World Health Organization Regional Office for Europe, Copenhagen, pp. 191.
[2] DG Shendell, R. Prill, WJ Fisk, MG Apte, D Blake, D Faulkner, "Associations Between Classroom CO2 Concentrations and Student Attendance in Washington and
Idaho" Indoor Air, vol. 14, pp. 333-341, 2004.
[3] MJ Mendell, GA Heath, "Do Indoor Pollutants and Thermal Conditions in Schools Influence Student Performance? A Critical Review of the Literature" Indoor Air, vol.
5, pp. 27-52, 2005.
[4] P. Wargocki, DP Wyon, "The Effects of Moderately Raised Classroom Temperatures and Classroom Ventilation Rate on the Performance of Schoolwork by Children (RP-1257)" HVAC&R Research, vol. 13(2), pp.193-220, 2007.
[5] Z. Bakó-Biró, DJ Clements-Croome, N. Kochhar, HB Awbi, MJ Williams, "Ventilation Rates in Schools and Pupils’ Performance" Building and Environment, vol. 48, pp. 215-223, 2012.
[6] V. De Giuli, O. Da Pos, M. De Carli, "Indoor Environmental Quality and Pupil Perception in Italian Primary Schools" Building and Environment, vol. 56, pp.335-345, 2012.
[7] O. Ramalho, C. Mandin, J. Ribéron, G. Wyart, "Air Stuffiness and Air Exchange Rate in French Schools and Day-Care Centres" International Journal of Ventilation, vol. 12(2), 2013.
[8] D. Teli, MF Jentsch, PAB James, "Naturally Ventilated Classrooms: An Assessment of Existing Comfort Models for Predicting the Thermal Sensation and Preference of Primary School Children" Energy and Buildings, vol. 53, pp. 166-182, 2012.
[9] D. Teli, PAB James, MF Jentsch, "Thermal Comfort in Naturally Ventilated Primary School Classrooms" Building Research and Information, vol. 41(3), pp. 301-316, 2013.
[10] M. Frontczak, P. Wargocki, "Literature Survey on How Different Factors Influence Human Comfort in Indoor Environments" Building and Environment, vol. 46, pp. 922-937, 2011.
[11] DA Coley, A. Beisteiner, "Carbon Dioxide Levels and Ventilation Rates in Schools" International Journal of Ventilation, vol. 1(1), pp. 45–52, 2002.
[12] DA Coley, A. Beisteiner, "Carbon Dioxide Levels and Summertime Ventilation Rates in UK Schools" International Journal of Ventilation, vol. 1(3), pp. 181-187, 2003.
[13] M. Santamouris, A. Synnefa, M. Asssimakopoulos, I. Livada, K. Pavlou, M. Papaglastra, et al., "Experimental Investigation of the Air Flow and Indoor Carbon Dioxide Concentration in Classrooms with Intermittent Natural Ventilation" Energy and Buildings, vol. 40, pp.1833-1843, 2008.
[14] RMSF Almeida, VP de Freitas, "Indoor Environmental Quality of Classrooms in Southern European Climate" Energy and Buildings, vol. 81, pp. 127-140, 2014. [15] CEN (2006): Ventilation for Buildings. Design and Dimensioning of Residential
Ventilation Systems, PD CEN/TR 14788, Ed. European Committee for Standardization, Brussels, pp. 61.